



US Dollar Price Action Setups: EUR/USD, GBP/USD, USD/JPY
The US Dollar comes into early-2026 trade with an ascending triangle formation, which is somewhat similar to how EUR/USD started last year before a strong bullish reversal took over.
Share this:

We’re into the 2026 open and the US Dollar is showing an ascending triangle formation, which points to upside potential. For USD-strength, USD/JPY still stands out as an attractive venue and the pair has held and bounced from support at 156.20. Meanwhile, for USD-weakness, GBP/USD has shown a clean sequence of higher-highs and lows. EUR/USD can be justified in either direction as I looked at during the webinar and whatever pans out there will likely show impact in the broader DXY basket.
US Dollar Four-Hour Chart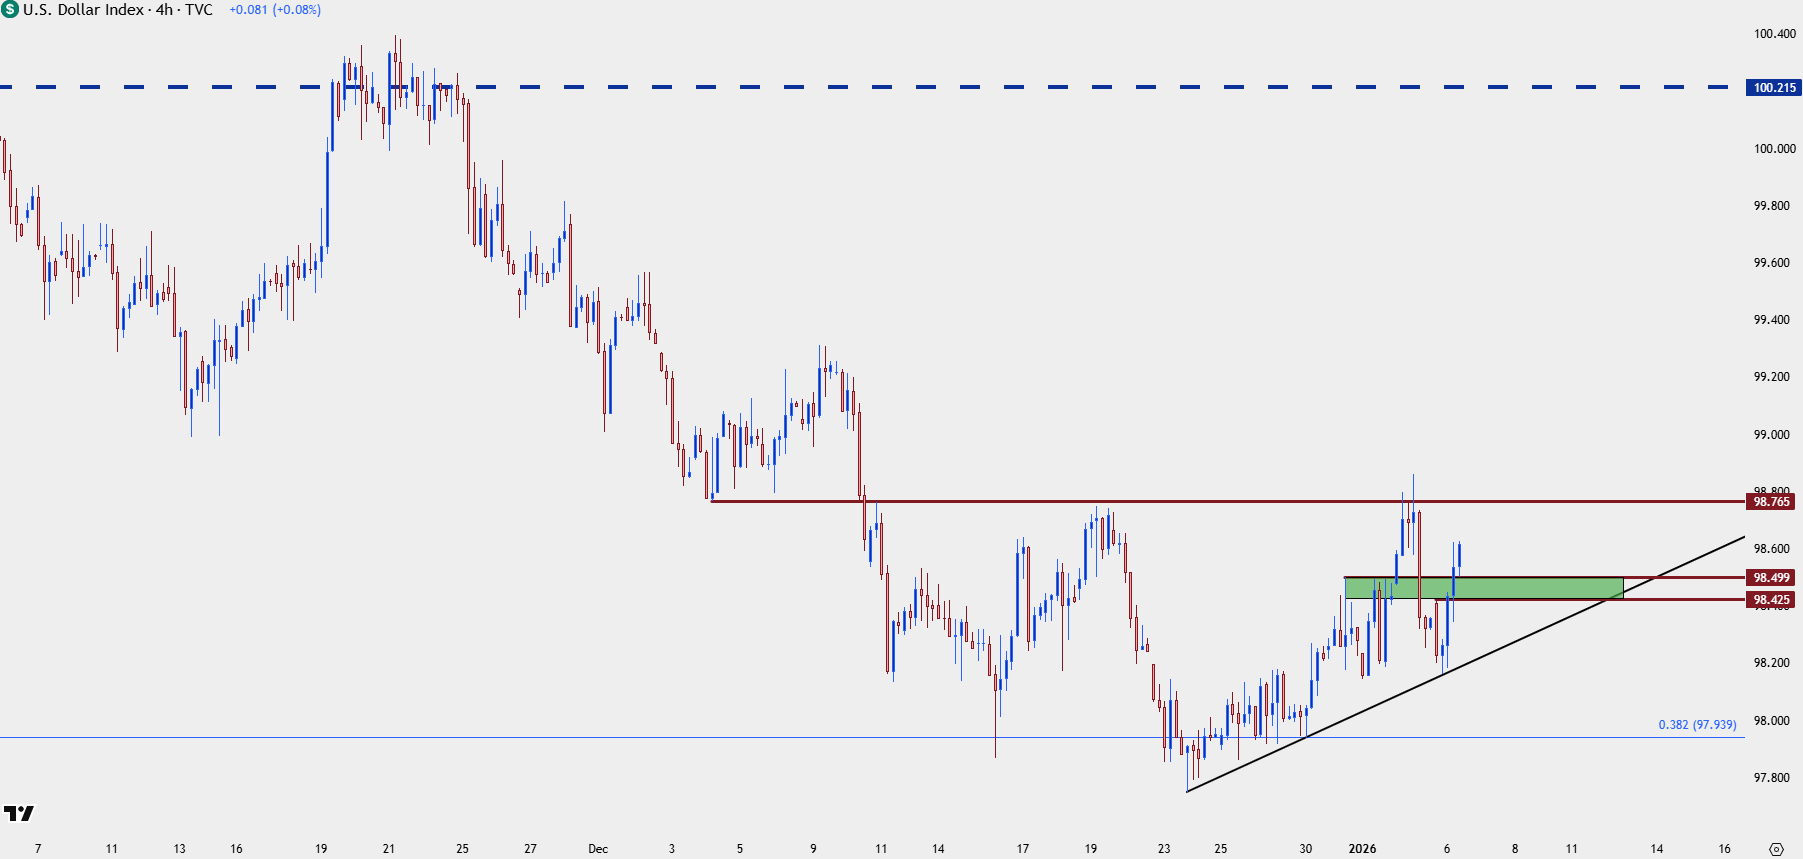
Chart prepared by James Stanley; data derived from Tradingview
EUR/USD
The ascending triangle in DXY above compares to the similar backdrop in EUR/USD from early 2025 trade last year. In both instances, a strong trend dominated until support began to show and last year in EUR/USD, it was around the 1.0200 Fibonacci level and that led to the build of an ascending triangle. Last year’s EUR/USD rally took-hold in March with a break of the 1.0500 level, leading to a strong next few months as price eventually rallied up to resistance in the 1.1686-1.1748 zone.

But for the past six months that same zone has been where buying pressure has dried up, and at this point, sellers are trying to re-take control of the matter with a sequence of short-term lower-lows and highs.
EUR/USD Daily Chart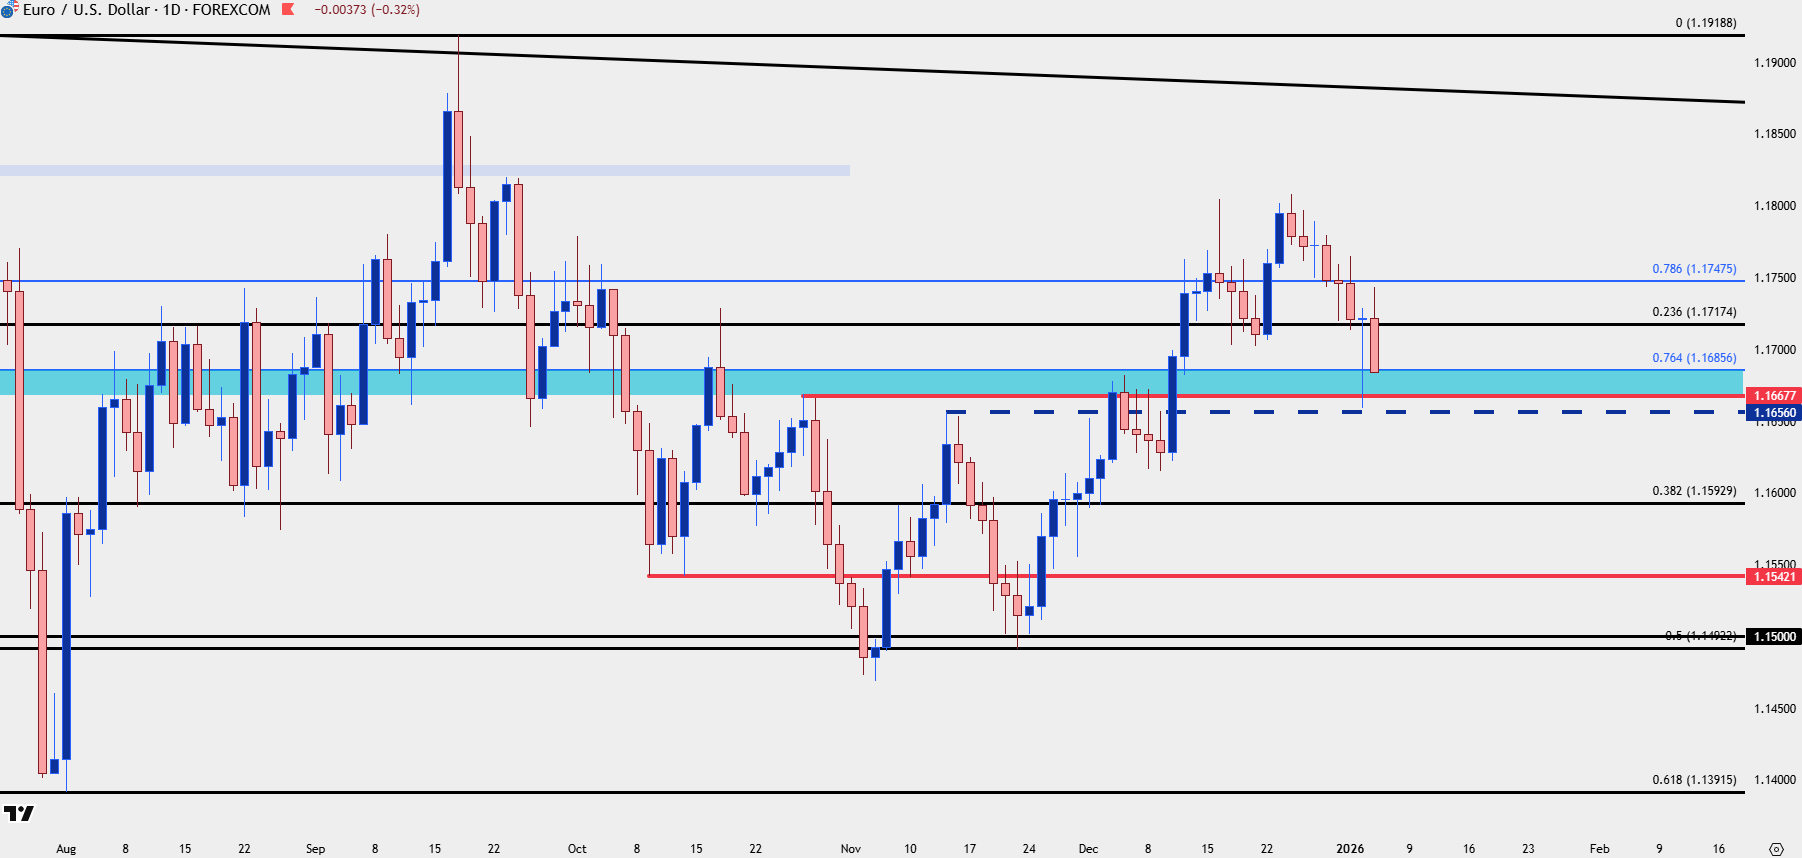
Chart prepared by James Stanley; data derived from Tradingview
GBP/USD
For USD-weakness, I still favor GBP/USD. At this point the pair is below the 1.3500 level and that remains a big spot for bullish continuation scenarios as that psychological level has historically been a major inflection point for the pair.

At this stage, there’s higher-low structure at the 1.3414 level so that’s the spot that bulls need to defend to retain control, and if we do see more significant USD-strength, that points to the next market that I’ll look at.
GBP/USD Four-Hour Chart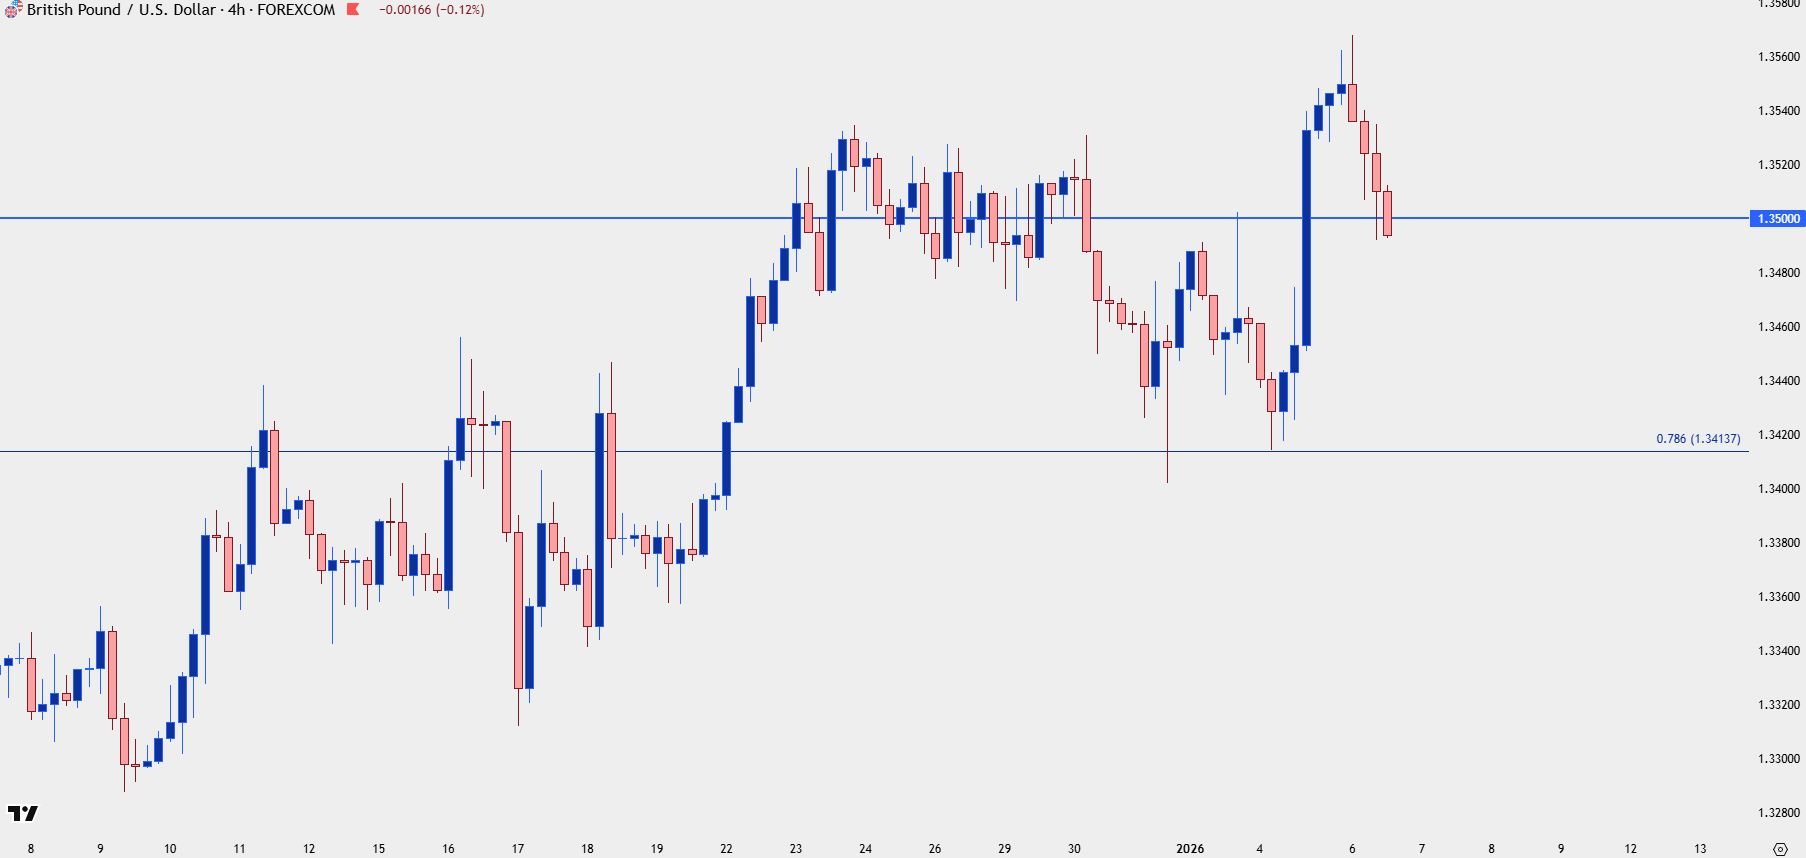
Chart prepared by James Stanley; data derived from Tradingview
USD/JPY
For USD-strength, USD/JPY is still the major market that I’m following. The pair has put in another bounce from higher-low support and as shown in the webinar, chasing this market to any degree remains challenging and possibly problematic. But – the higher-lows have held, and that keeps open the possibility of continuation on the long side of the market. And, for those that would like to avoid the USD altogether, there’s possibility for pushing Yen-weakness themes against the Euro or British Pound.
USD/JPY Four-Hour Chart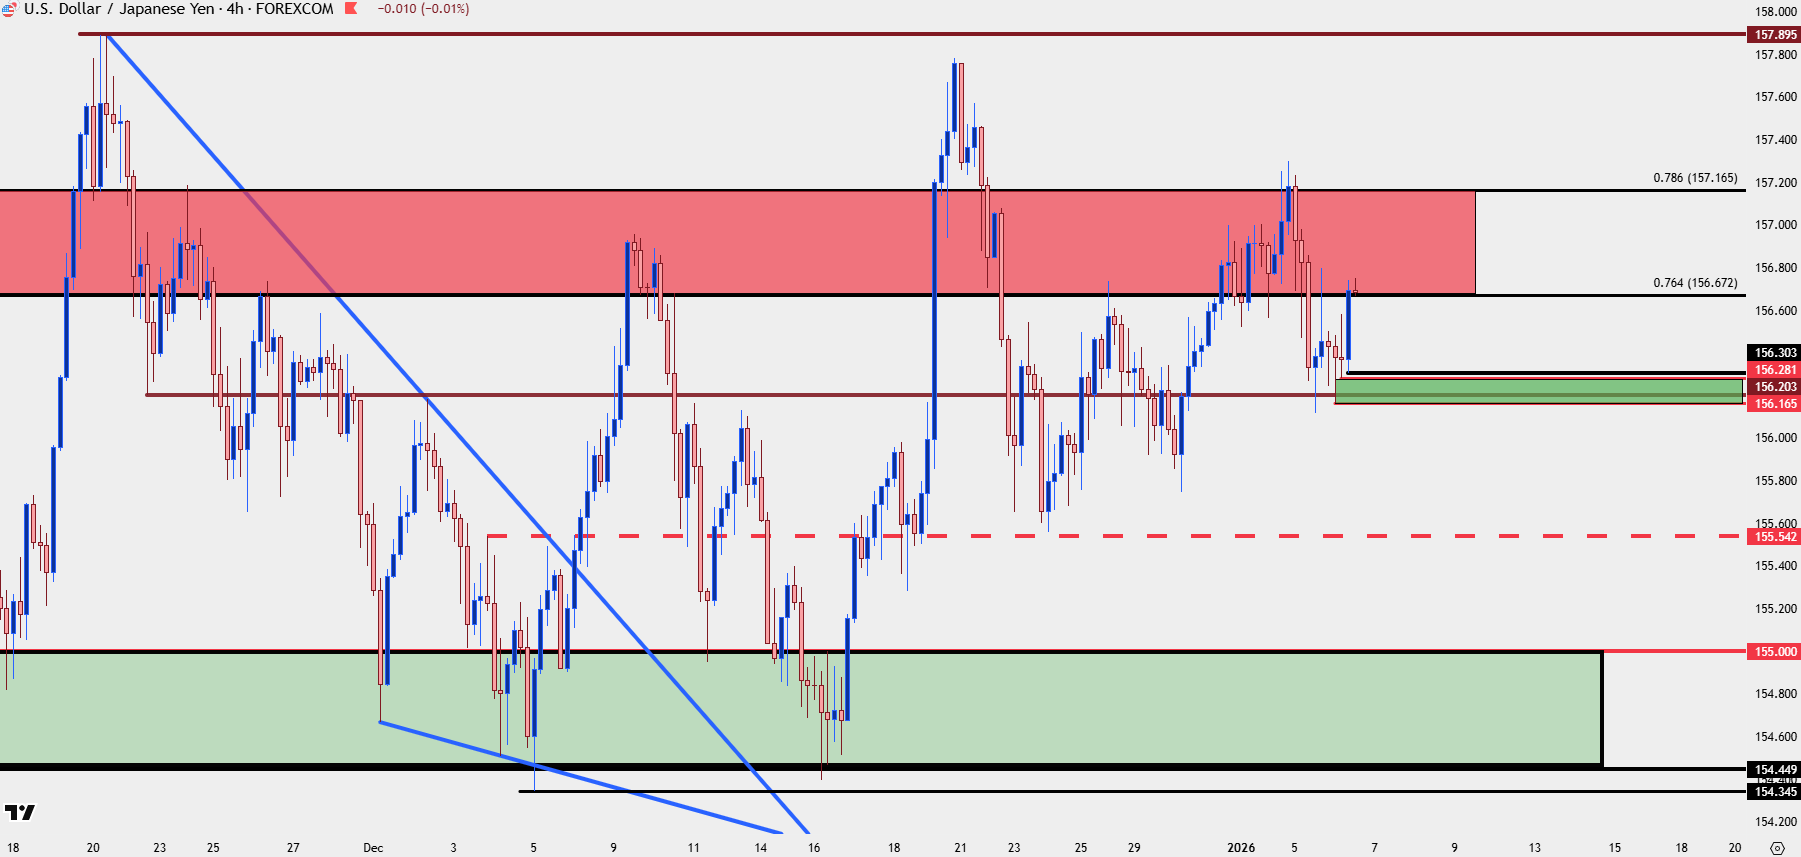
Chart prepared by James Stanley; data derived from Tradingview
--- written by James Stanley, Senior Market Analyst, Global Macro
Related tags:
Latest market news




Open an account in minutes
Experience award-winning platforms with fast and secure execution, and enjoy tight spreads from 0.5 pts on FX and 0.3 pts on indices.
Economic calendar
Web Trader platform
Our sophisticated web-based platform is packed with features.
Related articles
US Dollar Price Action Setups: EUR/USD, GBP/USD, USD/JPY, USD/CAD, Gold
The US Dollar hit a fresh yearly high and is currently testing above a major level, but EUR/USD has already pushed into extreme territory and that begs the question around continuation potential in each market. Meanwhile, USD/JPY retains bullish short-term structure.

US Dollar Technical Forecast: DXY 4% Rally Stalls at Pivotal Resistance 10 6 2026
DXY is pressing a major inflection zone as stretched momentum and shifting Fed expectations raise the stakes for the next move.


S&P500 Forecast: SPX rises to a record high on tech boost & falling yields
U.S. stocks are opening higher, with the S&P 500 briefly hitting an all-time high amid optimism surrounding AI trade and hopes of strong corporate earnings, boosting tech stocks. At the same time, oil prices are falling, pulling Treasury yields lower.

This report is intended for general circulation only. It should not be construed as a recommendation, or an offer (or solicitation of an offer) to buy or sell any financial products. The information provided does not take into account your specific investment objectives, financial situation or particular needs. Before you act on any recommendation that may be contained in this report, independent advice ought to be sought from a financial adviser regarding the suitability of the investment product, taking into account your specific investment objectives, financial situation or particular needs.
StoneX Financial Pte. Ltd., may distribute reports produced by its respective foreign entities or affiliates within the StoneX group of companies or third parties pursuant to an arrangement under Regulation 32C of the Financial Advisers Regulations. Where the report is distributed to a person in Singapore who is not an accredited investor, expert investor or an institutional investor (as defined in the Securities Futures Act), StoneX Financial Pte. Ltd. accepts legal responsibility to such persons for the contents of the report only to the extent required by law. Singapore recipients should contact StoneX Financial Pte. Ltd. at 6826 9988 for matters arising from, or in connection with the report.
In the case of all other recipients of this report, to the extent permitted by applicable laws and regulations neither StoneX Financial Pte. Ltd. nor its associated companies will be responsible or liable for any loss or damage incurred arising out of, or in connection with, any use of the information contained in this report and all such liability is hereby expressly disclaimed. No representation or warranty is made, express or implied, that the content of this report is complete or accurate.
StoneX Financial Pte. Ltd. is not under any obligation to update this report.
Trading CFDs carries a high level of risk that may not be suitable for some investors. Consider your investment objectives, level of experience, financial resources, risk appetite and other relevant circumstances carefully. The possibility exists that you could lose some or all of your investments, including your initial deposits. If in doubt, please seek independent expert advice. Visit www.forex.com/en-sg/terms-and-policies for the complete Risk Disclosure Statement.