



US Dollar Price Action Setups: EUR/USD, GBP/USD, USD/JPY, USD/CAD, Gold
The US Dollar hit a fresh yearly high and is currently testing above a major level, but EUR/USD has already pushed into extreme territory and that begs the question around continuation potential in each market. Meanwhile, USD/JPY retains bullish short-term structure.
Share this:

US Dollar Talking Points:
- This was a wide-ranging webinar looking at several macro items, with price action as a center point.
- The US Dollar is coming off of overbought conditions on the daily and EUR/USD remains oversold while testing a major spot of long-term interest.
- Also looked at in this session: GBP/USD, USD/JPY, USD/CAD, Gold, S&P 500, Nasdaq 100 and Treasuries.
As we go into Q4 the wall of worry is high. Treasury yields have pushed up to their highest levels since the Financial Collapse and with the trove of oncoming debt coming due the onslaught of supply is unlikely to help that theme. These higher borrowing costs make for a more unfriendly backdrop for both corporates and the US government, but, in and of itself, that’s not necessarily a deal killer. The continued bullish price action in equities illustrates that.
I looked into this for the Q4 forecasts, and the video below highlights that.
This content was created by an affiliate of FOREX.com and represents the views and opinions of the author/speakers, not the views and opinions of Forex.com, StoneX Group Inc., or its subsidiaries. The content has not been independently reviewed by FOREX.com.
USD
The US Dollar is already at a fresh yearly high and while USD/JPY was the major driver before, now, it’s EUR/USD. As similar debt problems have engulfed European sovereign debt markets, there’s the legitimate concern over European fragility. But, for both the US and Europe it’s in best interests for calm particularly in currency markets.
For the USD, prices are testing a major level at 101.80. As of this webinar, it was short-term support. But, chasing the move is challenging just given how stretched RSI has become, and also taken with a recent illustration of divergence given yesterday’s higher-high on price and lower-high via RSI.
For USD-strength: USD/JPY remains the most compelling market, in my opinion. For USD-weakness, GBP/USD stands out as most attractive with EUR/USD presenting a possible case, as well.
US Dollar Daily Price Chart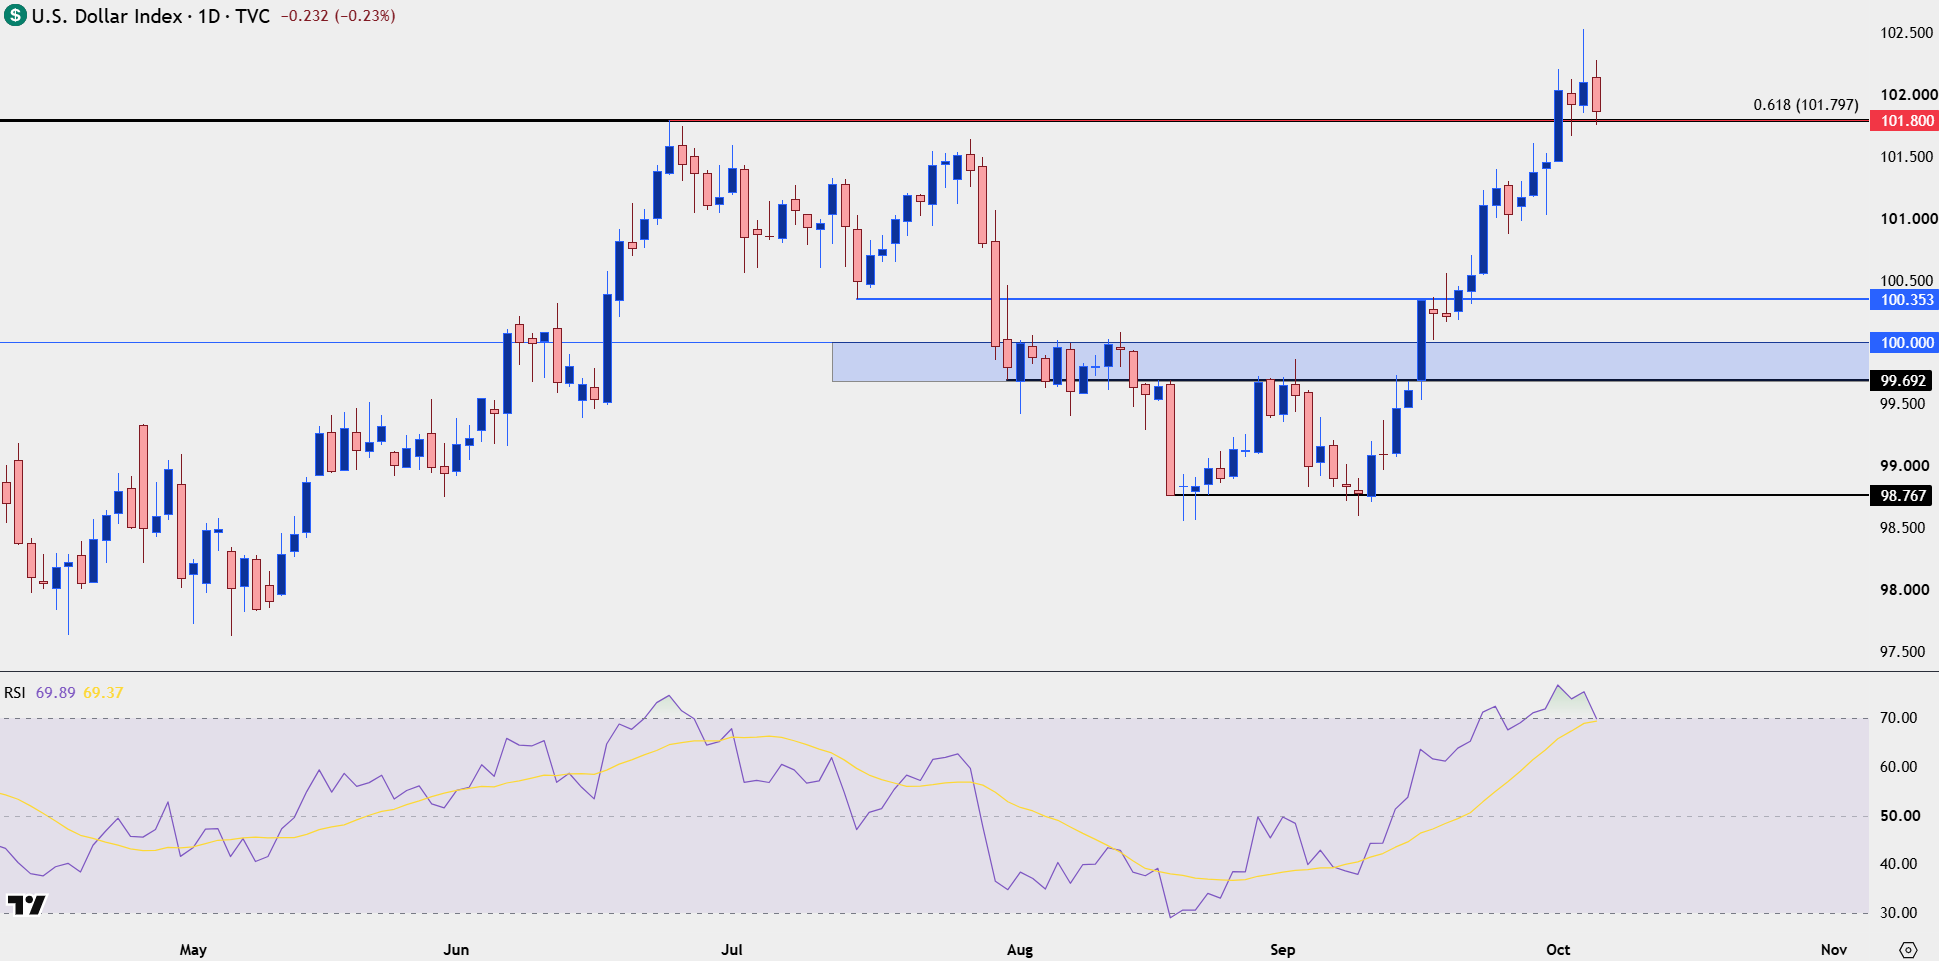
Chart prepared by James Stanley; data derived from Tradingview
EUR/USD
A central theme of this webinar was ‘capitulation,’ and I discussed that in-depth regarding the S&P 500, gold, EUR/USD and USD/CAD. For EUR/USD, the week opened with a violent move lower as a major level was tested at 1.1212, which is the golden ratio of the lifetime move in the pair.
So far, that’s led to bounce, which I’ll look at in greater detail below.
EUR/USD Monthly Chart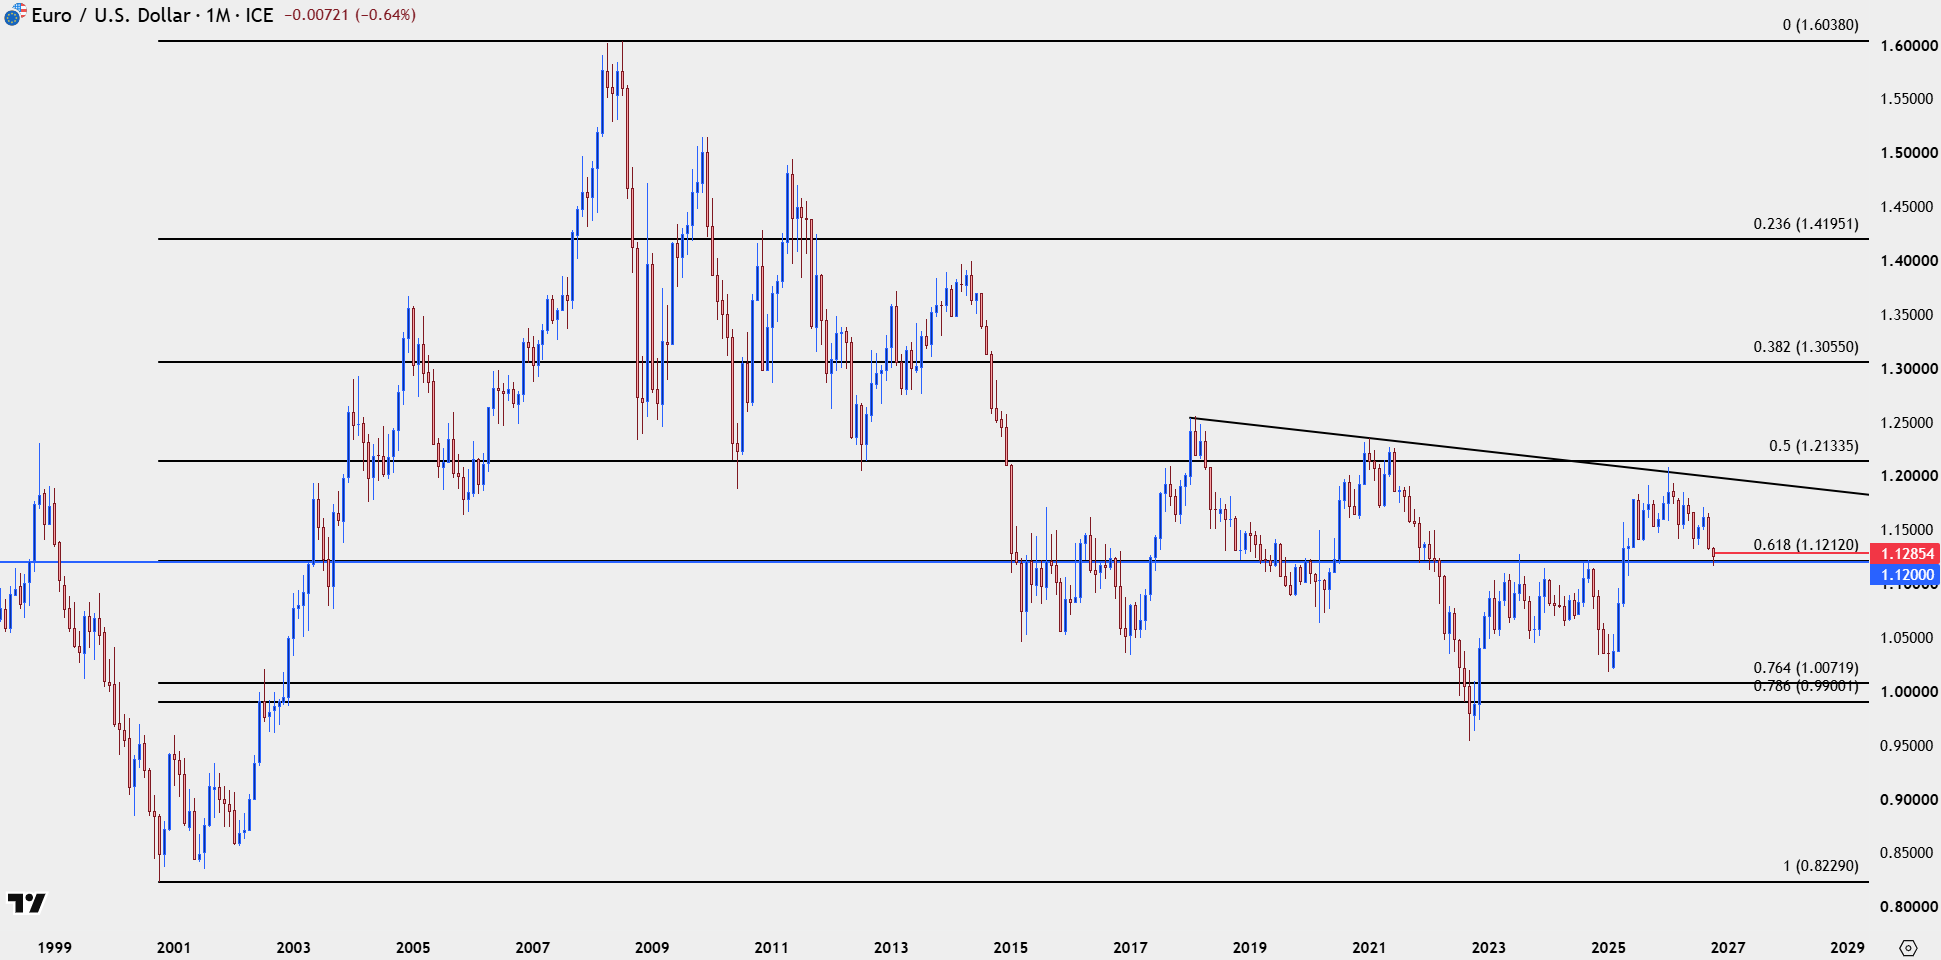
Chart prepared by James Stanley; data derived from Tradingview
EUR/USD Daily
From the daily chart we can see last week’s reading where RSI closed below 20, which is rare. This was the lowest daily close for RSI since 2015, right after a massive sell-off and it was after that prior reading when price began to bounce.
RSI is not predictive, and this doesn’t have to mean that a low is in place. But it does provide for context that chasing the move lower is a challenge when it’s already so deep into the sell-off. And combined with the possibility of support above, traders can use shorter-terms to try to build the bullish case for the pair.
EUR/USD Daily Chart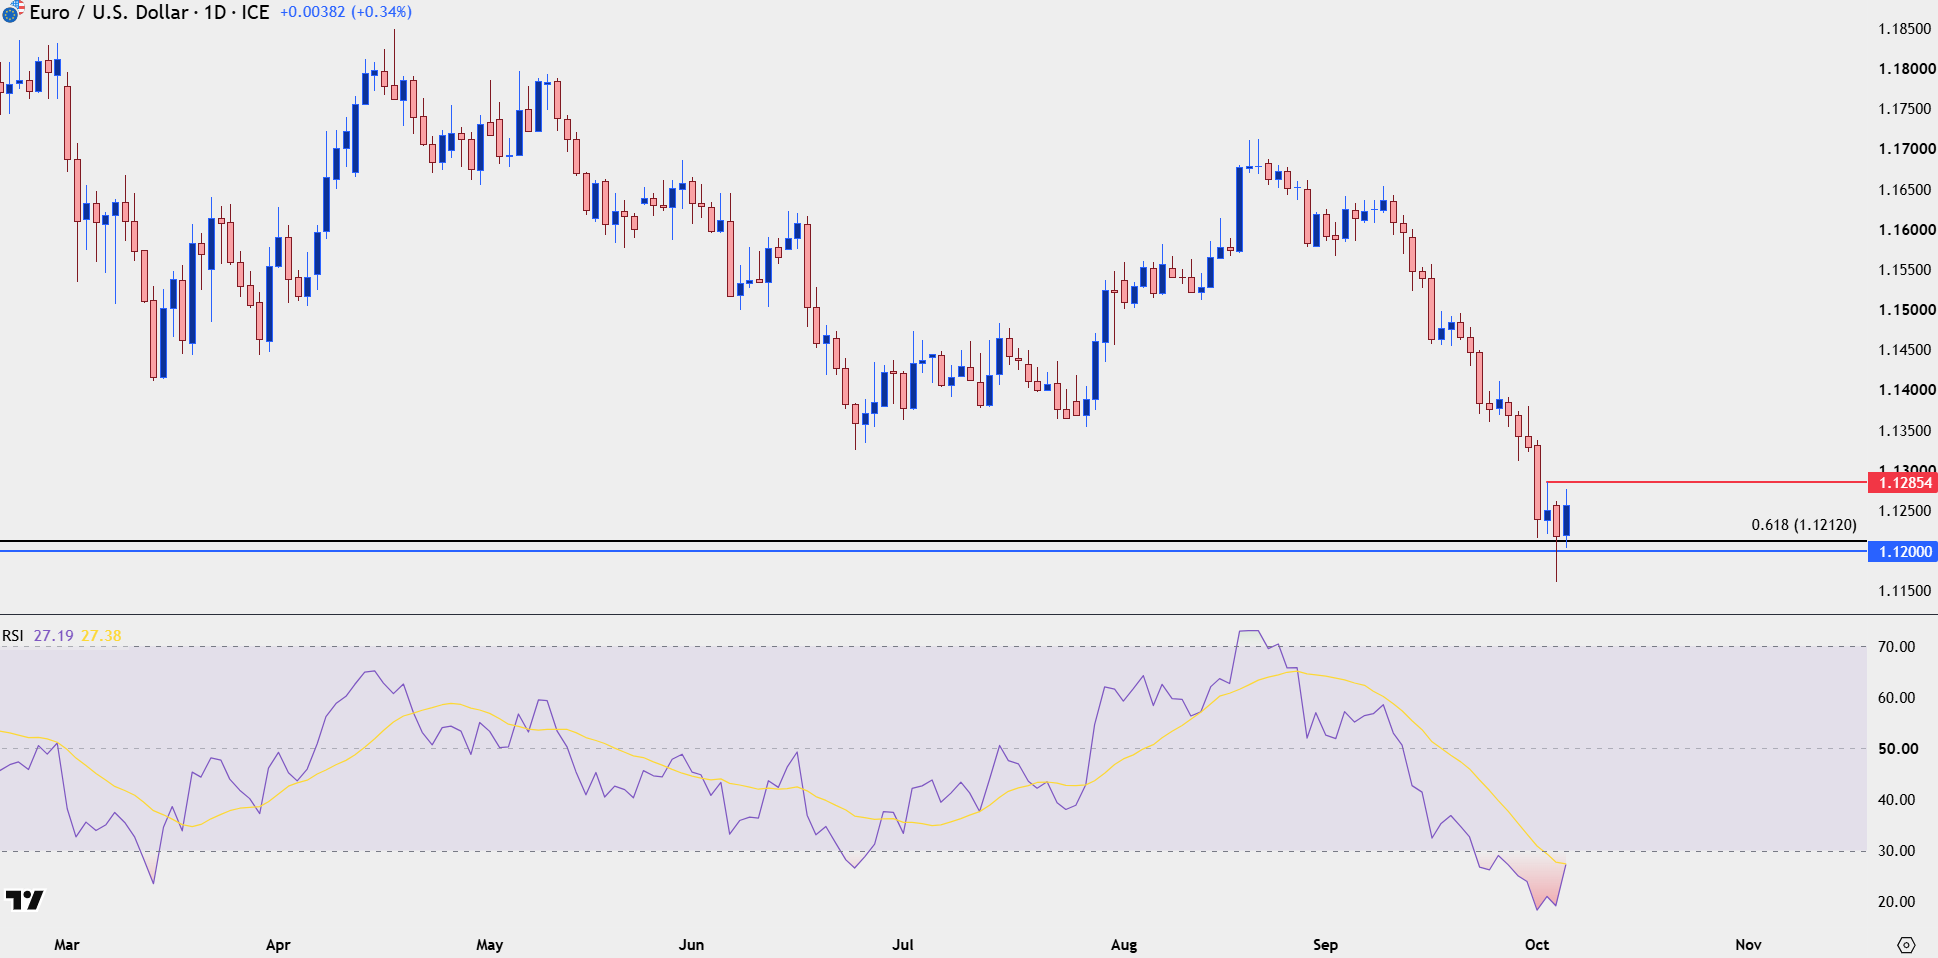
Chart prepared by James Stanley; data derived from Tradingview
GBP/USD
I’ve been tracking Cable as more attractive for USD-weakness and as illustration of that RSI has already pushed out of oversold territory. And more recently, as EUR/USD set a fresh yearly low yesterday, GBP/USD was already setting up higher-lows and the bullish move has better development on shorter-terms at this point.
From the daily, we can see another big zone being tested and for those looking for USD-weakness, this can remain as a more compelling option, at this point.
GBP/USD Daily Chart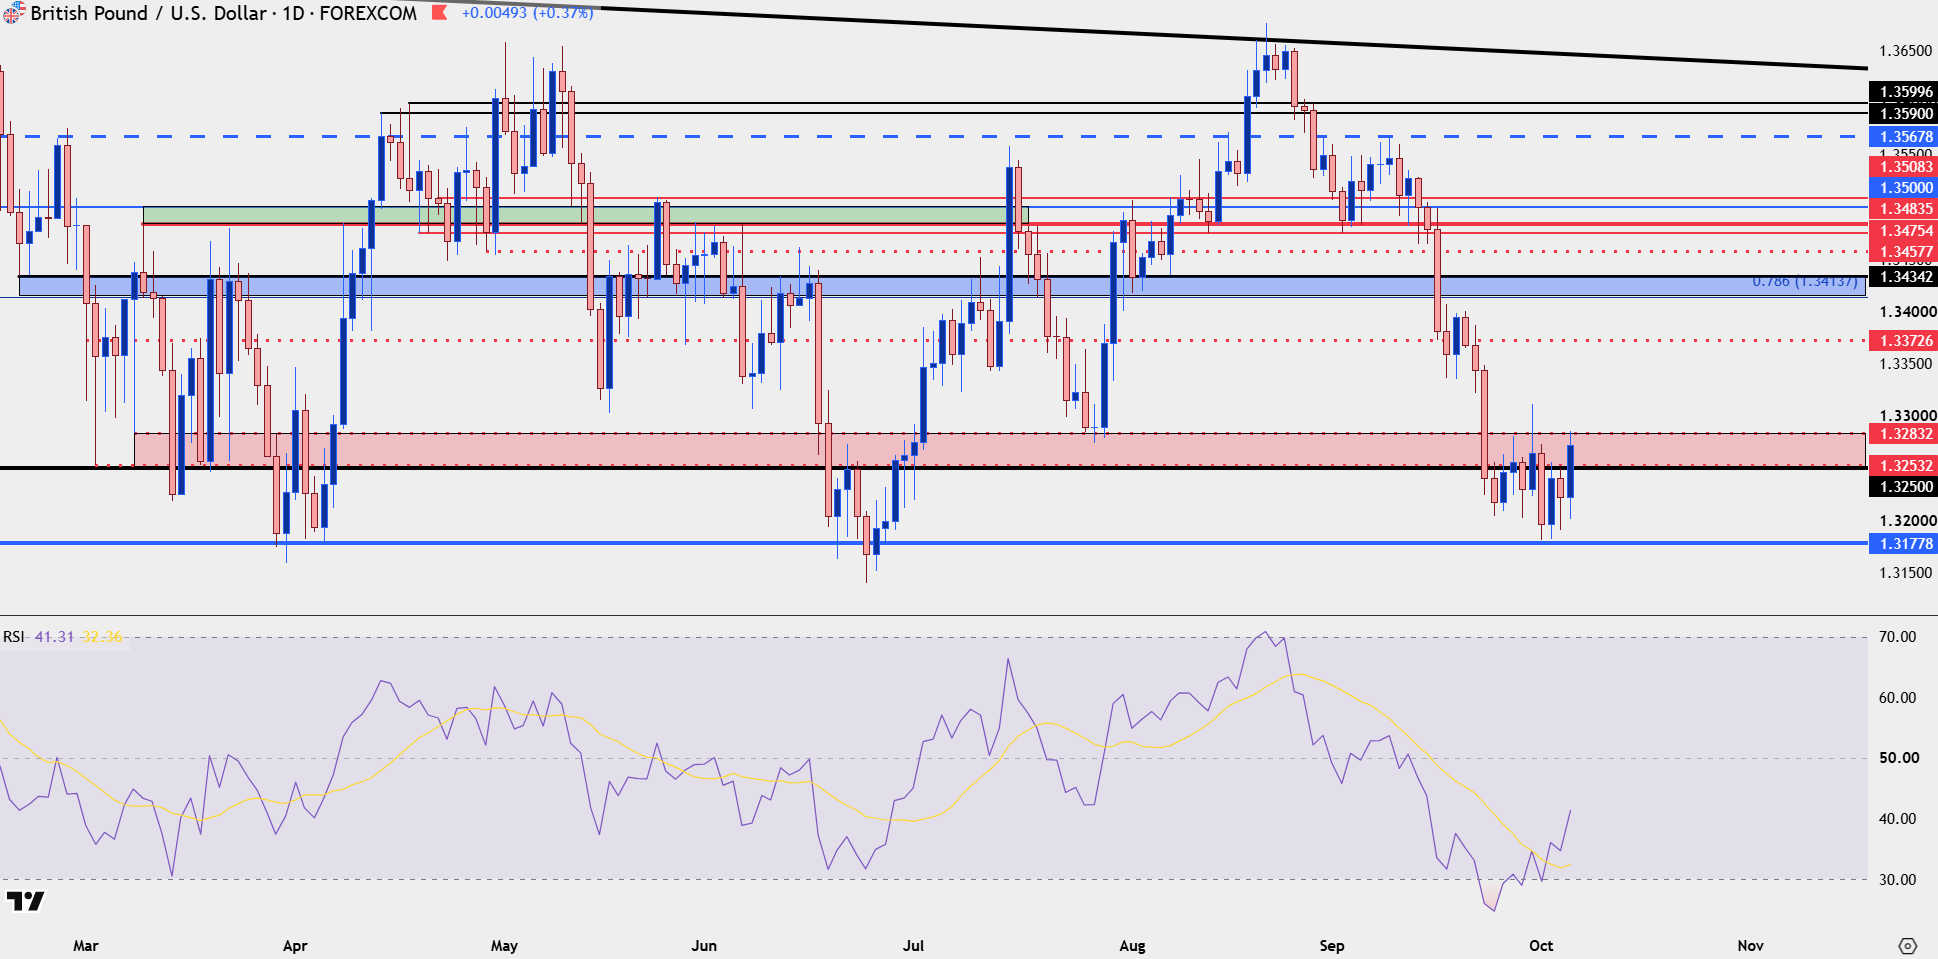
Chart prepared by James Stanley; data derived from Tradingview
USD/JPY
While USD/JPY remains a massive component of USD-strength, more recently, it’s been lagging behind as the DXY rally has been driven by the meltdown in the Euro.
But – for USD-strength, I still think USD/JPY is the more attractive backdrop from shorter-terms, as the still bullish structure has continued to find buyers on pullbacks such as the six consecutive days of support tests at the key zone of 156.68-157.22.
I wrote about the pair yesterday and my view is largely the same as price has only moved incrementally higher since.
USD/JPY Daily Chart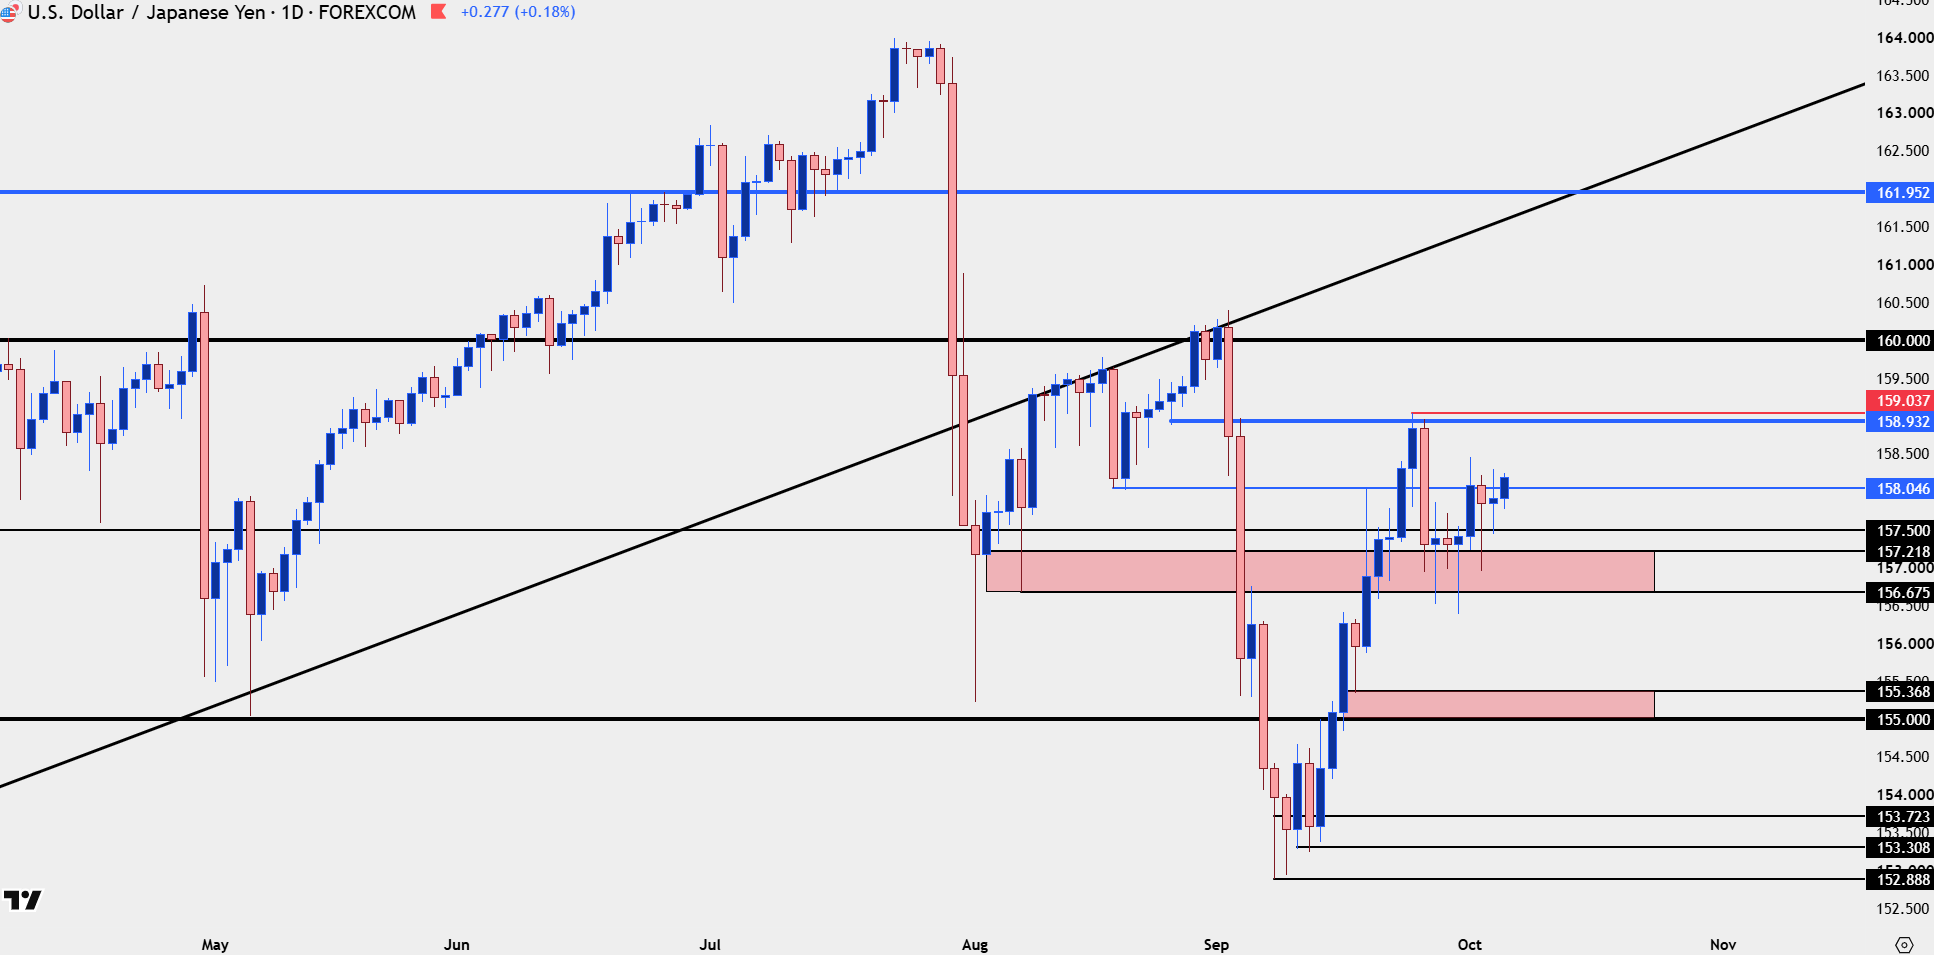
Chart prepared by James Stanley; data derived from Tradingview
USD/CAD
For much of the USD rally the complication with USD/JPY was that intervention threat, which was especially high when the pair was at fresh highs. USD/CAD, however, has been in the midst of an aggressive uptrend and this is why it was one of my more preferred venues for USD-strength.
The challenge now is the tide may soon be shifting as the overbought trend has started to show turbulence.
USD/CAD Daily Chart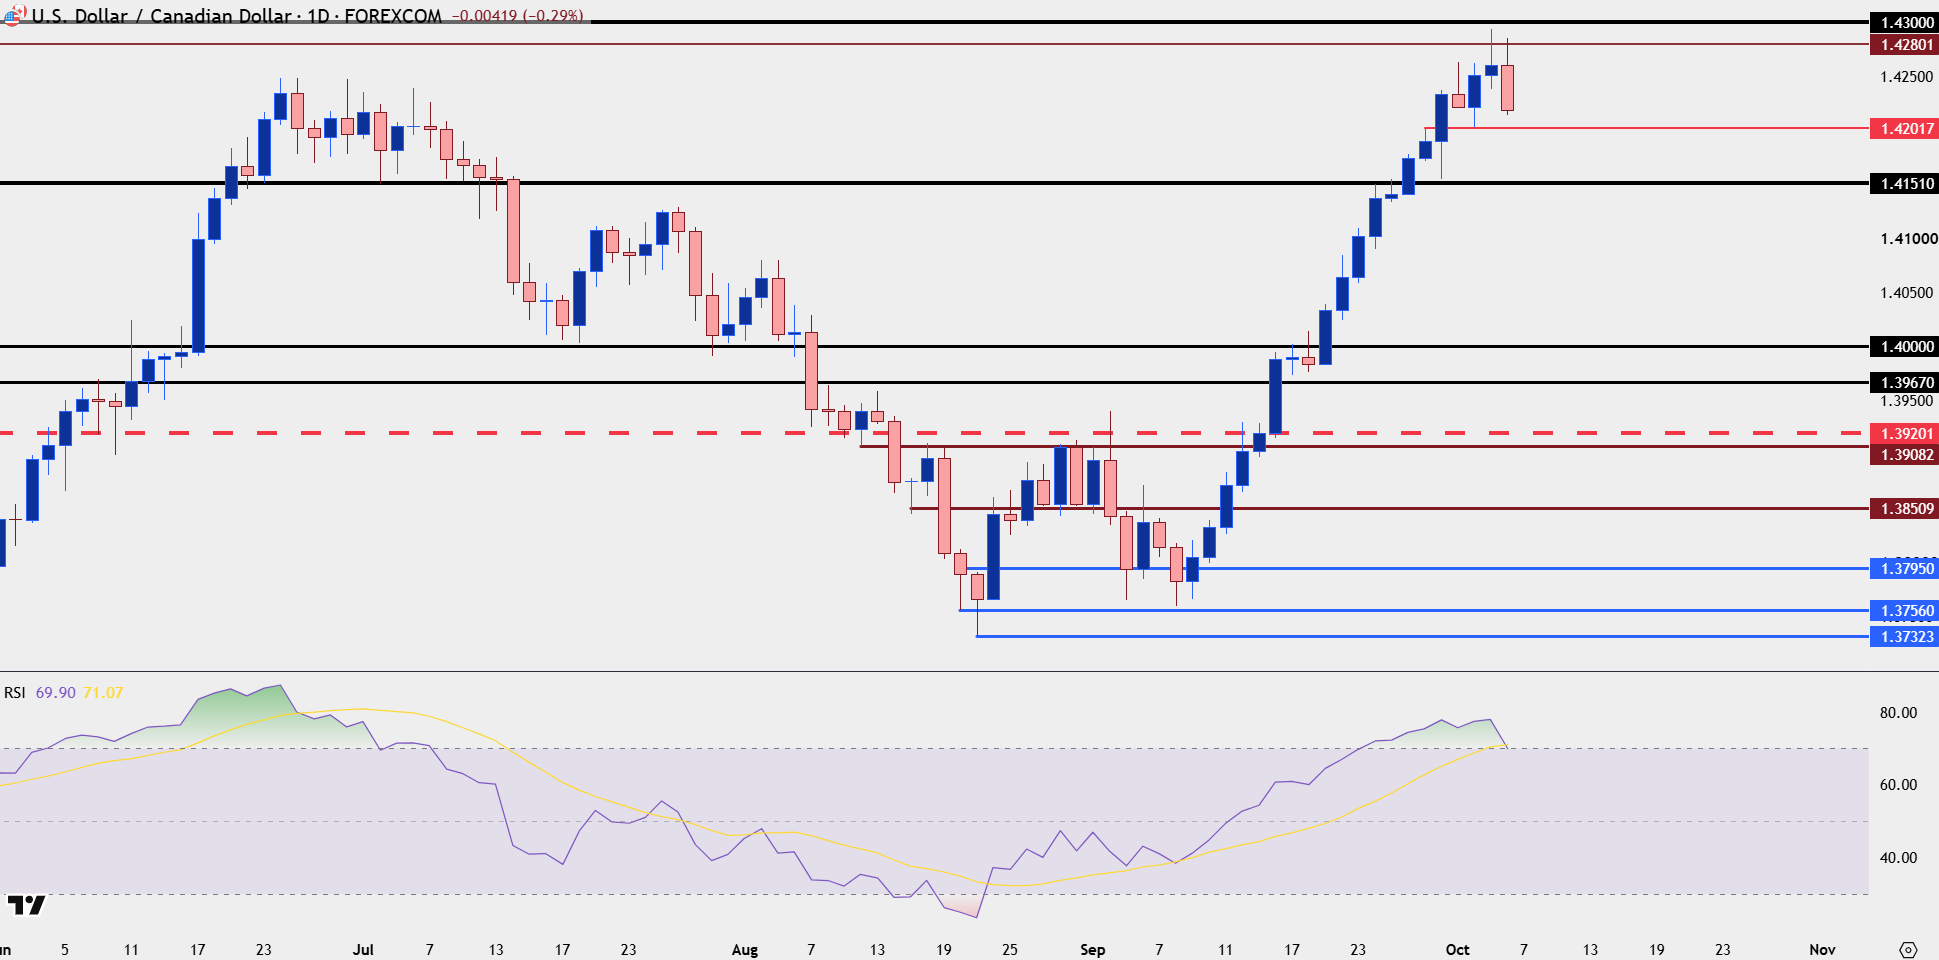
Chart prepared by James Stanley; data derived from Tradingview
Gold
The webinar began with gold and that remains a hot button for me. At this point there’s possibility of a low but it’s still very early stage, and I used this as a central point for that concept of capitulation.
Big picture, as discussed in the macro portion towards the end, I think government reliance on debt keeps gold as an attractive accumulation venue, bigger picture, and on a more near-term basis that draws attention to the $4k level that saw considerable buying interest in June and July, even as the fundamental backdrop should have darkened for the metal.
Gold Daily Price Chart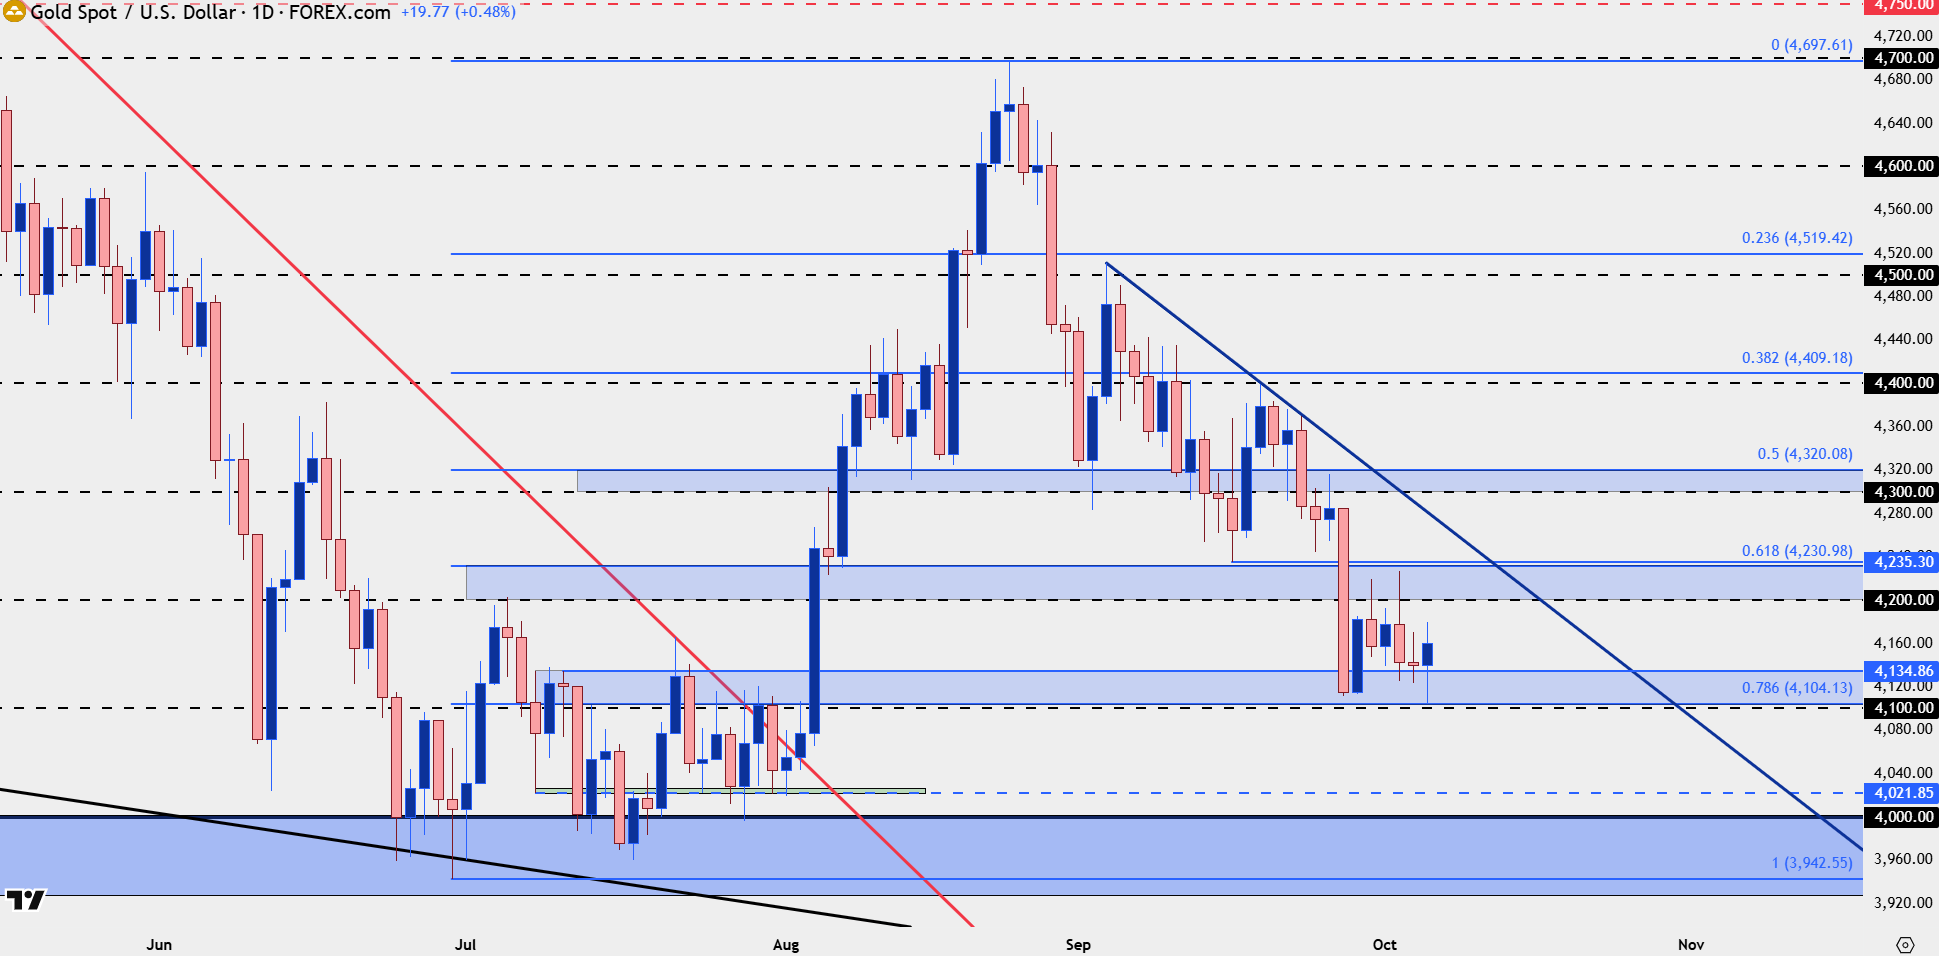
Chart prepared by James Stanley; data derived from Tradingview
--- written by James Stanley, Senior Market Analyst, Global Macro
Latest market news




Open an account in minutes
Experience award-winning platforms with fast and secure execution, and enjoy tight spreads from 0.5 pts on FX and 0.3 pts on indices.
Economic calendar
Web Trader platform
Our sophisticated web-based platform is packed with features.
Related articles
USD/CAD Knocked from Its Perch as US Dollar Rally Pauses for Breath
USD/CAD retreats from stretched highs as the US dollar rally cools, with softer yields, Canadian trade strength and crude oil in focus.

US Dollar Price Action Setups: EUR/USD, GBP/USD, USD/JPY, USD/CAD, Gold
The US Dollar hit a fresh yearly high and is currently testing above a major level, but EUR/USD has already pushed into extreme territory and that begs the question around continuation potential in each market. Meanwhile, USD/JPY retains bullish short-term structure.
USD/CAD Forecast: Is the Canadian Dollar Back in the Game?
The trading week continues to unfold, and the Canadian dollar has begun to show signs of renewed strength in the short term. This can be seen in recent USD/CAD price action, with the pair posting a decline of roughly 0.2% over the last two sessions, allowing the Canadian currency to recover part of the ground lost in previous weeks.

This report is intended for general circulation only. It should not be construed as a recommendation, or an offer (or solicitation of an offer) to buy or sell any financial products. The information provided does not take into account your specific investment objectives, financial situation or particular needs. Before you act on any recommendation that may be contained in this report, independent advice ought to be sought from a financial adviser regarding the suitability of the investment product, taking into account your specific investment objectives, financial situation or particular needs.
StoneX Financial Pte. Ltd., may distribute reports produced by its respective foreign entities or affiliates within the StoneX group of companies or third parties pursuant to an arrangement under Regulation 32C of the Financial Advisers Regulations. Where the report is distributed to a person in Singapore who is not an accredited investor, expert investor or an institutional investor (as defined in the Securities Futures Act), StoneX Financial Pte. Ltd. accepts legal responsibility to such persons for the contents of the report only to the extent required by law. Singapore recipients should contact StoneX Financial Pte. Ltd. at 6826 9988 for matters arising from, or in connection with the report.
In the case of all other recipients of this report, to the extent permitted by applicable laws and regulations neither StoneX Financial Pte. Ltd. nor its associated companies will be responsible or liable for any loss or damage incurred arising out of, or in connection with, any use of the information contained in this report and all such liability is hereby expressly disclaimed. No representation or warranty is made, express or implied, that the content of this report is complete or accurate.
StoneX Financial Pte. Ltd. is not under any obligation to update this report.
Trading CFDs carries a high level of risk that may not be suitable for some investors. Consider your investment objectives, level of experience, financial resources, risk appetite and other relevant circumstances carefully. The possibility exists that you could lose some or all of your investments, including your initial deposits. If in doubt, please seek independent expert advice. Visit www.forex.com/en-sg/terms-and-policies for the complete Risk Disclosure Statement.