



US Dollar Price Action Setups: EUR/USD, GBP/USD, USD/JPY, USD/CAD
The US Dollar finished last week with a bearish engulf following a four-week winning streak. But the big question now is whether the Euro can pose any form of a recovery.
Share this:

US Dollar Talking Points:
- The US Dollar finished last week with a bearish engulfing candlestick. So far this week, the weakness has continued with sellers pushing below the 101.80 Fibonacci level.
- EUR/USD remains a big part of this and while the pair didn’t quite put in a bullish engulf last week, there is prospect of capitulation given the way the daily chart has set up.
- GBP/USD remains more attractive for bearish USD themes, while USD/JPY is more attractive for bullish scenarios. USD/CAD may soon be in that bullish USD camp, as well.
The topic for this week’s webinar is topography matters, speaking to the value of longer-term charts for directional impulse, even for traders executing shorter-term strategies.
In the USD, it’s been a strong trend for the prior four weeks, driven by a FOMC rate hike and a more-hawkish Fed. But a big part of that has been continued sell-off in the Euro despite deep oversold conditions, and that remains a big piece of the puzzle for both USD/DXY and EUR/USD in the days and weeks ahead.
US Dollar Weekly Chart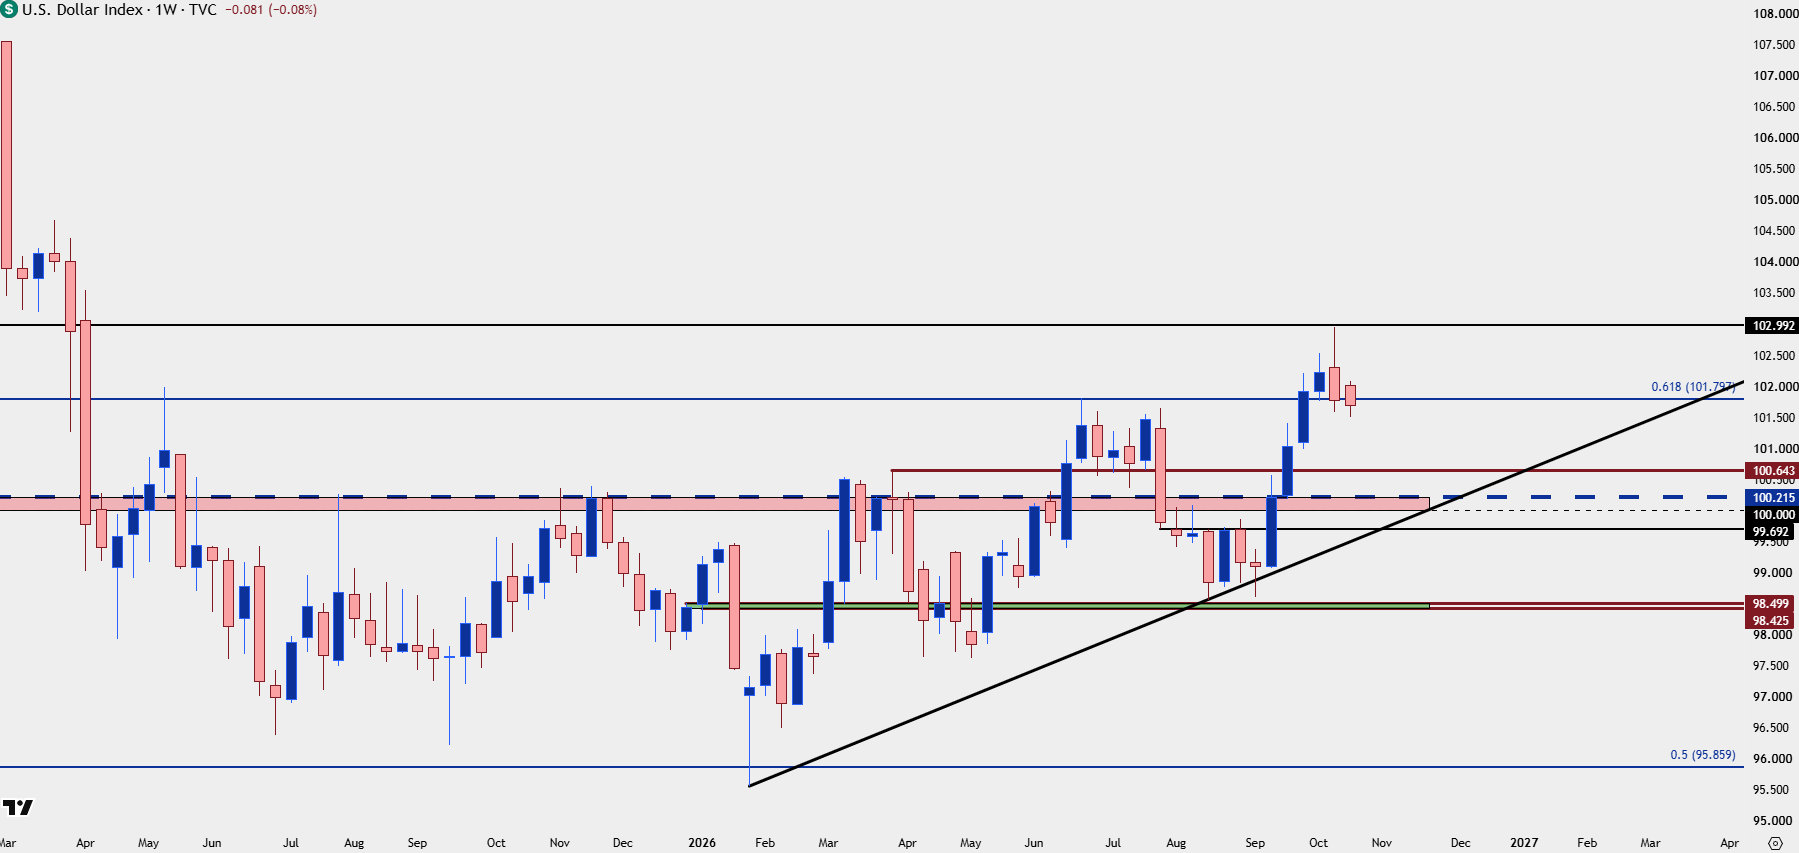
Chart prepared by James Stanley; data derived from Tradingview
EUR/USD
In last week’s webinar, the topic was ‘capitulation’ along with ‘two ways to trade a turn.’ A day after that session we may have seen that in EUR/USD, helped along by a strong US CPI print.
Sellers initially pushed for a fresh yearly low, but they didn’t get very far, and a rally by the end of the day exposed a wide underside wick. The next day, a strong PPI report out of the US was unable to continue that sell-off and, instead, bulls pushed up for a fresh higher-high, which continued through Friday trade.
A pullback showed up to open this week but, so far, buyers have held up support at prior resistance, around the 1.1212 Fibonacci level, and that keeps the door open for bulls to push for a greater recovery and that speaks to the short side of the Dollar looked at above. For next levels, it’s the 1.1265-1.1285 zone sitting overhead that buyers need to push through to exhibit greater control of the matter.
EUR/USD Daily Chart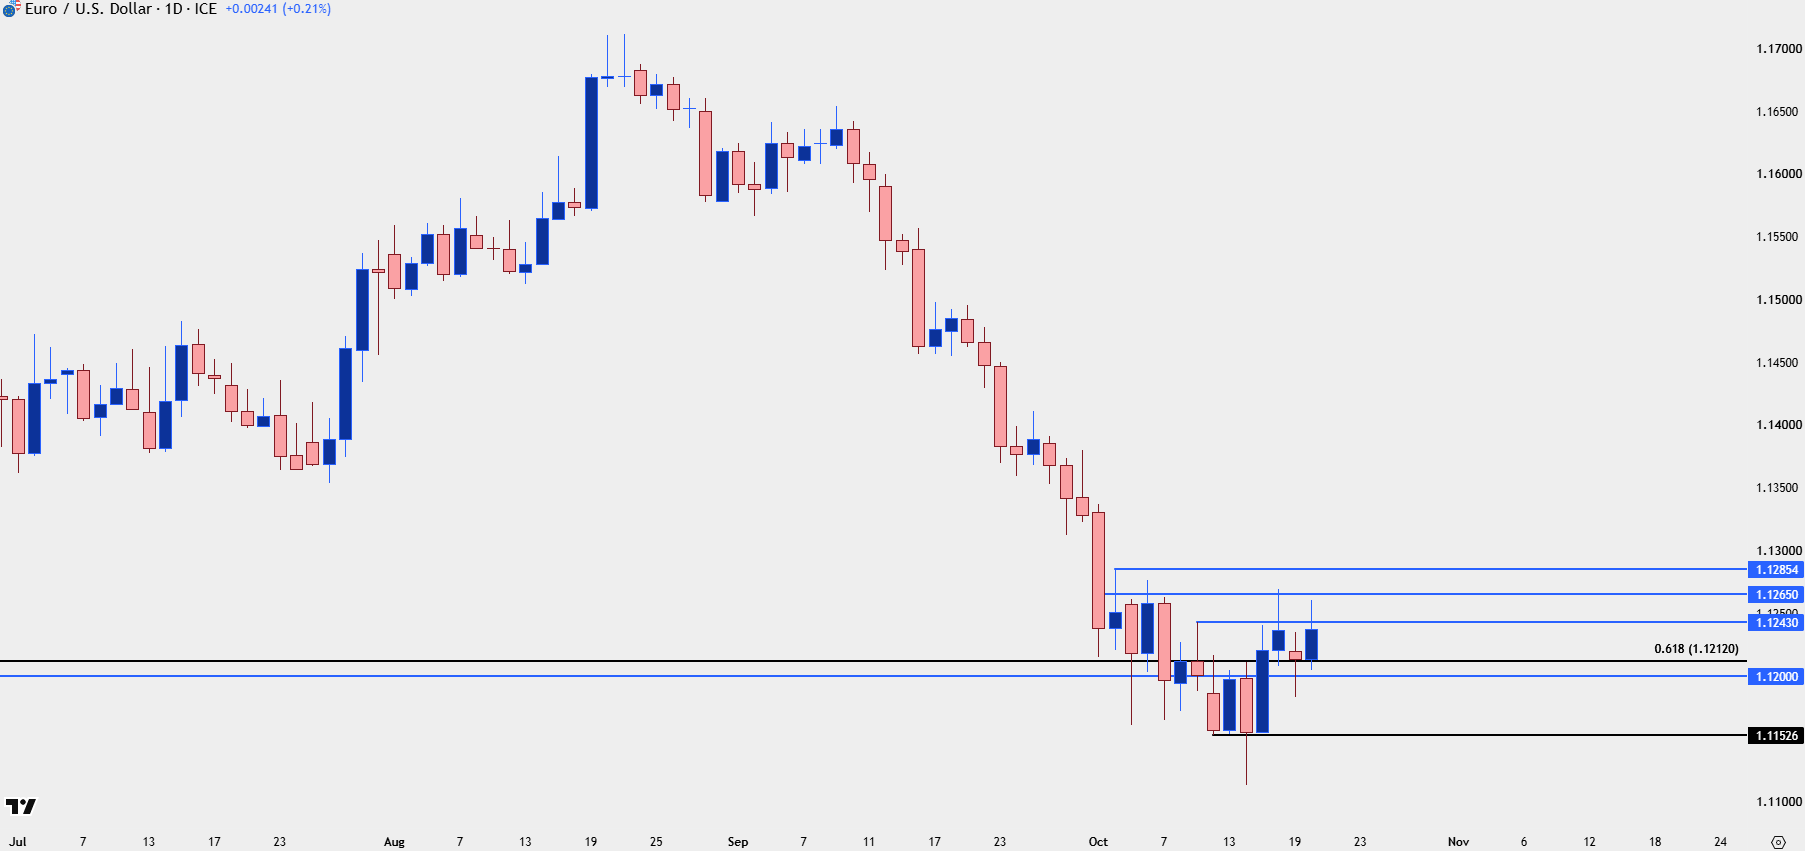
Chart prepared by James Stanley; data derived from Tradingview
GBP/USD
For USD-weakness I still prefer GBP/USD. The pair put in a strong reversal from a big support level last week and in the webinar, I compared the weekly bar here against EUR/USD to illustrate why Cable is still deserving of that attention.
At this point, resistance is showing at the 23.6% retracement of the same Fibonacci setup from which last week’s support bounced from the 38.2% marker, and in the webinar, I highlighted two support zones to work with for pullback scenarios in the pair.
GBP/USD Daily Price Chart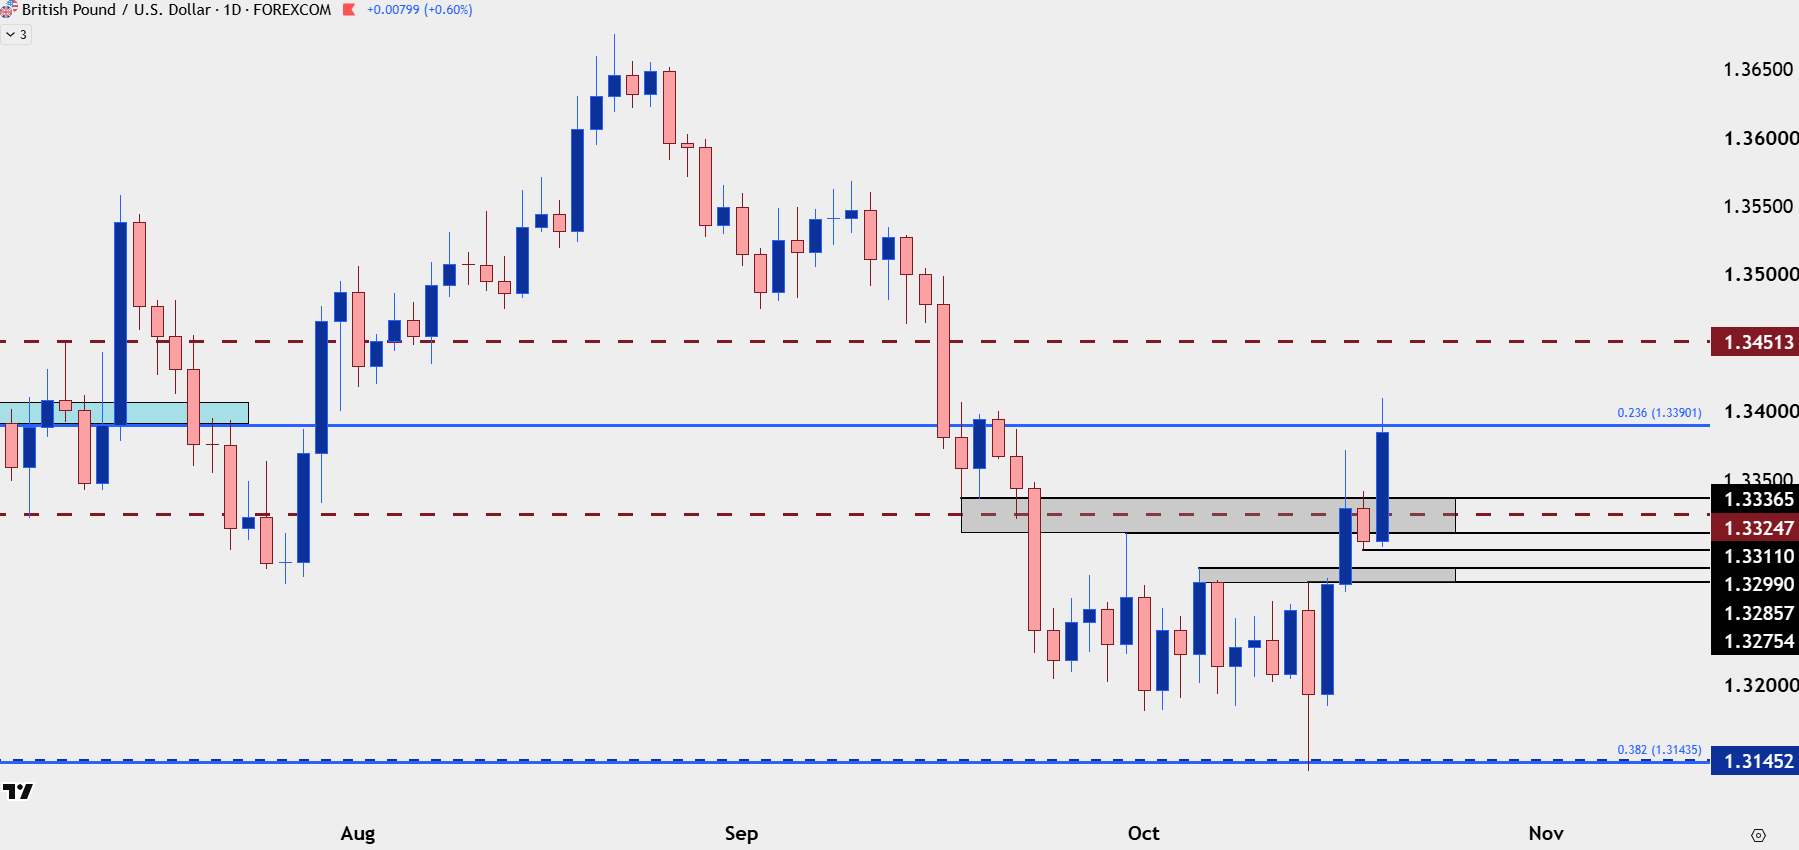
Chart prepared by James Stanley; data derived from Tradingview
USD/JPY
For USD-strength, I still prefer USD/JPY, with the caveat that I think there’s theoretically capped upside as a push above 160 will probably elicit intervention comments and that may even be true for a poke above 159.00. I talked about this in greater depth yesterday, asking whether the 160.00 level is vulnerable.
USD/JPY Daily Chart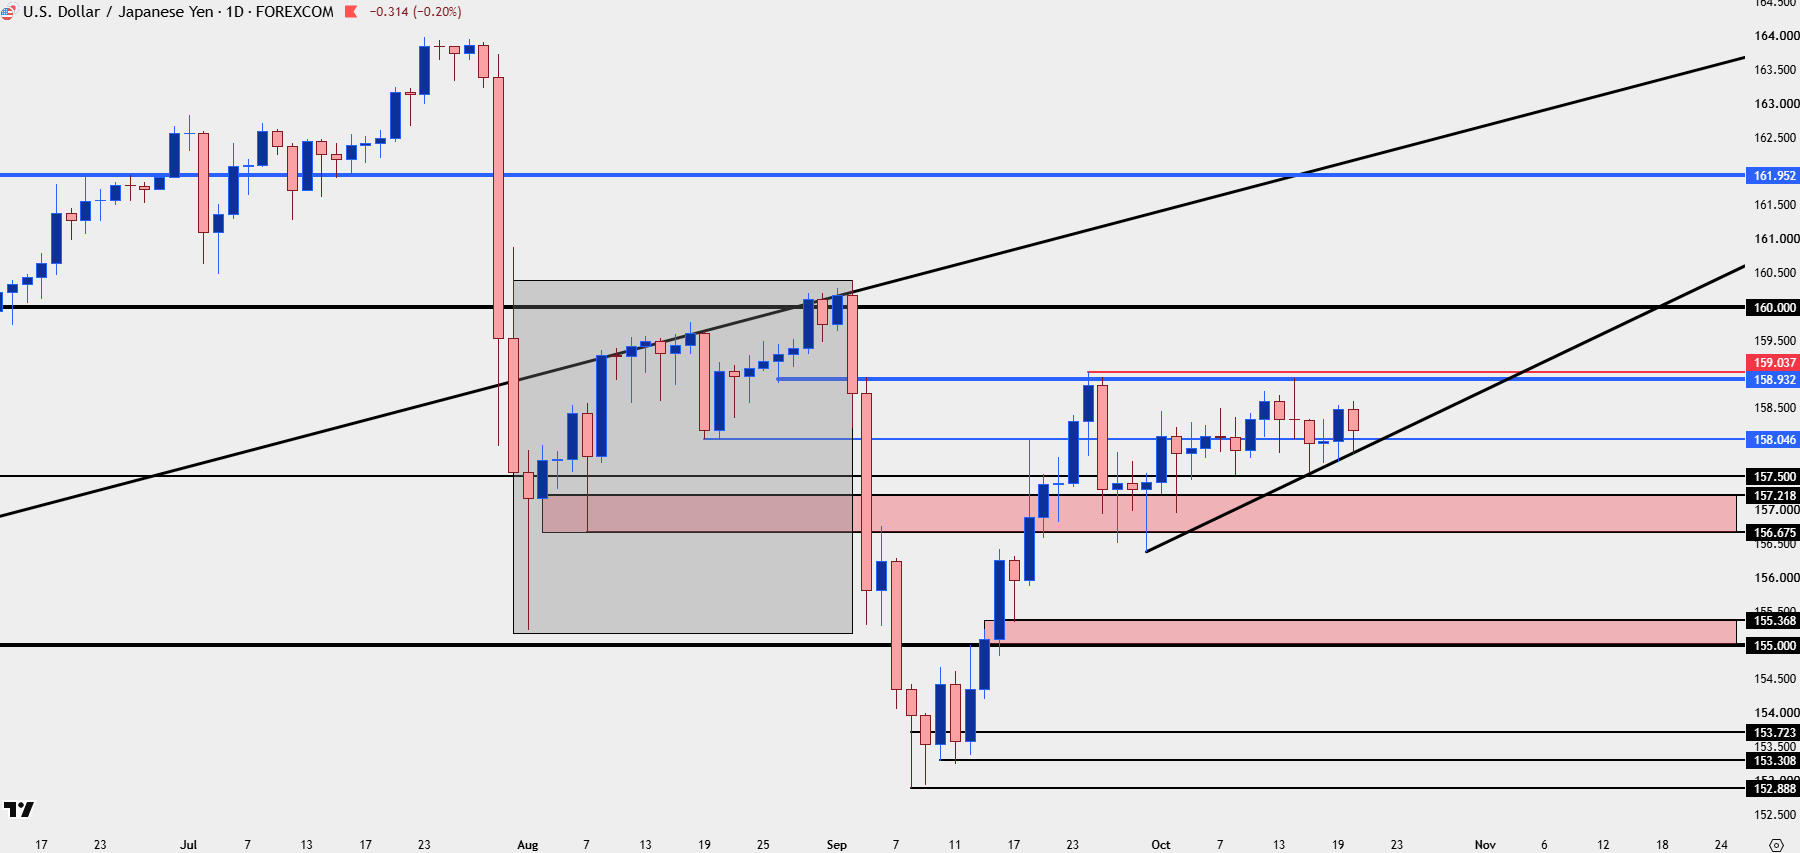
Chart prepared by James Stanley; data derived from Tradingview
USD/CAD
It’s gone from feast to famine for bulls in USD/CAD, as a consistent uptrend has pared back considerably over the past week, following a failure at 1.4300 after the US CPI release.
It’s the 1.4000 level that stands out here, and there’s already been a response from just above that price at 1.4030 which is the 50% mark of the September-October rally. This could be an area of interest for a bounce play, particularly for bullish-USD scenarios.
USD/CAD Daily Chart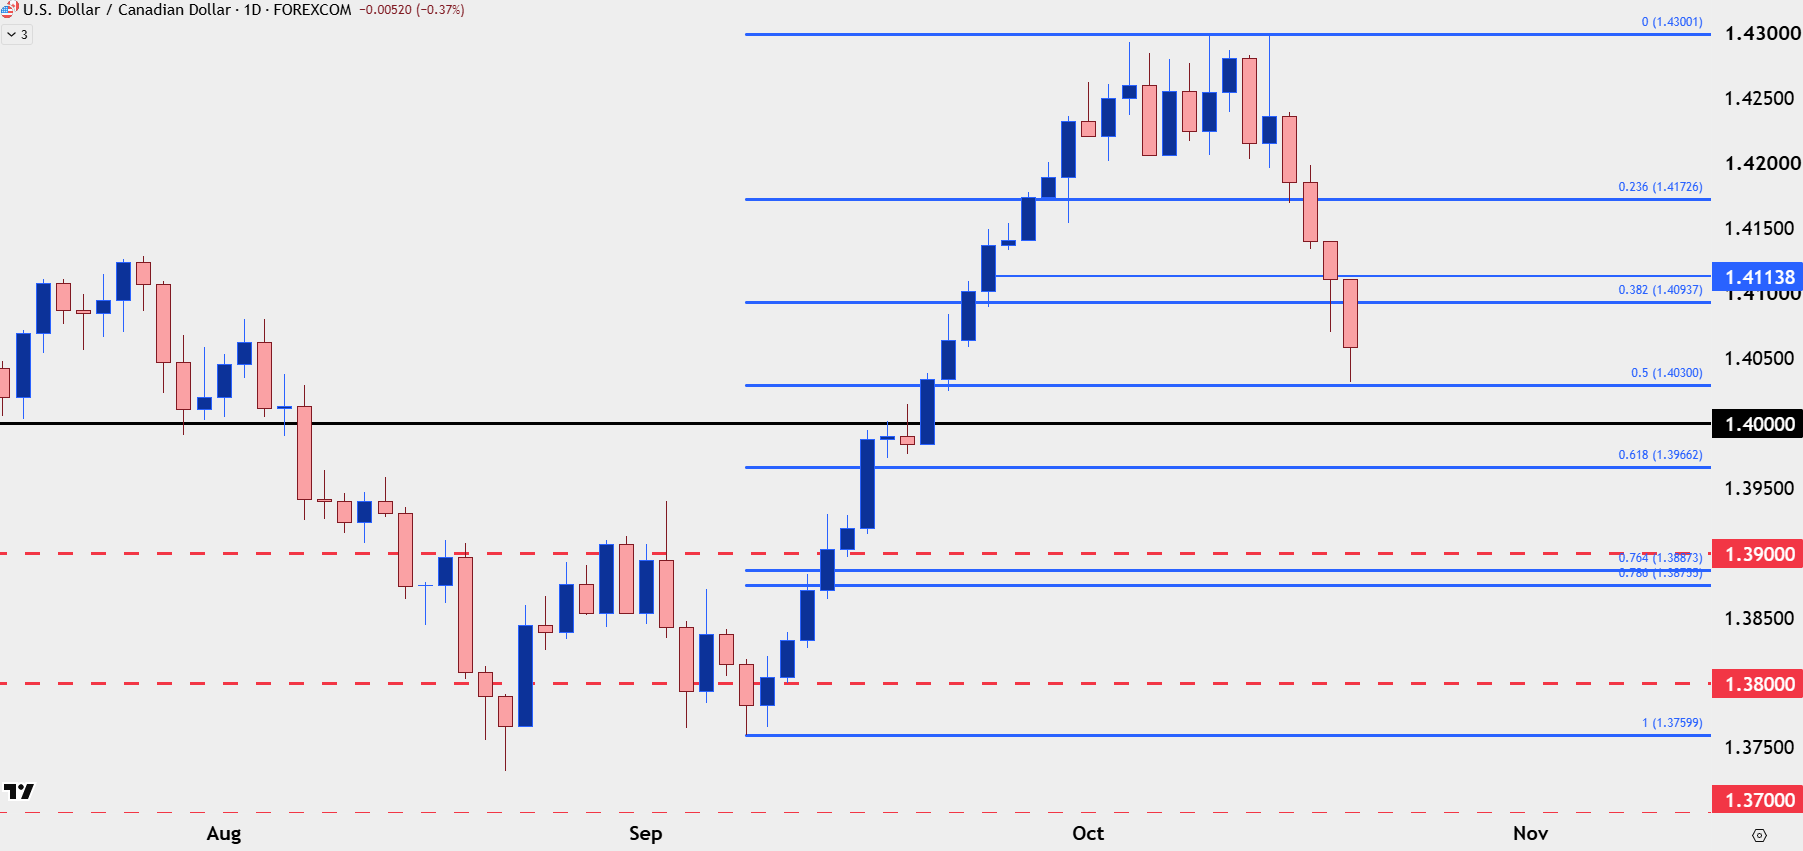
Chart prepared by James Stanley; data derived from Tradingview
--- written by James Stanley, Senior Market Analyst, Global Macro
Latest market news




Open an account in minutes
Experience award-winning platforms with fast and secure execution, and enjoy tight spreads from 0.5 pts on FX and 0.3 pts on indices.
Economic calendar
Web Trader platform
Our sophisticated web-based platform is packed with features.
Related articles

US Dollar Price Action Setups: EUR/USD, GBP/USD, USD/JPY, USD/CAD
The US Dollar finished last week with a bearish engulf following a four-week winning streak. But the big question now is whether the Euro can pose any form of a recovery.
British Pound Forecast: GBP/USD Outside-Week Reversal Faces Major Test 10 20 2026
Sterling’s sharp rebound faces major resistance, raising the stakes for a critical inflection that could threaten the recent bullish reversal.

Euro Technical Outlook: EUR/USD Bulls Face Critical Test After Support Rebound 10 20 2026
EUR/USD has cleared its September downtrend, but buyers still need to prove the advance can develop into a more sustained bullish reversal.
This report is intended for general circulation only. It should not be construed as a recommendation, or an offer (or solicitation of an offer) to buy or sell any financial products. The information provided does not take into account your specific investment objectives, financial situation or particular needs. Before you act on any recommendation that may be contained in this report, independent advice ought to be sought from a financial adviser regarding the suitability of the investment product, taking into account your specific investment objectives, financial situation or particular needs.
StoneX Financial Pte. Ltd., may distribute reports produced by its respective foreign entities or affiliates within the StoneX group of companies or third parties pursuant to an arrangement under Regulation 32C of the Financial Advisers Regulations. Where the report is distributed to a person in Singapore who is not an accredited investor, expert investor or an institutional investor (as defined in the Securities Futures Act), StoneX Financial Pte. Ltd. accepts legal responsibility to such persons for the contents of the report only to the extent required by law. Singapore recipients should contact StoneX Financial Pte. Ltd. at 6826 9988 for matters arising from, or in connection with the report.
In the case of all other recipients of this report, to the extent permitted by applicable laws and regulations neither StoneX Financial Pte. Ltd. nor its associated companies will be responsible or liable for any loss or damage incurred arising out of, or in connection with, any use of the information contained in this report and all such liability is hereby expressly disclaimed. No representation or warranty is made, express or implied, that the content of this report is complete or accurate.
StoneX Financial Pte. Ltd. is not under any obligation to update this report.
Trading CFDs carries a high level of risk that may not be suitable for some investors. Consider your investment objectives, level of experience, financial resources, risk appetite and other relevant circumstances carefully. The possibility exists that you could lose some or all of your investments, including your initial deposits. If in doubt, please seek independent expert advice. Visit www.forex.com/en-sg/terms-and-policies for the complete Risk Disclosure Statement.