



US Dollar Price Action Setups: EUR/USD, USD/JPY, GBP/USD
There’s been chaotic movements in several macro markets and a number of correlations have aligned, although that can change quickly. The US Dollar, however, presents a case on both sides depending on the time frame examined, explored further in this week’s price action webinar.
Share this:

US Dollar
The daily and weekly charts of the US Dollar retain bullish potential and given the continued tension in the Middle East I think it’s clear what drives that scenario. The knock-on effect of that is USD/JPY, and whether the BoJ will be ordered to intervene in effort of knocking the pair back-below the 160.00 handle. Earlier in the week there were more intervention threats out of Japan and that did bring a pullback, but since then, bulls have pushed price right back up to resistance.
In the USD, there’s an ascending triangle formation very similar to the one that had built in February leading into the March breakout. The resistance line-in-the-sand is around the 100-handle, which has been bend without break kind of scenario of late.
US Dollar Daily Chart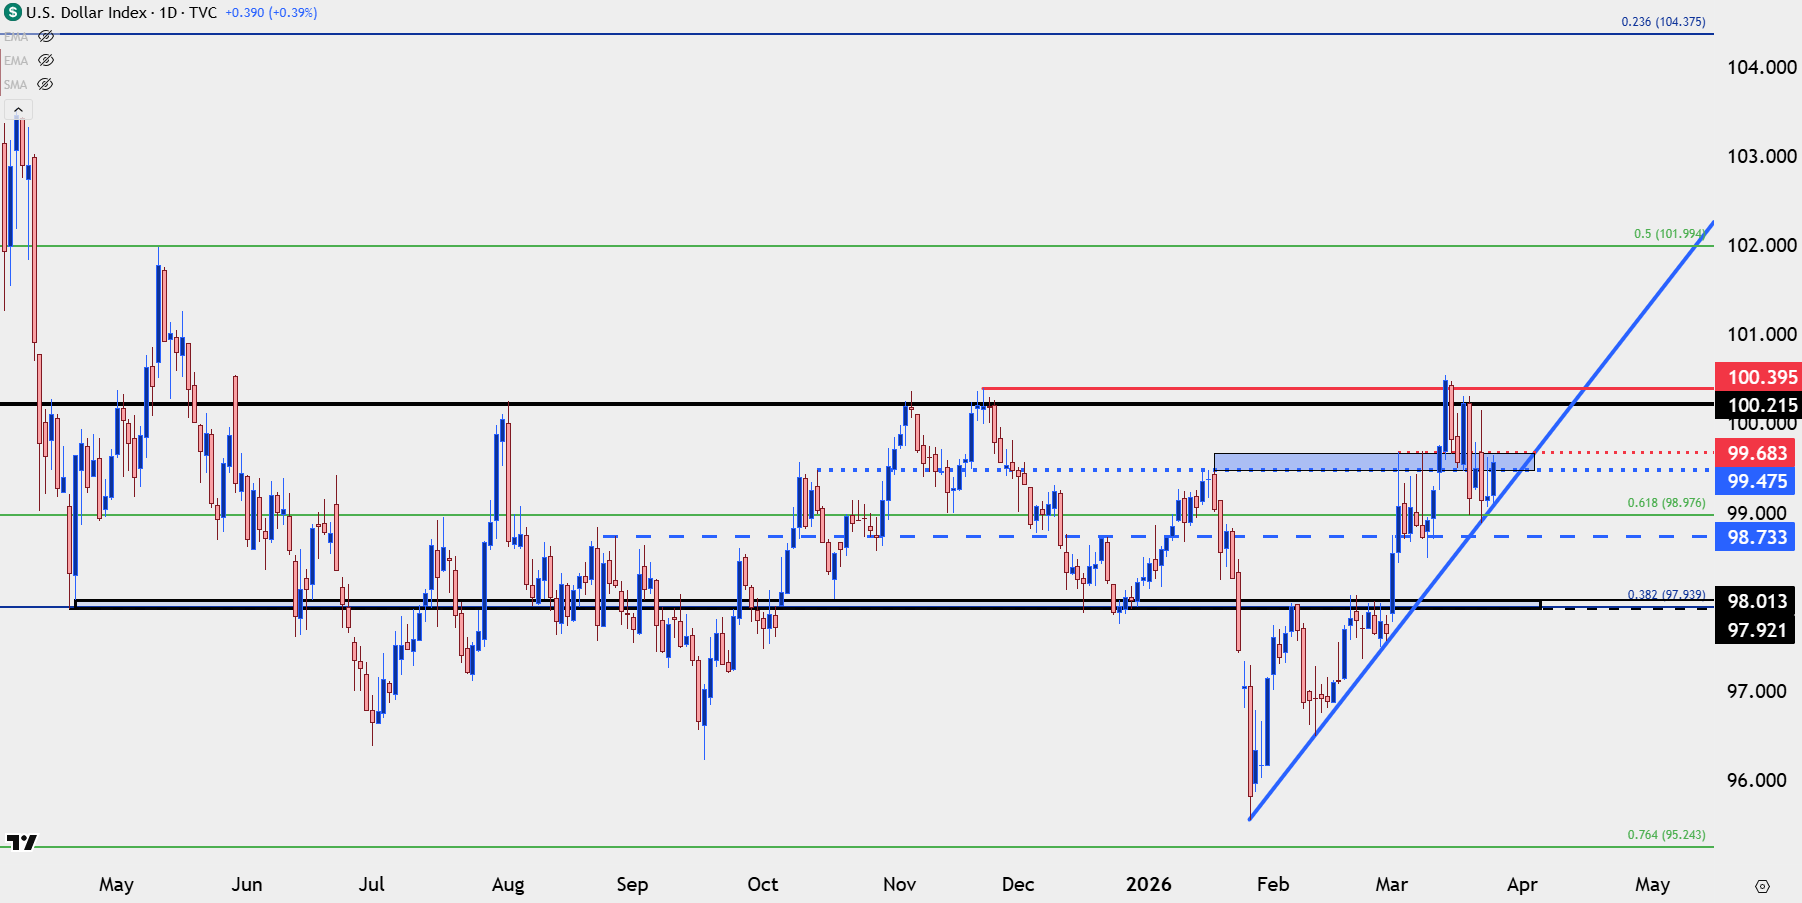
Chart prepared by James Stanley; data derived from Tradingview
USD Shorter-Term
For USD bears, it’s the shorter-term build of lower-lows and highs that they’d likely want to focus on. For now, there’s support bouncing from the bullish trendline that held the lows in late-February in DXY, and resistance is playing at a familiar zone between 99.48-99.68, which was resistance after the initial breakout in early-March before coming in as support a couple weeks later.
US Dollar Four-Hour Chart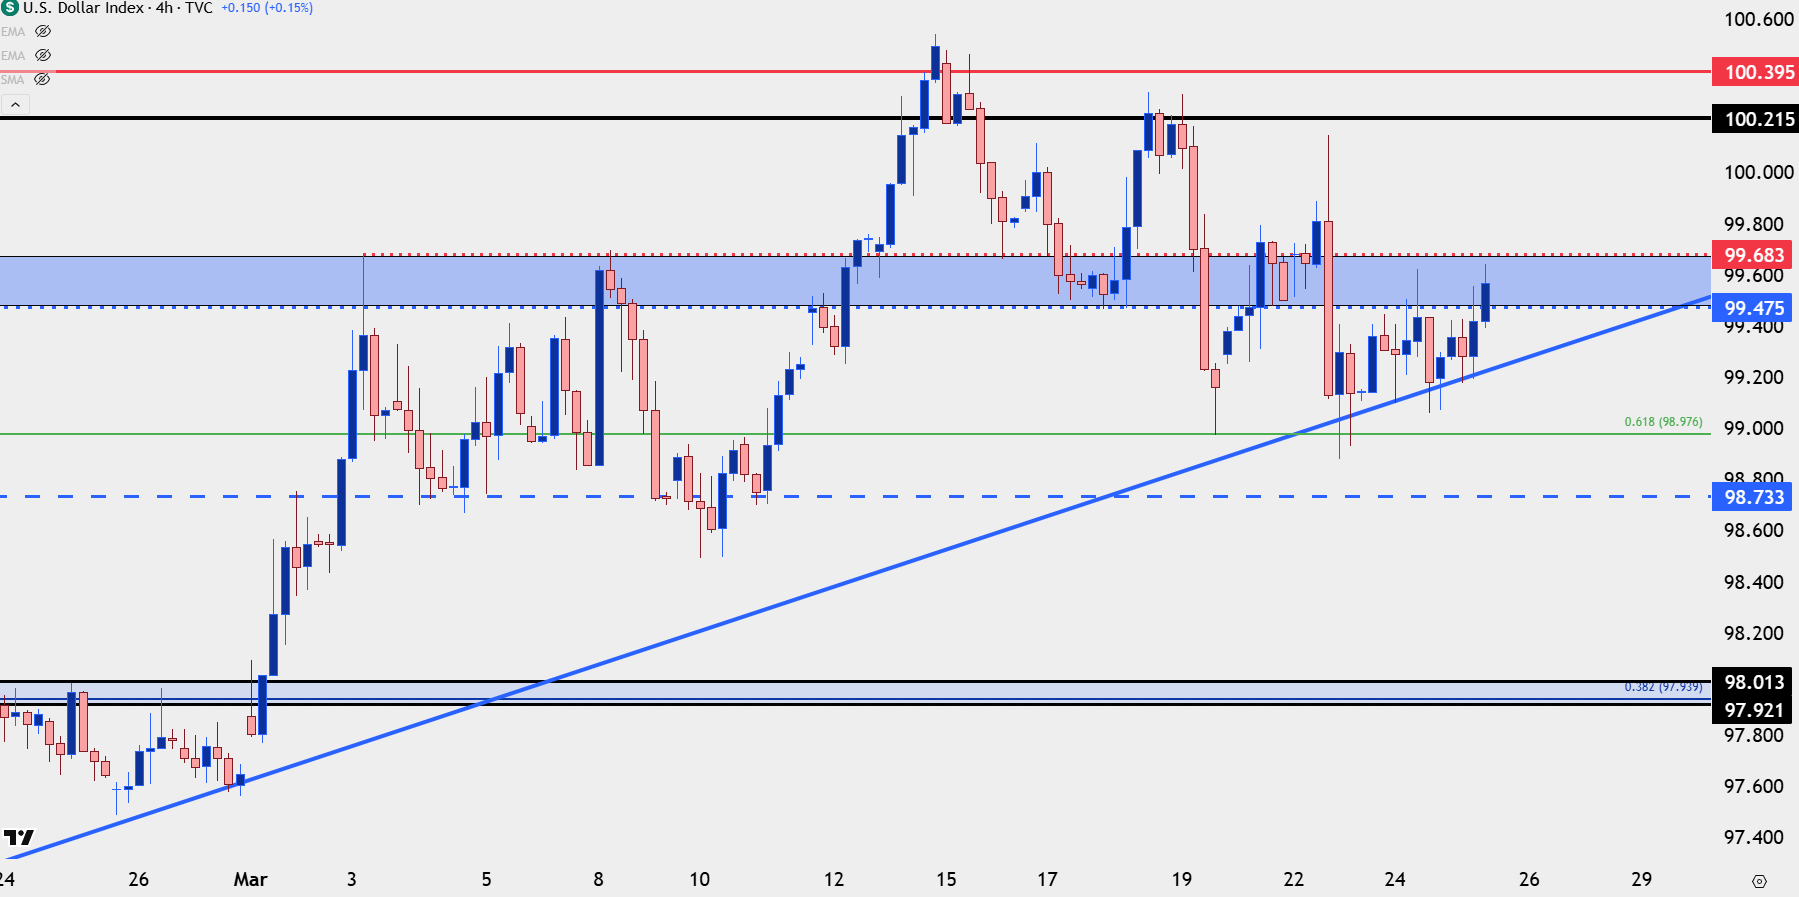
Chart prepared by James Stanley; data derived from Tradingview
EUR/USD
The largest component of the DXY basket is in a similar contradictory state between daily and four-hour charts. For EUR/USD bulls, it’s the fundamental divergence that I think stands out as this fall in the pair accompanied a fast rise in European rate expectations into Central Bank week. There’s been a build of support on a short-term basis, mirroring the lower-lows and lower-highs of DXY above, and this is what EUR/USD bulls are likely going to want to focus on, for now.
But, from the daily I think it’s simple to consider this as a bearish scenario given that there’s a continued tug of war around what can be considered a lower-high.
EUR/USD Daily Price Chart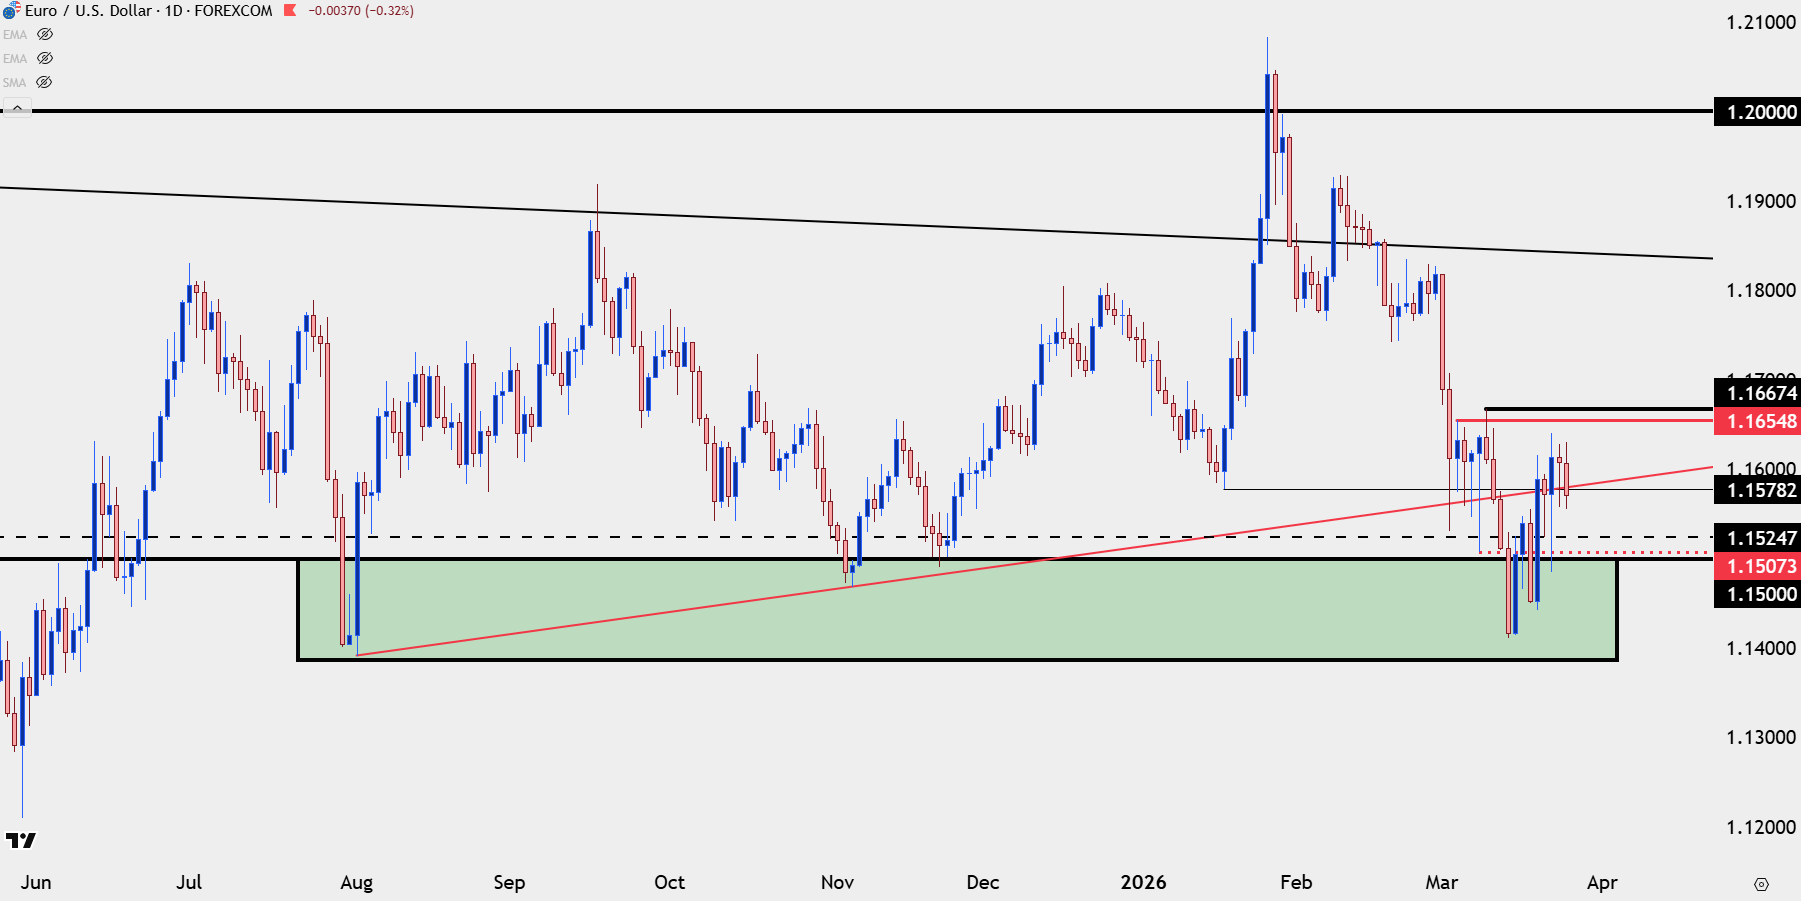
Chart prepared by James Stanley; data derived from Tradingview
EUR/USD Shorter-Term
The four-hour chart shows a grinding backdrop of recent higher-highs and lows and notably that sequencing has continued since the ECB rate decision last week. But, bulls remain cautious as pushes up to higher-highs haven’t exactly led to strong breakout themes so it seems as though this situation is still awaiting a catalyst or driver.
EUR/USD Four-Hour Chart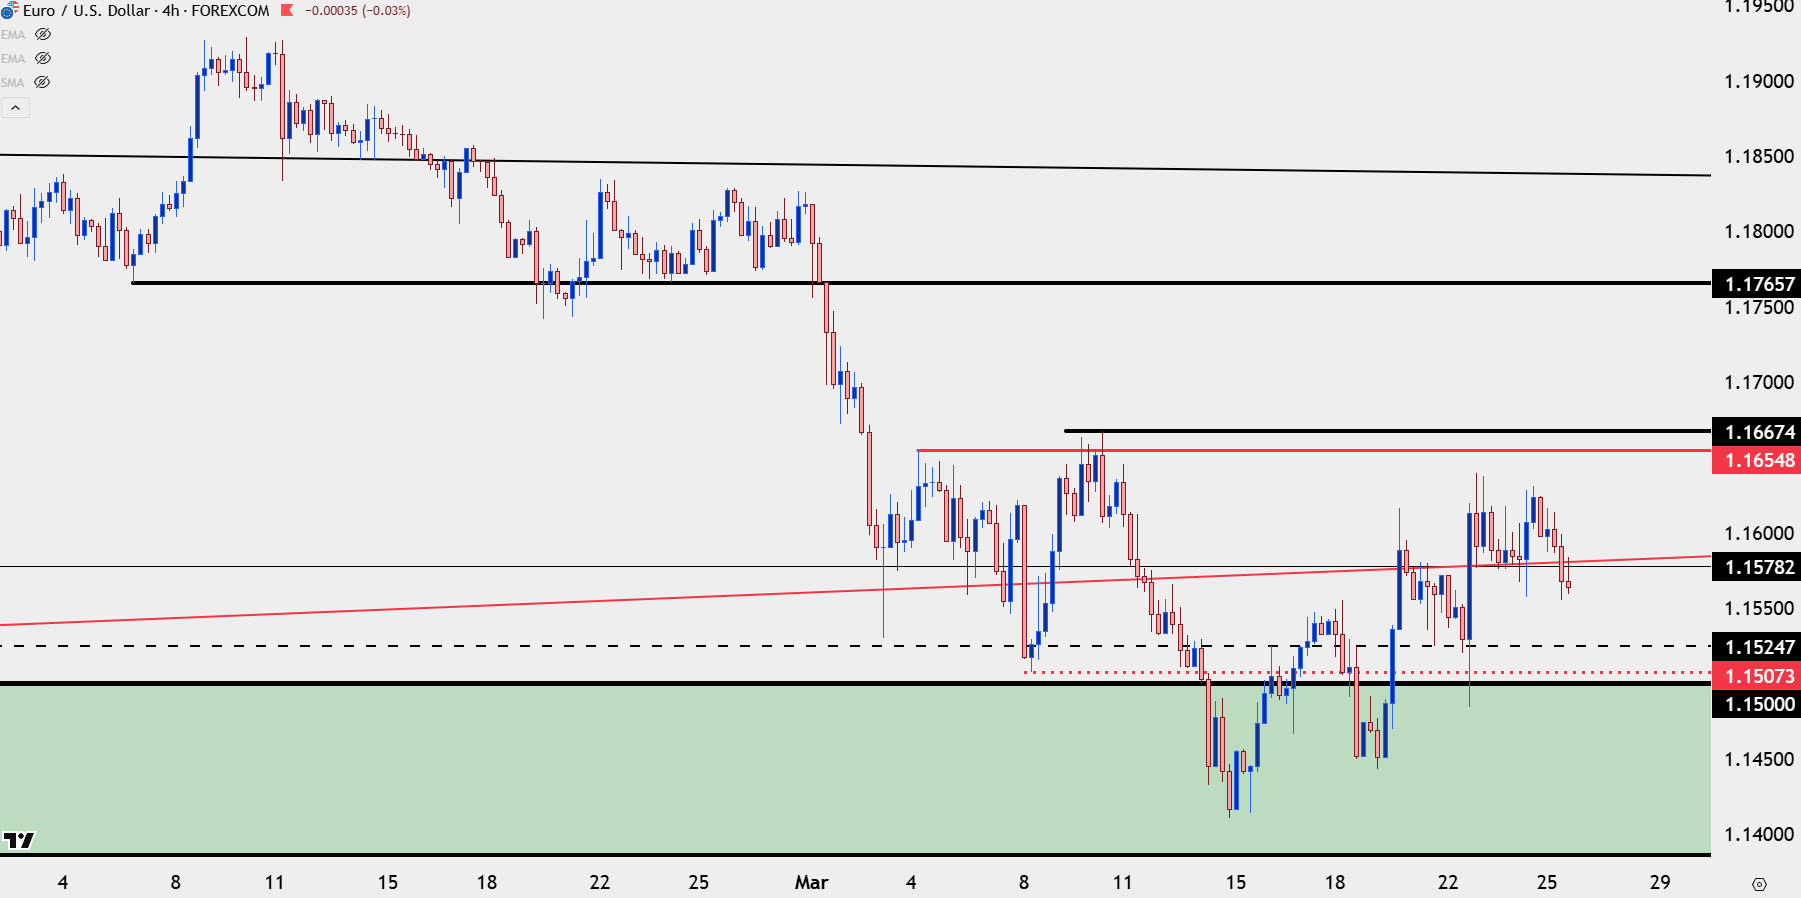
Chart prepared by James Stanley; data derived from Tradingview

GBP/USD
For USD-weakness, I still prefer GBP/USD, and the recent pullback from the bearish trend illustrates a few items that I think keeps that theme of interest. While EUR/USD hasn’t yet re-tested the March 10th high, substantiating a lower-high on the daily chart, GBP/USD has come closer to that, which highlights a deduction of greater strength in Sterling versus the Euro.
The daily chart here, while not quite in a bullish reversal state, has a series of recent higher-lows to go along with that test back above the 1.3400 handle.
GBP/USD Daily Chart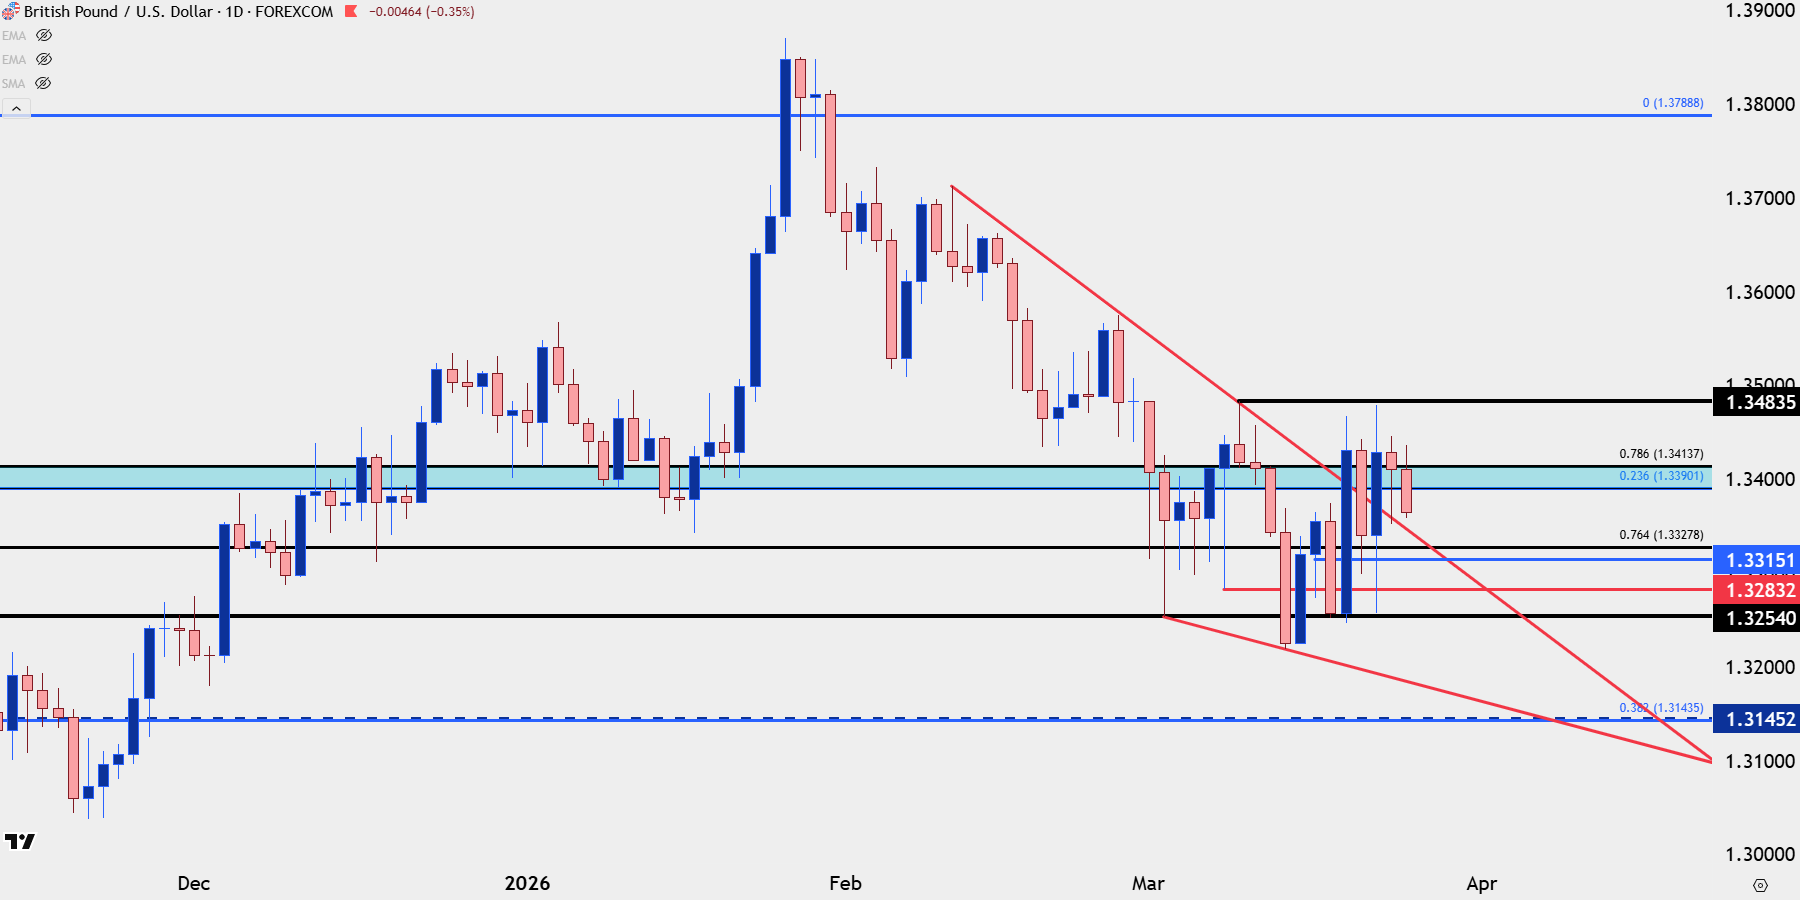
Chart prepared by James Stanley; data derived from Tradingview
USD/JPY
USD/JPY is making another push back up towards the 160.00 level and earlier this week we heard comments from Japan’s top currency diplomat that threatened intervention. That brought a pullback on Monday but not much else, and prices are now back to the same level they were at after the weekly open around when those comments hit the wire.
If we do see a 160.00 test I think we could see an intervention. The bigger question is whether it would work or, like in April of 2024, if that was merely a pullback that drew bulls in after a support test.
But, perhaps more importantly, a pullback in the crowded USD/JPY backdrop could bring with it a broader swell of USD-weakness, such as we saw in late-January which helped EUR/USD to pop above the 1.2000 handle while going into overbought territory on daily RSI.
USD/JPY Daily Price Chart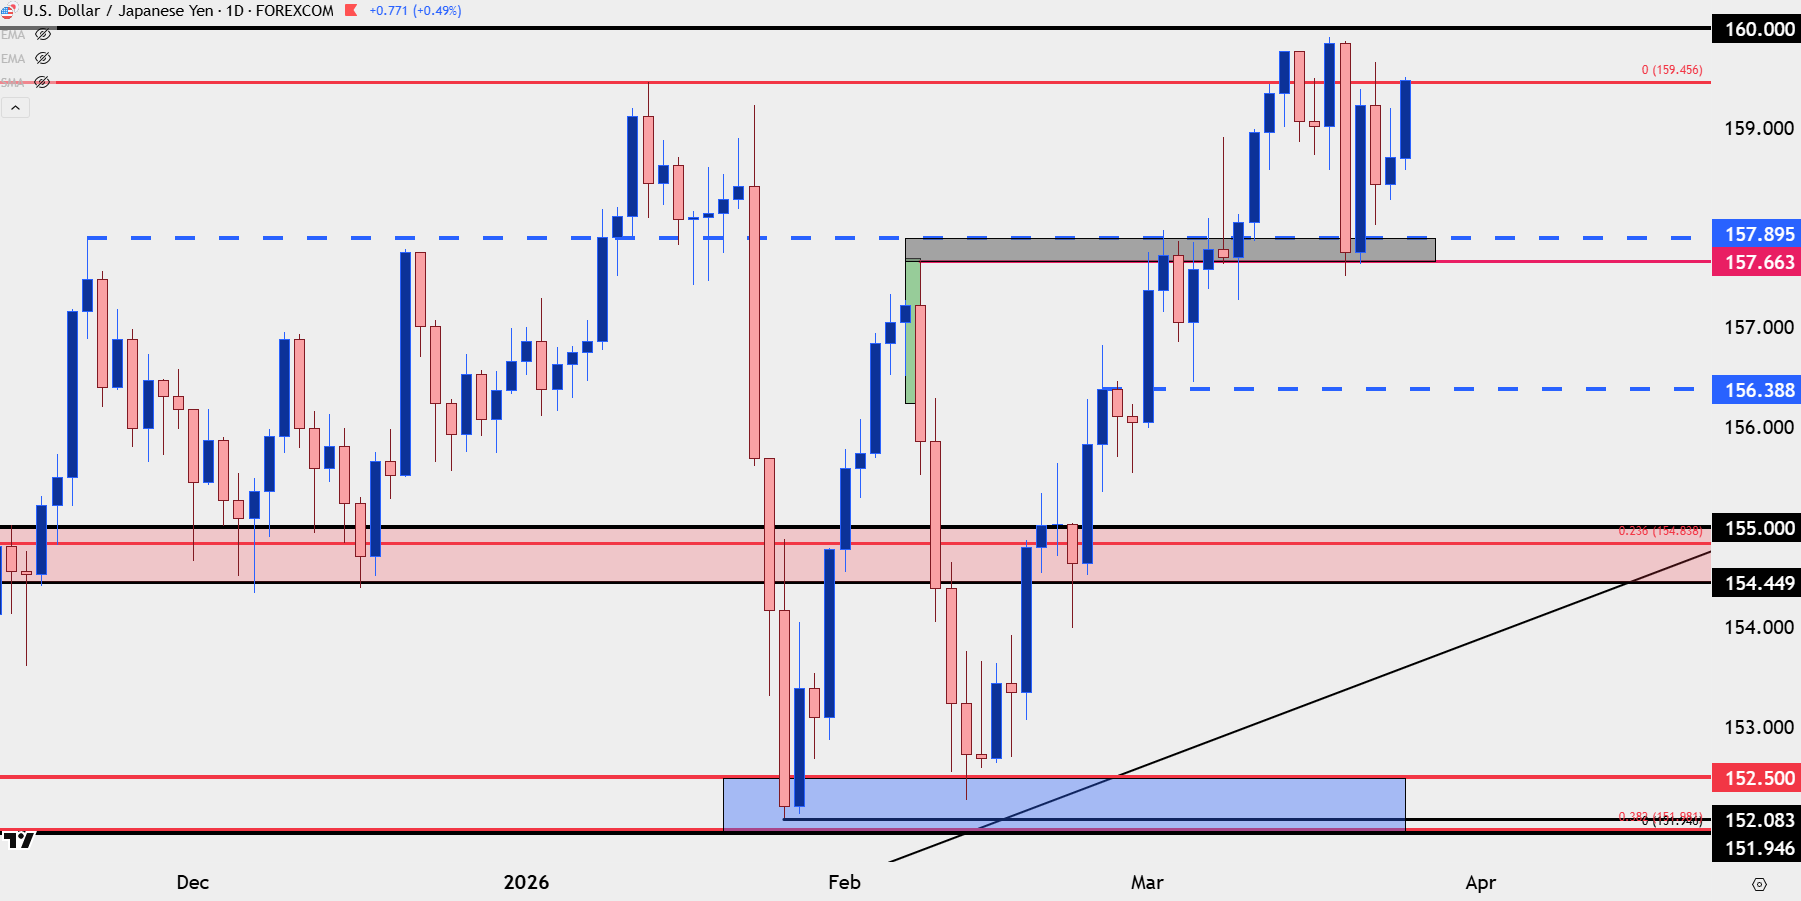
Chart prepared by James Stanley; data derived from Tradingview
--- written by James Stanley, Senior Market Analyst, Global Macro



Open an account in minutes
Experience award-winning platforms with fast and secure execution, and enjoy tight spreads from 0.5 pts on FX and 0.3 pts on indices.
Economic calendar
Web Trader platform
Our sophisticated web-based platform is packed with features.
Related articles

USD/MXN Analysis: Is Super Peso Starting to Fade?
Over recent trading sessions, the Mexican peso has continued to show signs of weakness against the U.S. dollar. This can already be seen in USD/MXN, which has gained more than 1.7% over the last three sessions, highlighting sustained buying pressure in favor of the dollar in the short term.


Nasdaq 100 Forecast: NDX slips as Treasury yields keep rising
U.S. stocks are falling at the start of Q4, as gains in software stocks offset concerns over soaring Treasury yields. U.S. Treasury yields continue to rise, with the 10-year yield up 2 basis points at 5.31% and the 30-year at 5.66%, multi-decade highs.


US Dollar Technical Outlook: DXY Bulls Meet Resistance at Yearly Highs 10 1 2026
The U.S. Dollar has held firm despite fading Fed hike bets, but Friday’s payrolls could test the rally’s staying power.

This report is intended for general circulation only. It should not be construed as a recommendation, or an offer (or solicitation of an offer) to buy or sell any financial products. The information provided does not take into account your specific investment objectives, financial situation or particular needs. Before you act on any recommendation that may be contained in this report, independent advice ought to be sought from a financial adviser regarding the suitability of the investment product, taking into account your specific investment objectives, financial situation or particular needs.
StoneX Financial Pte. Ltd., may distribute reports produced by its respective foreign entities or affiliates within the StoneX group of companies or third parties pursuant to an arrangement under Regulation 32C of the Financial Advisers Regulations. Where the report is distributed to a person in Singapore who is not an accredited investor, expert investor or an institutional investor (as defined in the Securities Futures Act), StoneX Financial Pte. Ltd. accepts legal responsibility to such persons for the contents of the report only to the extent required by law. Singapore recipients should contact StoneX Financial Pte. Ltd. at 6826 9988 for matters arising from, or in connection with the report.
In the case of all other recipients of this report, to the extent permitted by applicable laws and regulations neither StoneX Financial Pte. Ltd. nor its associated companies will be responsible or liable for any loss or damage incurred arising out of, or in connection with, any use of the information contained in this report and all such liability is hereby expressly disclaimed. No representation or warranty is made, express or implied, that the content of this report is complete or accurate.
StoneX Financial Pte. Ltd. is not under any obligation to update this report.
Trading CFDs carries a high level of risk that may not be suitable for some investors. Consider your investment objectives, level of experience, financial resources, risk appetite and other relevant circumstances carefully. The possibility exists that you could lose some or all of your investments, including your initial deposits. If in doubt, please seek independent expert advice. Visit www.forex.com/en-sg/terms-and-policies for the complete Risk Disclosure Statement.