
The US Dollar retains bullish potential as we move into March trade but as we go into next week there is a bit of disappointment for buyers as resistance held at the familiar Fibonacci level of 97.94 on three consecutive days and for five of the past seven.
It’s not all doom and gloom at this point as support has held up at the 97.33-97.46 area, but when a bullish breakout formation fails to give way following a persistent effort there’s a bit of dismay and at the very least, the other side of the matter needs to be investigated.
For that, I remain partial towards bullish reversal setups in EUR/USD and perhaps even GBP/USD.
For USD-strength, I’m continuing to track USD/JPY as I think that remains the more viable major pair with current structure, although there’s also a support test in USD/CAD that keeps the door open for DXY bulls, as well.
In the Dollar, the daily chart of DXY highlights that tension at resistance well and this is the same price that had set the lows last April before coming in as support in October and December. It was back in the picture to hold the highs in early-February and that’s become somewhat of a saga over the past two weeks as bulls just have not been able to break through.
US Dollar Daily Price Chart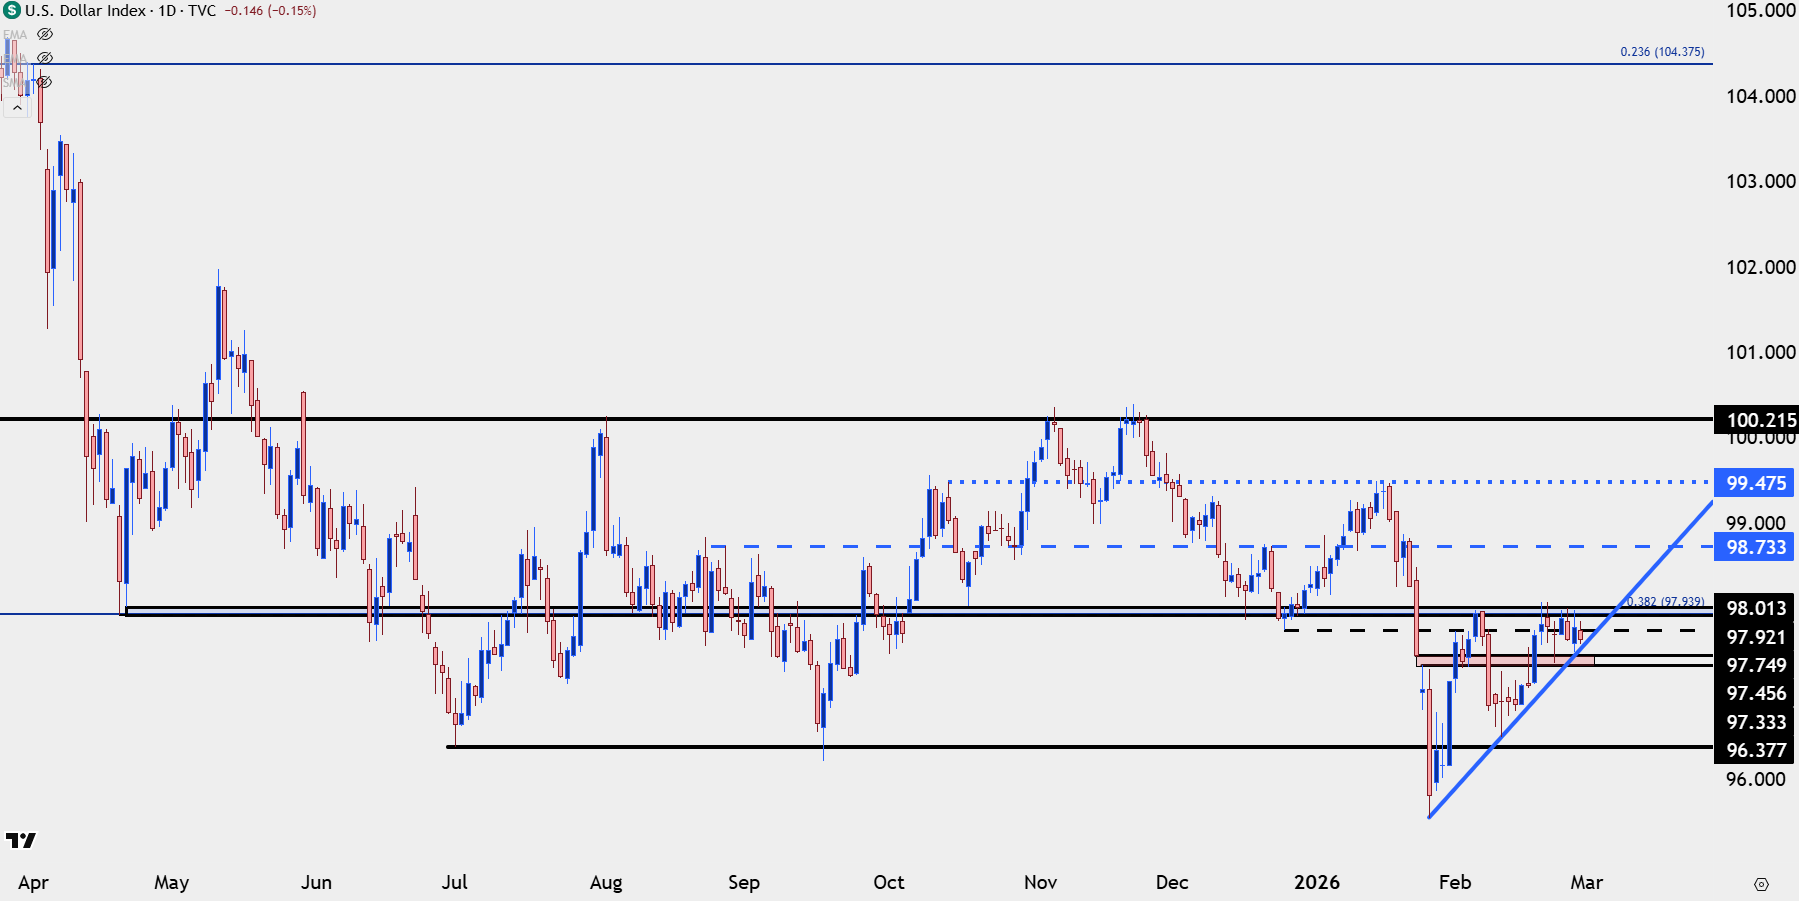
Chart prepared by James Stanley; data derived from Tradingview
USD Shorter-Term
The four-hour chart highlights the formation well along with those persistent tests of resistance. Given the continued pattern of higher-lows it’s not quite game over on the long side yet, but given the consolidation it does appear as though the USD is coiled and ready to break, in one direction or the other.
As an example of a clean resolution to an ascending triangle we can look at gold from last week, which I covered in the USD weekend write-up. That formation led to breakout in the early part of this week and that breakout ran right up to next resistance at the 5238 level. Currencies are, of course, a little different, and for this formation in the USD to clear upside, we’ll likely need to see USD/JPY bulls and JPY bears make a forward push ahead, which could entail failure in bullish setups in EUR/USD and GBP/USD.
But, for now, the ascending triangle remains in place and buyers and have open door to make a push in DXY.
US Dollar Four-Hour Chart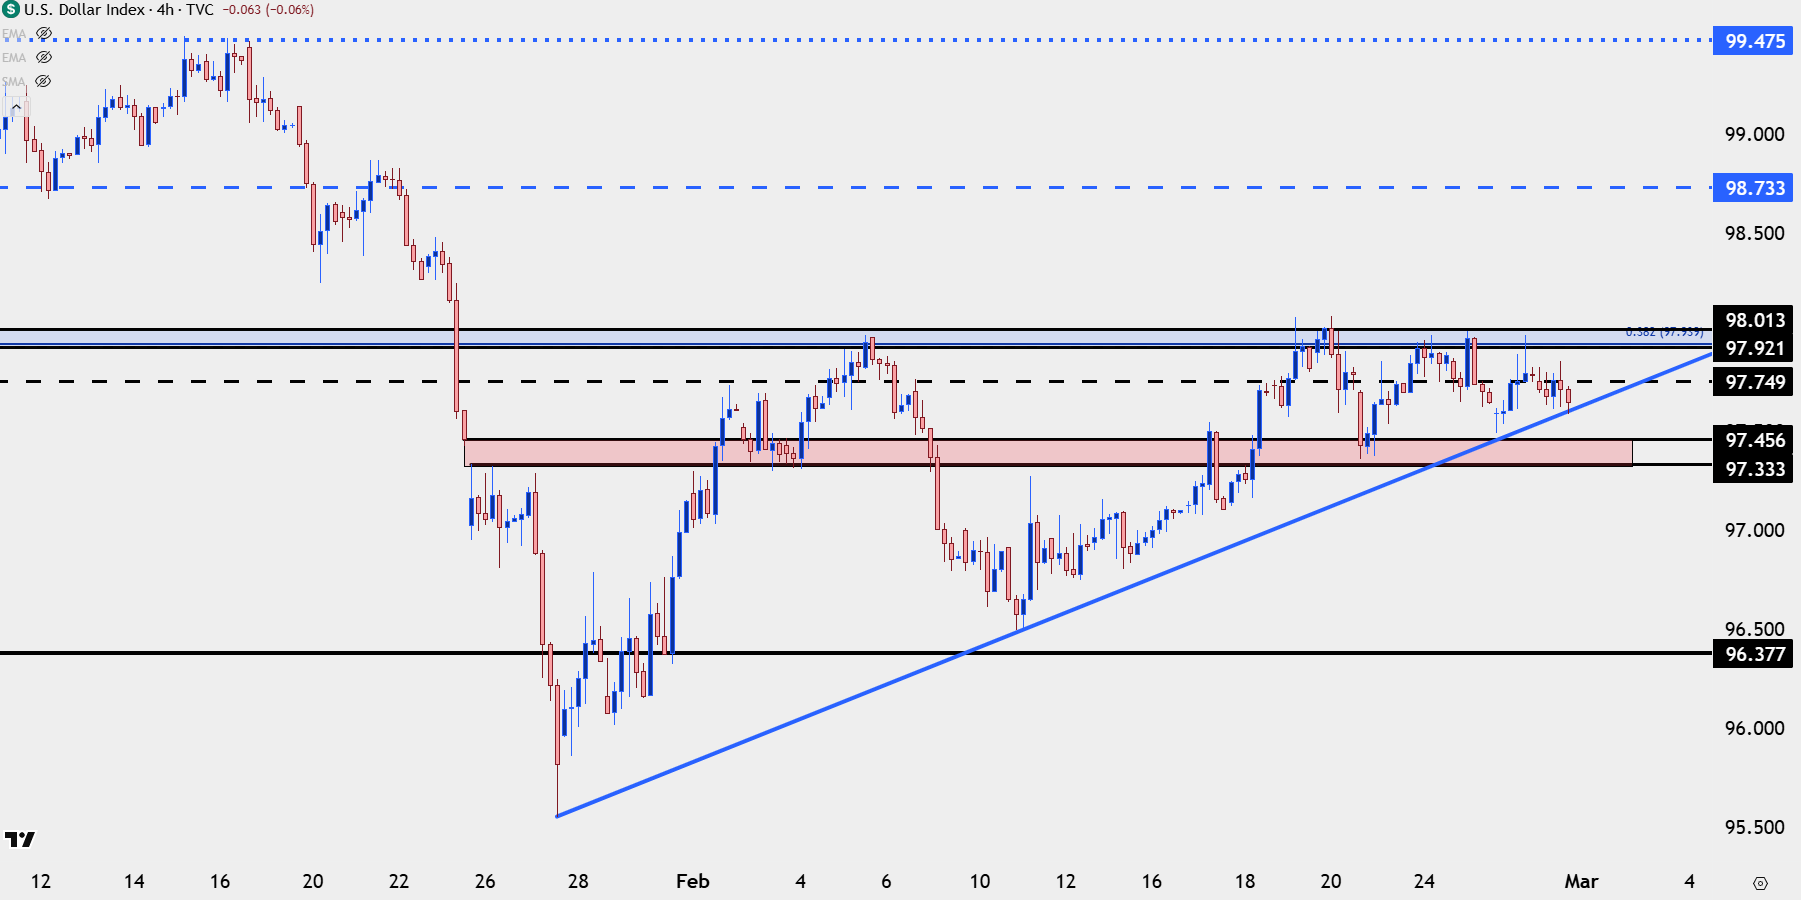
Chart prepared by James Stanley; data derived from Tradingview

EUR/USD
There’s been a similar case of consolidation in EUR/USD and there’s even a relevant support level that syncs with the resistance level looked at above for DXY. In EUR/USD, the Fibonacci level at 1.1748, which set the low two weeks ago and that’s so far remained respected as a series of higher-low developed over the past week.
Given that support there’s a falling wedge formation that’s built, often approached with aim of bullish reversal with breakout potential. So far, buyers haven’t been able to make a notable push beyond resistance of 1.1837 but they also haven’t failed – so if we do see breakdown in the DXY setup above, I think EUR/USD is one of the more attractive major pairs to be tracking given that combination of recent higher-lows to go along with the big picture support and the bullish reversal formation that’s built with respect of that.
EUR/USD Four-Hour Chart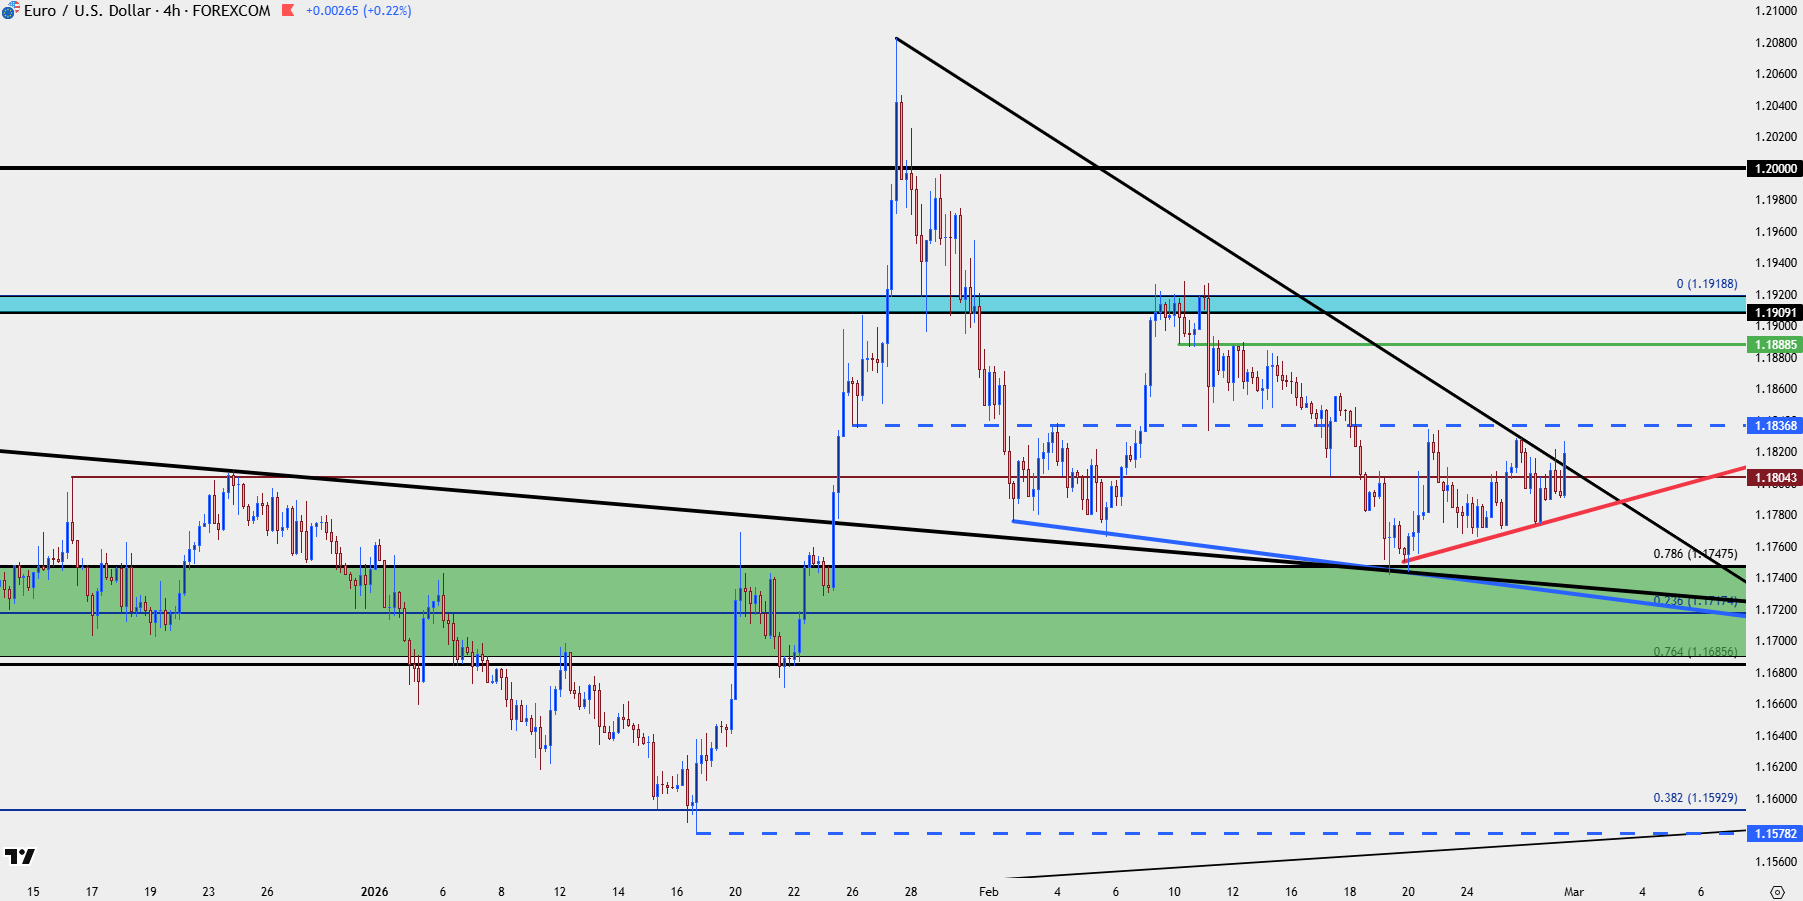
Chart prepared by James Stanley; data derived from Tradingview
GBP/USD
Cable has a similar backdrop as the above in EUR/USD although the picture isn’t quite as bright. A resistance level came into play on Wednesday and Thursday at 1.3568 and that led to a pullback. While sellers haven’t yet taken out the 1.3434 swing low, the bullish structure here isn’t quite as strong as what showed above with EUR/USD.
I wanted to look at this pair directly after EUR/USD so that we can contrast the structure between the two; and while there’s also a falling wedge here and bulls have an open door to push a breakout and a reversal, the backdrop hasn’t been quite as strong as it has in the above setup in EUR/USD.
GBP/USD Daily Price Chart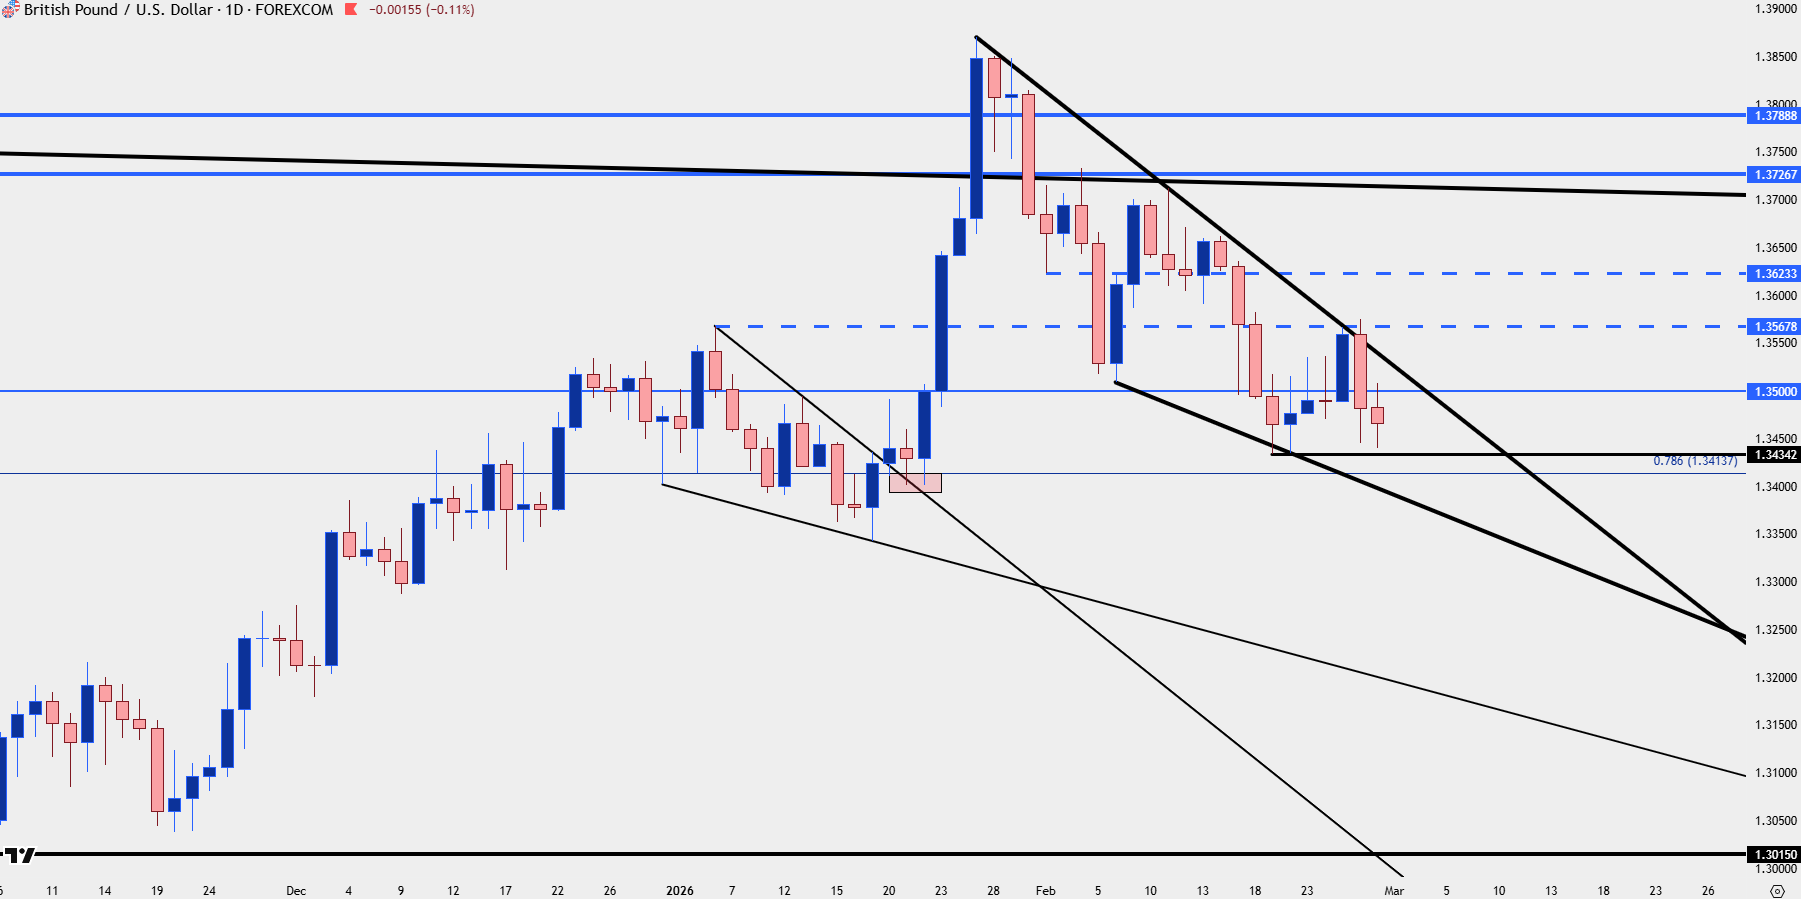
Chart prepared by James Stanley; data derived from Tradingview

USD/JPY
If we’re going to see the USD breakout from that formation looked at above I think it’ll need help from USD/JPY, as that pair has been a major push point for larger macro and FX themes given the long-term build of the carry trade.
That said, it’s increasingly difficult to chase the pair after a developed move as we’ve seen a lower-high develop following the late-January sell-off, and something like this can smell like the early stages of a positioning push as longs bail on hedges given proximity to a level that’s widely believed to have some element of defense from the Japanese Finance Ministry.
The 160.00 level hasn’t been a good spot for bulls over the past few years: It was defended twice in 2024 and the second episode led to a 2,000+ pip reversal. At the very least, even if it doesn’t lead in to a big picture reversal, it can run stops and this makes the perceived risk-reward on long setups as less attractive as we get closer to that line in the sand.
That’s probably why it hasn’t traded since July of 2024, as we’ve seen multiple episodes of sellers showing up before that price could come into play. But, with that said, buyers have so far shown up on support tests and of late, it’s the area from 151.95-152.50 that’s been well-defended, and on a shorter-term basis, the 154.45-155.00 zone remains viable on the long side of the pair.
USD/JPY Daily Chart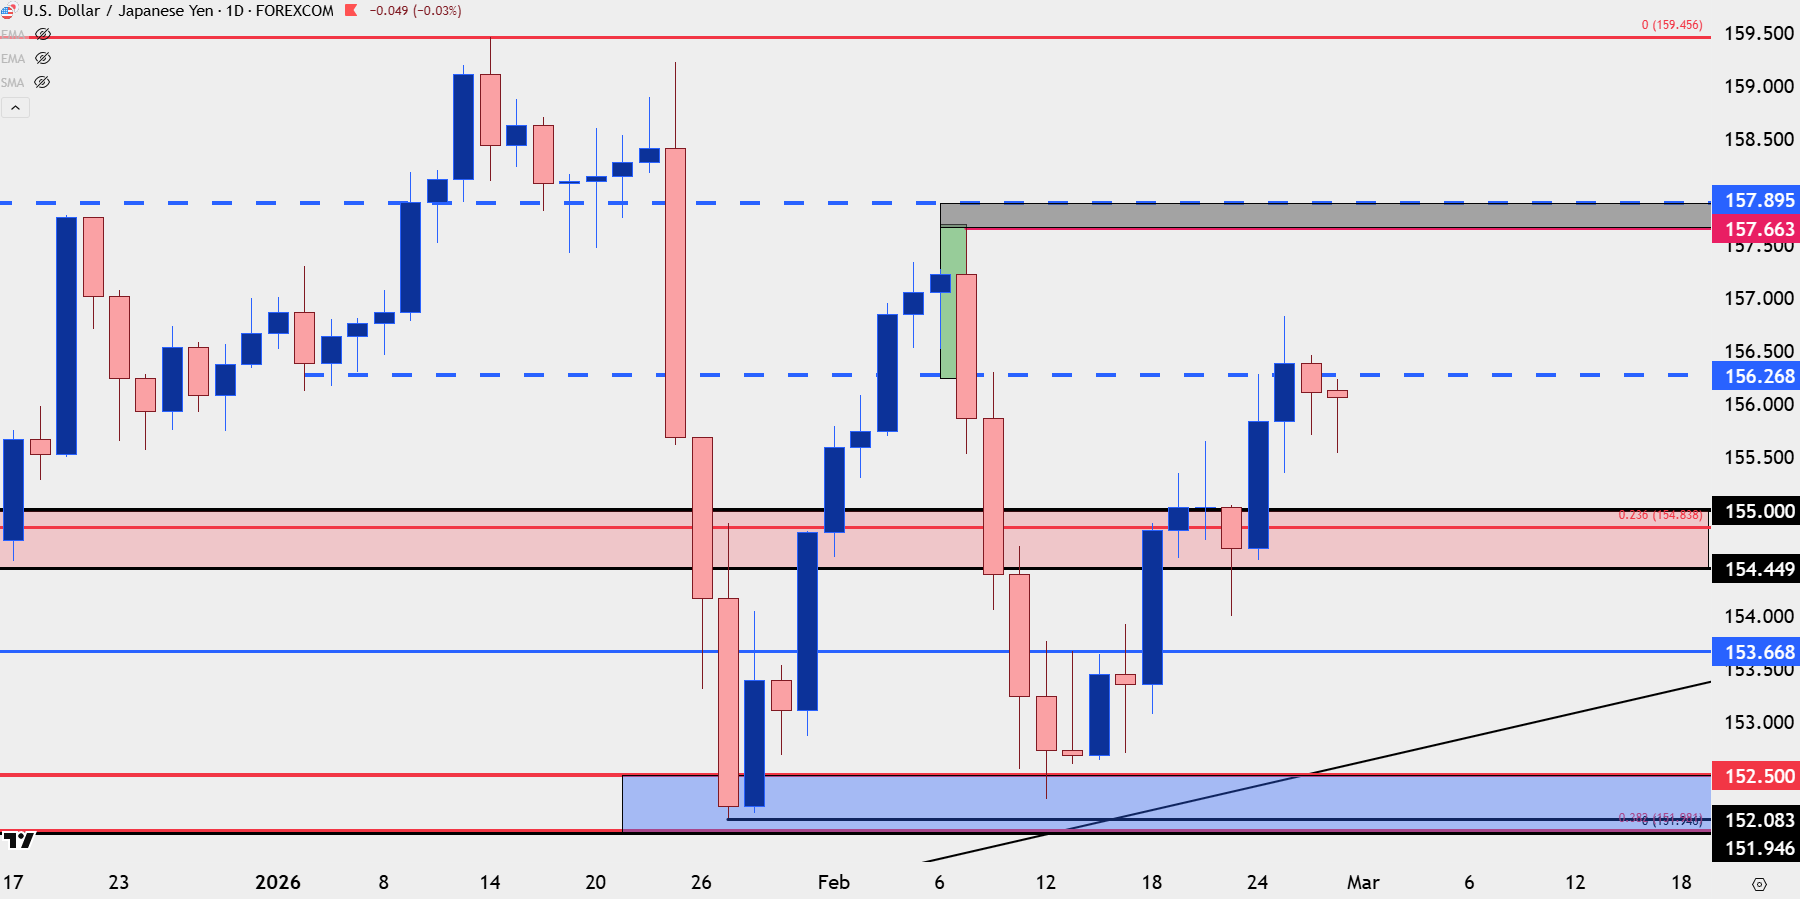
Chart prepared by James Stanley; data derived from Tradingview
USD/CAD
That 1.3727 level has turned out to be a tough spot for bulls with now a second hold of the highs. This was the same price that set up a double bottom formation last year that led to bullish breakout and a rally above the 1.4000 handle, but this time, it’s been back in as resistance following the bullish defense of the 1.3500 level in the pair.
I looked at the setup in an article earlier in the week and since then, that resistance hold has led to a pullback to a key support zone.
USD/CAD Daily Chart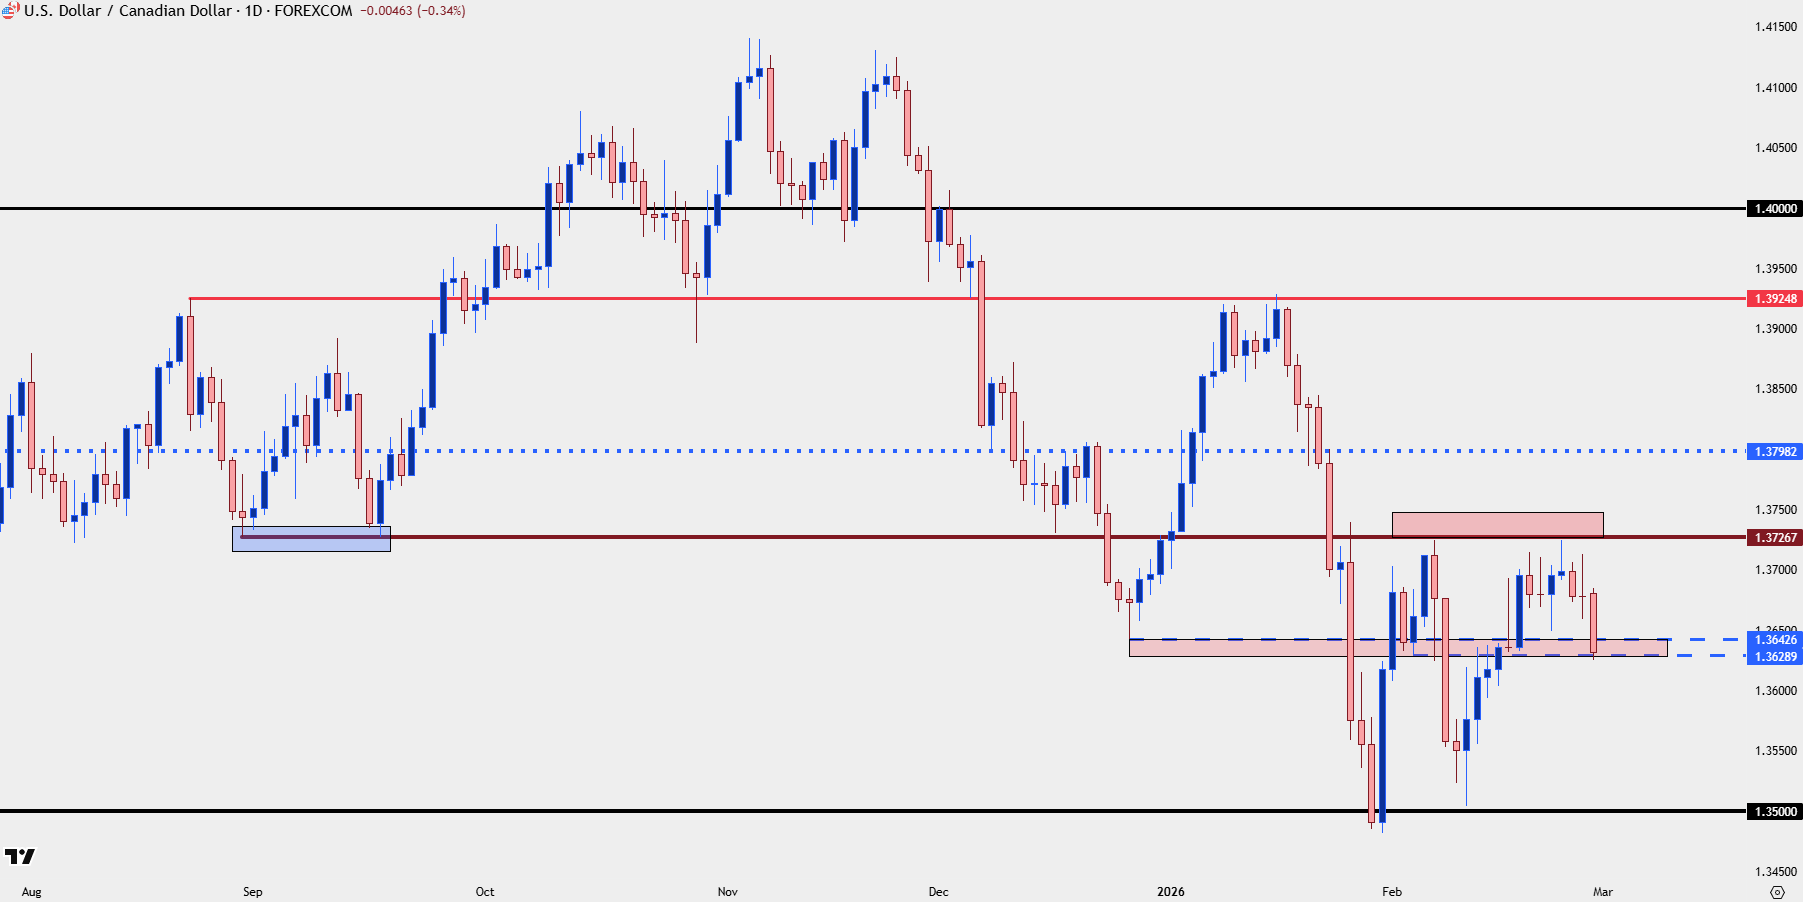
Chart prepared by James Stanley; data derived from Tradingview
USD/CAD Four-Hour
The four-hour chart of USD/CAD illustrates the importance of this zone well, as this was a support test in late-2025 trade and has since come in as both support and resistance. This keeps the door open for bulls if that zone can hold the lows through next week’s open, at which point a re-test of the 1.3727 would be the next step, after which bullish breakout potential would show up as the third test of that line-in-the-sand may not finish like the first two.
USD/CAD Four-Hour Chart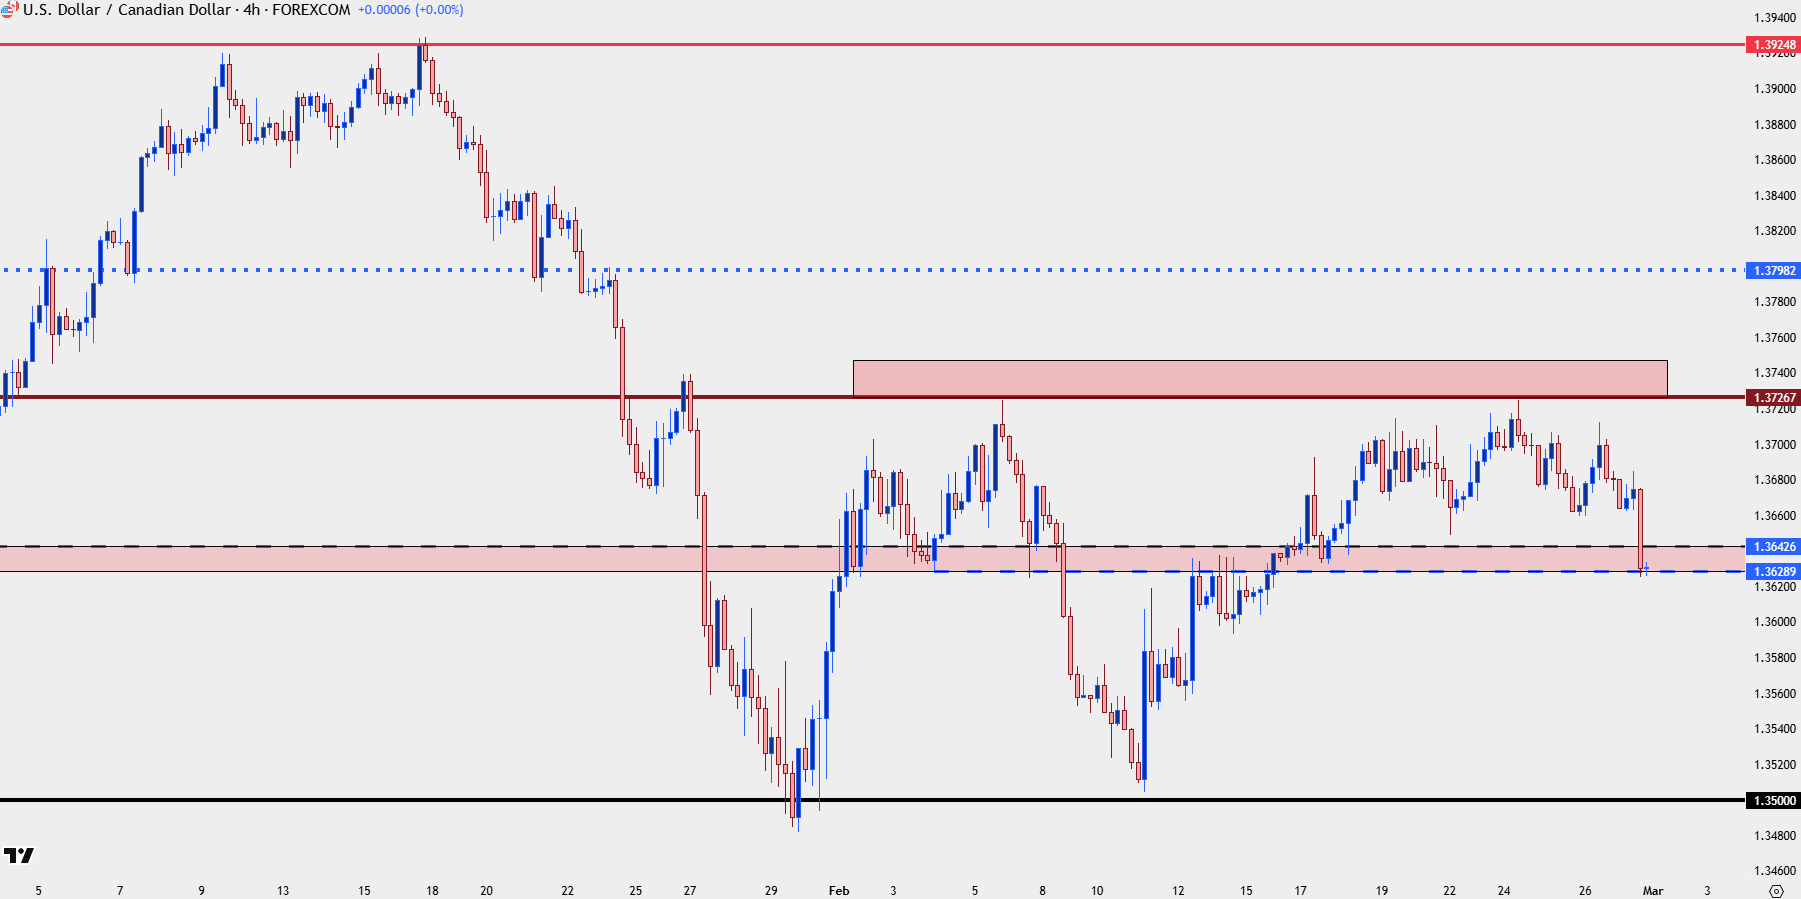
Chart prepared by James Stanley; data derived from Tradingview
Gold
I’m including gold as I believe there is some interplay with FX trends although the trend in gold has been more decisive and cleaner, and as the USD shows elements of consolidation, I want something that has displayed a cleaner trending bias to work with through next week.
Gold also brewed an ascending triangle formation as I had looked at last Friday. But that formation broke out in a very clean manner to start this week, with bulls pushing up for a test of resistance at the 5238-5270 area, which held the highs on Monday.
The pullback from that, as looked at in the Tuesday webinar, held support right at prior resistance around 5100 – and that led to another test of resistance at 5238 into the end of the week.
As we go into next week there’s now a spot for bulls to defend to keep the door open for another breakout and that’s around the 5191-5200 area on the spot gold chart.
Gold Four-Hour Chart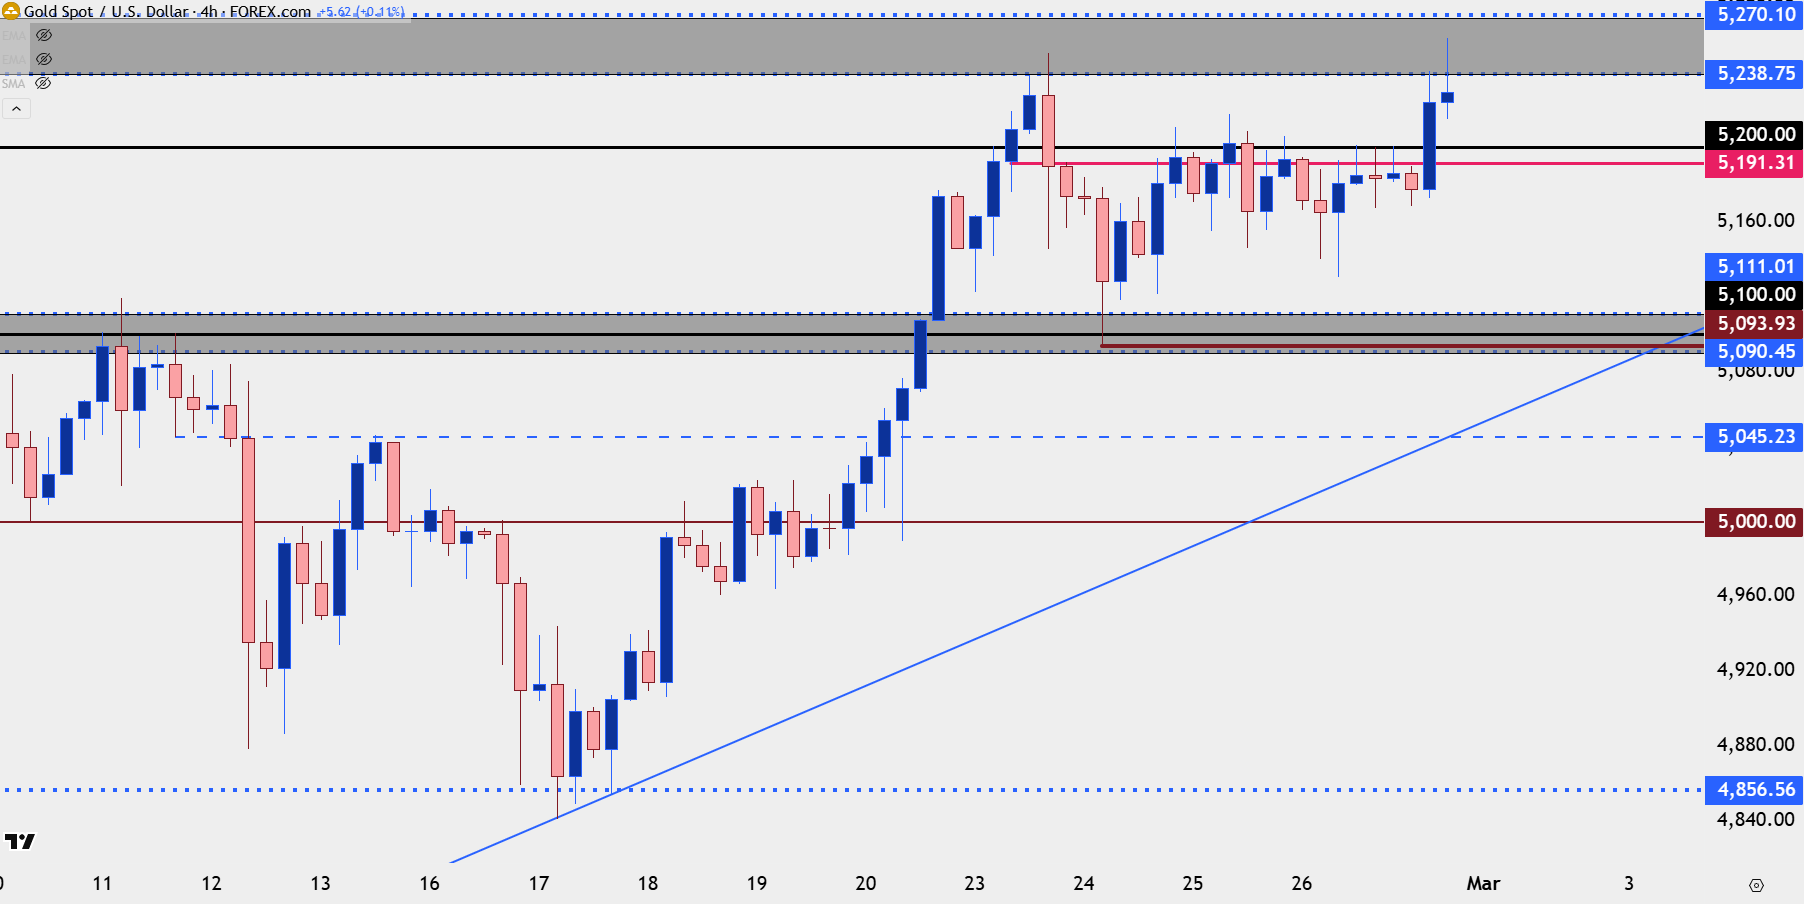
Chart prepared by James Stanley; data derived from Tradingview
--- written by James Stanley, Senior Market Analyst, Global Macro