







US Dollar rips higher as simmering inflation fears crush Fed rate cut hopes
As the US dollar surges, EUR/USD sinks to multi-year lows while USD/JPY bulls regain control. We look at key levels to watch and how shifting Fed expectations are dominating forex markets.
Share this:

- US inflation risks curtail Fed rate cut expectations, boosting US dollar
- Strong US CPI report today may amplify dollar strength
- EUR/USD hits multi-year lows, with further downside in sight
- USD/JPY rallies as Treasury yields climb and momentum shifts higher
Overview
Wednesday’s US consumer price inflation report could be the catalyst to spark an extended Fed pause, likely fuelling further gains in the US dollar against other major currencies.
With the economy powering ahead, even before the prospect of highly expansionary fiscal policy from the Trump administration, further signs of sticky inflationary pressures could push markets to flirt with the idea that the next Fed move may be a hike. As unlikely as that sounds, it’s something traders need to be prepared for as they double down on Trump trades, underpinned by expectations for a string of rate cuts ahead.
US inflation fight may not be over
The US economy simply won’t quit, defying expectations that higher interest rates would slow it down meaningfully. Instead, growth is running well above perceived potential, pointing to the risk of lower unemployment and higher inflation.
The Citi Economic Surprise Index has surged to multi-month highs, as shown below, with most data releases now topping forecasts despite much higher market expectations. Tellingly, US inflation surprises are now moderating after undershooting earlier this year. Longer-term market-based inflation expectations are also at multi-month highs, reflecting concerns the Fed may not be able—or willing—to bring inflation back to its mandated 2% target.
Source: Refinitiv
US core consumer price inflation has risen 0.3% in each of the past two months, with another 0.3% print forecast later today. Annualized on a one- and three-month basis, that's nearly double the Fed’s 2% target. While it’s not the Fed's preferred measure, 0.3% gains simply don’t get the job done.
Fed rate cut pricing evaporating fast…
With inflation concerns rising, expectations for Fed rate cuts by the end of 2025 are evaporating faster than a puddle in Death Valley during summer. When the Fed started its easing cycle in September, markets anticipated nearly eight 25bps cuts between November 2024 and December 2025. Now, that’s down to three. The trend is obvious, and it's powering US dollar strength.
Source: TradingView
…and that’s fuelling US dollar strength
The next chart shows the rolling 10-day correlation between the US dollar index (DXY) and US interest rates across the yield curve. The strongest relationship has been with short-term rates, most influenced by monetary policy expectations.
So, it’s no surprise that on the same day US two-year Treasury yields hit fresh post-election highs, the DXY surged to multi-year highs.
Source: TradingView
Contrary to some headlines, the dollar move is more about the Fed than Trump’s policies directly. Trump’s policies influence what the Fed may do, but even before the election, it was clear the US economy didn’t need a deep rate-cutting cycle to keep unemployment low.
DXY breaks nemesis downtrend
It’s not just fundamentals contributing to the bullish US dollar story. Technicals are also working in its favour with the DXY breaking above a long-running downtrend that has sparked multiple bearish reversals in the past. The weekly chart tells the story.
If we don’t see a meaningful reversal back below the trendline in the coming days, which would likely require a significant US inflation undershoot or retail sales data on Friday to unravel from a fundamental perspective, it may embolden traders to buy the break looking for a continuation of the bullish move. Momentum is to the upside, with common indicators such as RSI (14) not yet overbought on the weekly timeframe.
Source: TradingView
As the two largest constituents in the DXY, the technical picture for EUR/USD and USD/JPY is arguably more important than the dollar index given relative volumes traded in both pairs.
EUR/USD sick and unloved, understandably
EUR/USD looks like it's ready for last rites on the daily timeframe, briefly sinking to multi-year lows on Tuesday before bouncing into the close. With Europe’s largest economy in political turmoil and no obvious plan to boost activity other than cutting interest rates, only an undershoot in the US inflation report may prevent a deeper slide for the euro.
Source: TradingView
A break and close below 1.0602 would generate a bearish setup, allowing shorts to be established with a stop above for protection. Potential downside targets include 1.0517 and 1.0448—two prior market troughs. Momentum is with the bears, and RSI (14) is not yet oversold on the daily, reinforcing the bias to sell squeezes and downside breaks in the near term.
Honestly, the only thing the euro has going for it right now is just how unloved it is, creating the potential for short-term squeezes. But without fundamentals underpinning them, these rallies are likely to be brief.
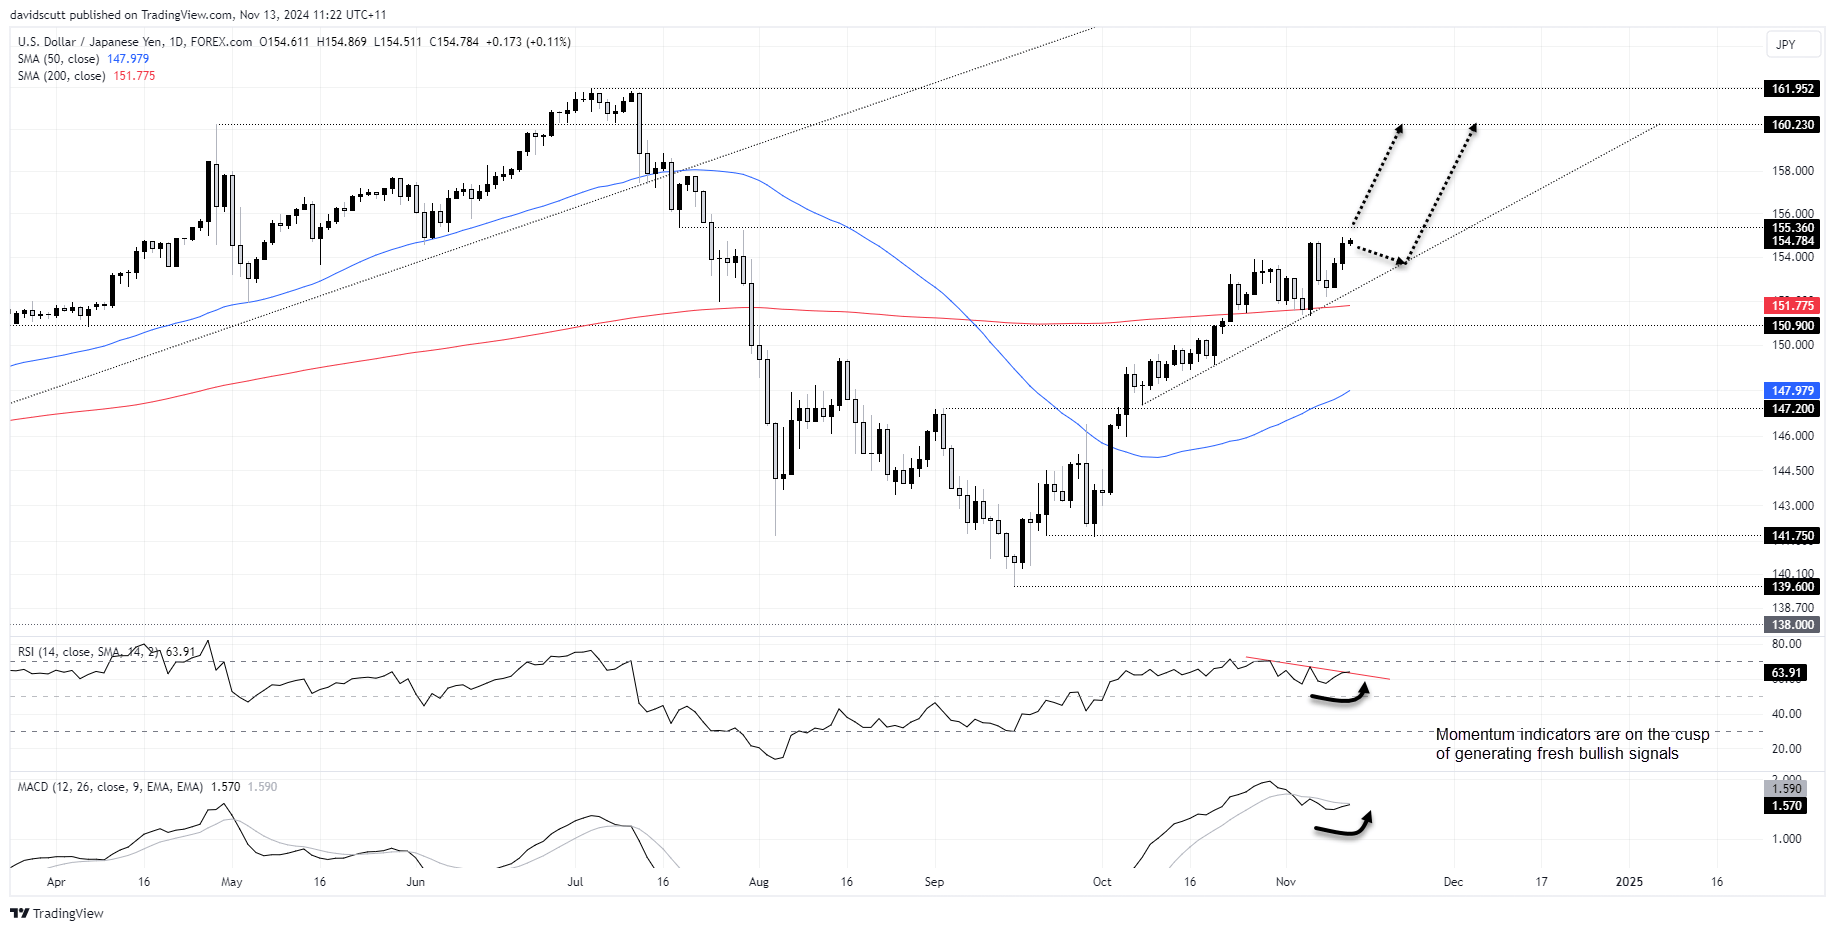
USD/JPY bulls regain ascendancy
When writing the USD/JPY week ahead report over the weekend, the reversal in US Treasury yields following the initial post-election surge had me thinking that risks were tilting lower, especially with momentum rolling over. How wrong I was!
Not only has USD/JPY gone in the opposite direction, but it’s also taken out last week’s high. With RSI (14) and MACD on the verge of generating fresh bullish signals, and the price remaining in an obvious uptrend, the path of least resistance is now skewing higher, barring a US inflation undershoot.
Source: TradingView
As someone who dislikes intraday scalping, I prefer to let bullish setups come to me rather than force lower-probability plays.
155.36 is a level on the radar, a minor level that acted as support and resistance briefly in early stages of the bearish USD/JPY unwind that began in July. A break of that could encourage traders to buy with a stop beneath for protection. A retest of the level—if broken—could improve the trade’s chances of success. Pullbacks towards the uptrend established in early October would also offer a setup, allowing longs to be established with a stop beneath for protection. Aside from 155.36, 160.23 and 161.95 loom as possible targets.
-- Written by David Scutt
Follow David on Twitter @scutty
How to trade with City Index
You can trade with City Index by following these four easy steps:
- Open an account, or log in if you’re already a customer
• Open an account in the UK
• Open an account in Australia
• Open an account in Singapore
- Search for the market you want to trade in our award-winning platform
- Choose your position and size, and your stop and limit levels
- Place the trade
Related tags:


Open an account in minutes
Experience award-winning platforms with fast and secure execution, and enjoy tight spreads from 0.5 pts on FX and 0.3 pts on indices.
Economic calendar
Web Trader platform
Our sophisticated web-based platform is packed with features.
Related articles
USD/CAD shooting star puts September surge on notice
USD/CAD has printed a clear bearish reversal pattern after an extraordinary September surge, but confirmation may depend heavily on how US Treasury yields react to Friday’s payrolls report.

USD/CHF Reverses as Swiss Franc Surges amid Bond Carnage
USD/CHF reverses from channel resistance as bond volatility surges and broad Swiss franc strength points to a possible carry-trade unwind.


USD/MXN Analysis: Is Super Peso Starting to Fade?
Over recent trading sessions, the Mexican peso has continued to show signs of weakness against the U.S. dollar. This can already be seen in USD/MXN, which has gained more than 1.7% over the last three sessions, highlighting sustained buying pressure in favor of the dollar in the short term.

This report is intended for general circulation only. It should not be construed as a recommendation, or an offer (or solicitation of an offer) to buy or sell any financial products. The information provided does not take into account your specific investment objectives, financial situation or particular needs. Before you act on any recommendation that may be contained in this report, independent advice ought to be sought from a financial adviser regarding the suitability of the investment product, taking into account your specific investment objectives, financial situation or particular needs.
StoneX Financial Pte. Ltd., may distribute reports produced by its respective foreign entities or affiliates within the StoneX group of companies or third parties pursuant to an arrangement under Regulation 32C of the Financial Advisers Regulations. Where the report is distributed to a person in Singapore who is not an accredited investor, expert investor or an institutional investor (as defined in the Securities Futures Act), StoneX Financial Pte. Ltd. accepts legal responsibility to such persons for the contents of the report only to the extent required by law. Singapore recipients should contact StoneX Financial Pte. Ltd. at 6826 9988 for matters arising from, or in connection with the report.
In the case of all other recipients of this report, to the extent permitted by applicable laws and regulations neither StoneX Financial Pte. Ltd. nor its associated companies will be responsible or liable for any loss or damage incurred arising out of, or in connection with, any use of the information contained in this report and all such liability is hereby expressly disclaimed. No representation or warranty is made, express or implied, that the content of this report is complete or accurate.
StoneX Financial Pte. Ltd. is not under any obligation to update this report.
Trading CFDs carries a high level of risk that may not be suitable for some investors. Consider your investment objectives, level of experience, financial resources, risk appetite and other relevant circumstances carefully. The possibility exists that you could lose some or all of your investments, including your initial deposits. If in doubt, please seek independent expert advice. Visit www.forex.com/en-sg/terms-and-policies for the complete Risk Disclosure Statement.