



US dollar strength masks growing disconnect with Treasury yields
US yields are falling, Fed tightening expectations are easing, yet the dollar remains firm. French debt concerns may help explain why, with several major currency pairs approaching important technical levels.
Share this:

- DXY's relationship with front-end yields abruptly turns negative
- Euro weakness offsets retreat in Fed tightening expectations
- US CPI backtesting reveals no consistent directional trading advantage
- DXY, EUR/USD and USD/JPY test important technical levels
US dollar resilience faces a busy week
The US dollar enters a busy week for economic data, headlined by CPI, PPI and retail sales on Wednesday and Thursday. However, while those releases will be the headline acts, what may be of greater interest is the abrupt breakdown in the dollar's relationship with front-end US Treasury yields.
Having maintained a generally positive relationship through much of this year, correlations have deteriorated sharply in October, with the dollar continuing to strengthen despite a partial reversal of September's surge in US yields and reduced expectations for further Fed tightening. Without renewed concerns over France's public finances weighing heavily on the euro, it's possible the dollar would already be trading considerably lower.
DXY's relationship with US Treasury yields breaks down
You can see the deterioration in the dollar's relationship with front-end US Treasury yields in the graphic below. As recently as the end of September, the 10-session rolling correlation between DXY and US two-year yields stood at +0.66, with the 20-session measure at +0.55. By the end of last week, those readings had fallen to −0.39 and +0.19, respectively.
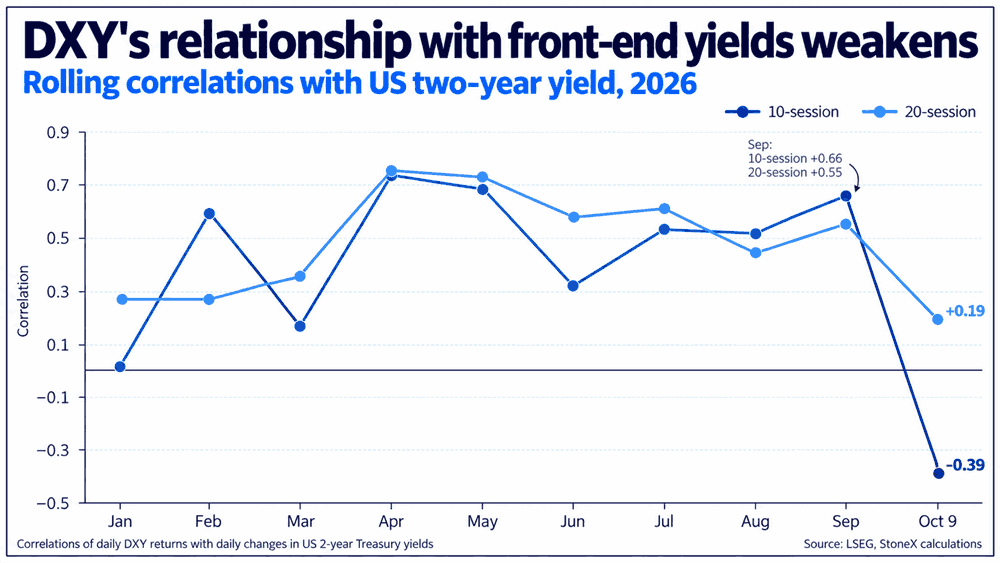
Source: LSEG
Similar movements have been seen against five-year yields in the belly of the curve, suggesting the change isn't confined to just the front end. Since the end of September, DXY has risen around 0.75%, despite US two-year yields falling 9.6 basis points and five-year yields declining 6.8 basis points over the same period.
Fed pricing retreats, but the dollar holds firm
Following the softer US payrolls report earlier this month, along with what appears to have been a concerted effort by Fed officials to push back against expectations for another rate hike in October, markets have reduced their expectations for further tightening. As shown in the graphic below, cumulative tightening priced through the end of next year has fallen from just over 100 basis points in mid-September to around 80 basis points.
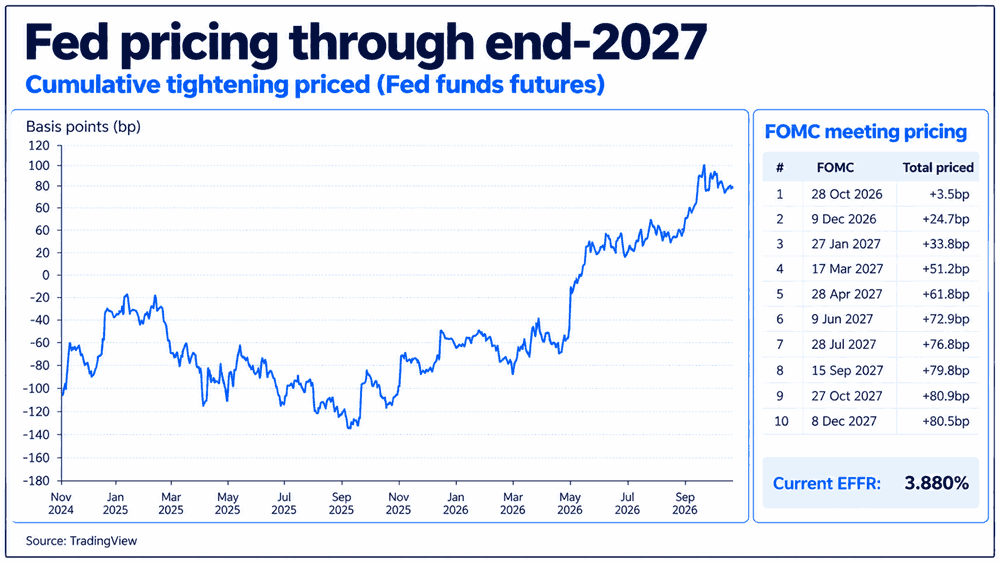
Source: TradingView
Had the dollar maintained the positive relationship with front-end Treasury yields seen earlier this year, it suggests that, all else being equal, the greenback would be weaker than where it is today.
However, currencies don't trade on US developments alone. Renewed concerns over France's public finances, fears of spillovers into other European debt markets and higher energy prices have weighed heavily on the euro. Given its 57.6% weighting in DXY, that weakness may explain why the dollar has remained so resilient despite the retreat in US rate expectations.
CPI brings volatility, but little directional certainty
While there's plenty of important US economic data coming our way this week, historical patterns offer little guidance on directional risks for the dollar. Backtesting of 188 CPI releases since 2011 shows that although the dollar tends to experience larger moves on inflation reporting days, there's little evidence of a consistent tendency to either extend or reverse its prevailing trend.
That suggests traders should keep a close eye not only on the incoming US data, but also on developments in European debt markets, which may prove just as influential in determining where the dollar heads next.
DXY: Bullish continuation pattern takes shape
Source: TradingView
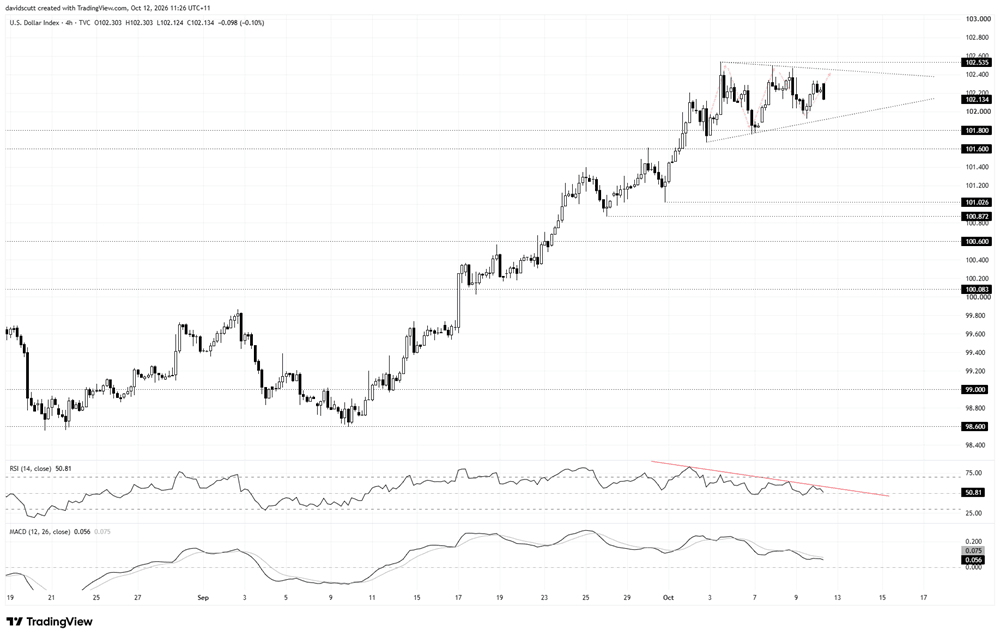
DXY is consolidating the strong bullish move that began in early September, coinciding with a sharp increase in market expectations for further Fed tightening.
Whether you call it a symmetrical triangle or a bull pennant, the price has now tested both sides of the structure on several occasions, with the trading range continuing to narrow as bullish momentum cools. RSI (14) has been setting lower highs and has returned towards the neutral 50 level, while MACD remains below its signal line, albeit still in positive territory.
Given the preceding rally, the formation suggests we may see an eventual bullish breakout take place, although confirmation is required via a break above the upper boundary of the structure.
The upper boundary of the structure currently sits just below 102.50, with rising trend support located just beneath 102.00. Beyond those levels, 102.535, the high set earlier this month, is the immediate upside level to watch.
A sustained break above 102.535 would strengthen the bullish continuation argument, potentially opening the door to 103.35, which acted as both support and resistance in late 2024 and early 2025. Beyond that, 104.68, the March 2025 swing high, is the next topside level of note.
On the downside, 101.80, the June 24 swing high, has attracted buying on the last two tests from below. Beneath that, 101.60 is another important level, having acted as resistance earlier this year. A break below the latter would put 101.026, the swing low set in late September, in play.
EUR/USD: Downside risks persist despite fading momentum
Source: TradingView
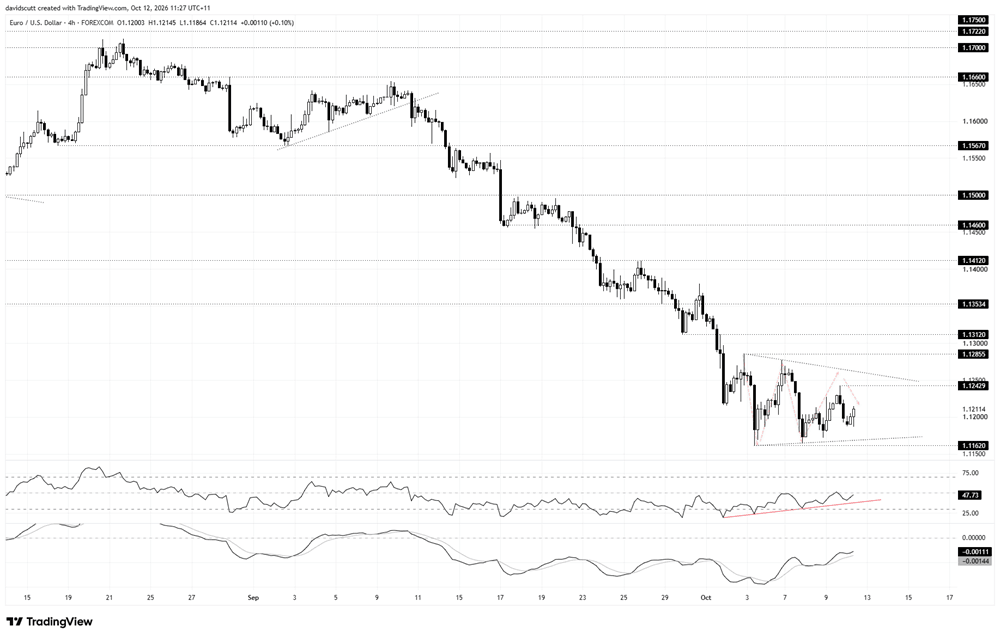
Unsurprisingly, a similar pattern is developing in EUR/USD on the four-hourly timeframe, albeit in the opposite direction. Following the sharp decline since September, the price has been consolidating within a contracting range that resembles either a bear pennant or a symmetrical triangle.
Since bottoming at 1.1162 earlier this month, the price has continued to contract, even as momentum indicators show signs of improvement despite unresolved concerns in French debt markets. RSI (14) has been setting higher lows and has returned to the neutral 50 level, while MACD has crossed above its signal line and is trending higher, albeit remaining marginally in negative territory.
It's a bearish continuation pattern, pointing to the risk of an eventual breakdown, although confirmation is still required.
On the downside, the lower boundary of the structure currently sits around 1.1165, just above the October swing low at 1.1162, making this an important support zone to watch. A breakdown would put 1.1065 in play, the swing low set in May 2025, with little other obvious technical support in between.
Overhead, 1.12429, the high set on Friday, is the immediate level to watch, followed by the upper boundary of the structure around 1.1260. Above that, 1.12855, where the formation began, is the next upside level of note. A break higher would put 1.1312 in play, the late-September low that subsequently gave way during the decline into October.
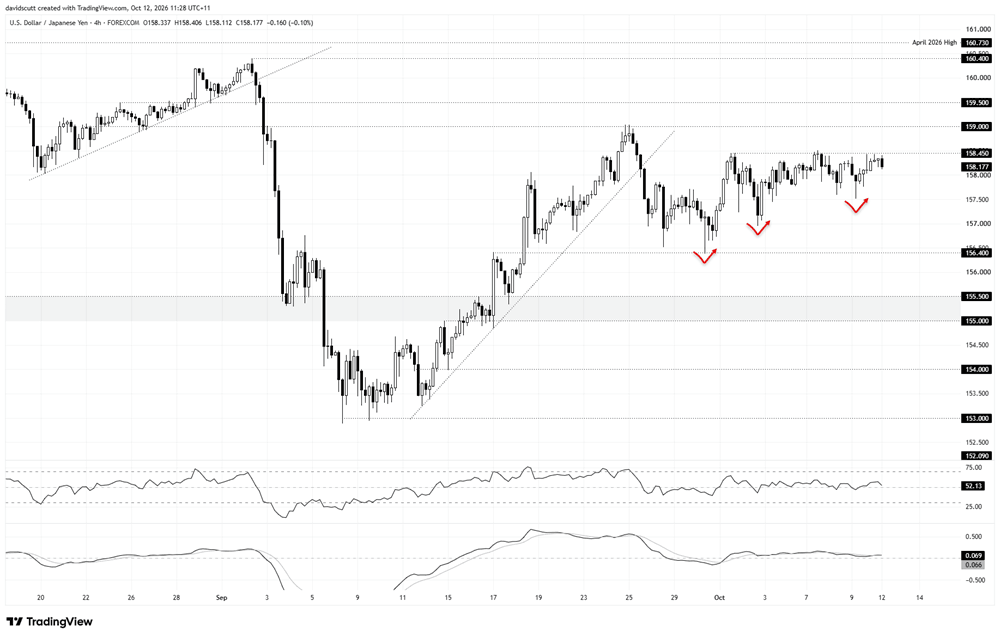
USD/JPY: Higher lows put resistance under pressure
Source: TradingView
USD/JPY has repeatedly struggled to overcome resistance at 158.45 since early October, including another failed attempt earlier today. However, since bottoming at 156.40 in late September, we've seen a series of higher lows, with buyers stepping in at progressively shallower levels.
It's not quite an ascending triangle, but it has that feel to it, with the price gradually squeezing higher towards horizontal resistance at 158.45. That makes 158.45 the immediate level to watch, with a break above potentially opening the door to 159.00 and 159.50.
On the downside, dips towards 157.50 and below have been bought over the past week, making that the first level to watch, followed by 157.00 and 156.40.
For a more detailed look at USD/JPY's fundamental drivers and technical outlook, see our USD/JPY Week Ahead analysis here.


Open an account in minutes
Experience award-winning platforms with fast and secure execution, and enjoy tight spreads from 0.5 pts on FX and 0.3 pts on indices.
Economic calendar
Web Trader platform
Our sophisticated web-based platform is packed with features.
Related articles
EUR/USD outlook: Currency Pair of the Week | October 12, 2026
News over the weekend, including continued Houthi strikes in Riyadh has had negative impact on foreign currencies so far, especially those where the economy relies on energy imports. The EUR/USD is particularly vulnerable as lingering concerns over French fiscal policy continue to undermine the euro.

Oil, EUR/USD forecast: Two trades to watch 121026
Oil weighs up Russia developments against Middle Eastern tensions. EUR/USD struggles around 1.12 with US and EZ inflation data this week.


Iron ore bulls face a perfect storm as price tests major support
Deteriorating steelmaker profitability, seasonal weakness and bearish technicals are weighing on iron ore. But with the price testing critical support, there's genuine two-way directional risk despite the substantial headwinds facing bulls.
This report is intended for general circulation only. It should not be construed as a recommendation, or an offer (or solicitation of an offer) to buy or sell any financial products. The information provided does not take into account your specific investment objectives, financial situation or particular needs. Before you act on any recommendation that may be contained in this report, independent advice ought to be sought from a financial adviser regarding the suitability of the investment product, taking into account your specific investment objectives, financial situation or particular needs.
StoneX Financial Pte. Ltd., may distribute reports produced by its respective foreign entities or affiliates within the StoneX group of companies or third parties pursuant to an arrangement under Regulation 32C of the Financial Advisers Regulations. Where the report is distributed to a person in Singapore who is not an accredited investor, expert investor or an institutional investor (as defined in the Securities Futures Act), StoneX Financial Pte. Ltd. accepts legal responsibility to such persons for the contents of the report only to the extent required by law. Singapore recipients should contact StoneX Financial Pte. Ltd. at 6826 9988 for matters arising from, or in connection with the report.
In the case of all other recipients of this report, to the extent permitted by applicable laws and regulations neither StoneX Financial Pte. Ltd. nor its associated companies will be responsible or liable for any loss or damage incurred arising out of, or in connection with, any use of the information contained in this report and all such liability is hereby expressly disclaimed. No representation or warranty is made, express or implied, that the content of this report is complete or accurate.
StoneX Financial Pte. Ltd. is not under any obligation to update this report.
Trading CFDs carries a high level of risk that may not be suitable for some investors. Consider your investment objectives, level of experience, financial resources, risk appetite and other relevant circumstances carefully. The possibility exists that you could lose some or all of your investments, including your initial deposits. If in doubt, please seek independent expert advice. Visit www.forex.com/en-sg/terms-and-policies for the complete Risk Disclosure Statement.