




US Indices Technical Outlook: Wall Street Bulls Tread Carefully Near Highs
Wall Street’s rally is losing steam despite upbeat US–China trade talks. Bearish patterns and fading momentum suggest the major US indices may be nearing a turning point.
Share this:

US indices may still be grinding higher, but it’s clear they’re making hard work of it. Despite positive headlines from US–China trade talks, Wall Street appears less enthused. Markets seem to be suffering from trade war fatigue, with volatility receding and once-reliable themes like the TACO trade (Tech, AI, Chips, Oil) beginning to stall. While the broader trend remains up, the slow, choppy nature of the rally suggests bulls should tread carefully at these elevated levels.
View related analysis:
- Nasdaq 100 Leads Wall Street Higher on Consumer Sentiment Rebound
- ASX 200, Hang Seng, Nikkei 225 Futures: Bull Rallies Face Resistance
- US Dollar Outlook: Don’t Write Off the USD Just Yet
- Gold Outlook: Seasonal Weakness and Fading Momentum Hint at June Pullback
View related analysis:
- Nasdaq 100 Leads Wall Street Higher on Consumer Sentiment Rebound
- ASX 200, Hang Seng, Nikkei 225 Futures: Bull Rallies Face Resistance
- US Dollar Outlook: Don’t Write Off the USD Just Yet
- Gold Outlook: Seasonal Weakness and Fading Momentum Hint at June Pullback
Wall Street Futures Technical Analysis: S&P 500, Nasdaq 100, Dow Jones
All three major Wall Street futures — the S&P 500, Nasdaq 100, and Dow Jones — are showing signs of exhaustion. Rising wedge formations and fading momentum near key resistance levels suggest a potential reversal. With bullish catalysts like the US–China trade deal already priced in, the inability to push significantly higher may leave these indices vulnerable to a pullback.
S&P 500 Futures (ES) Technical Analysis
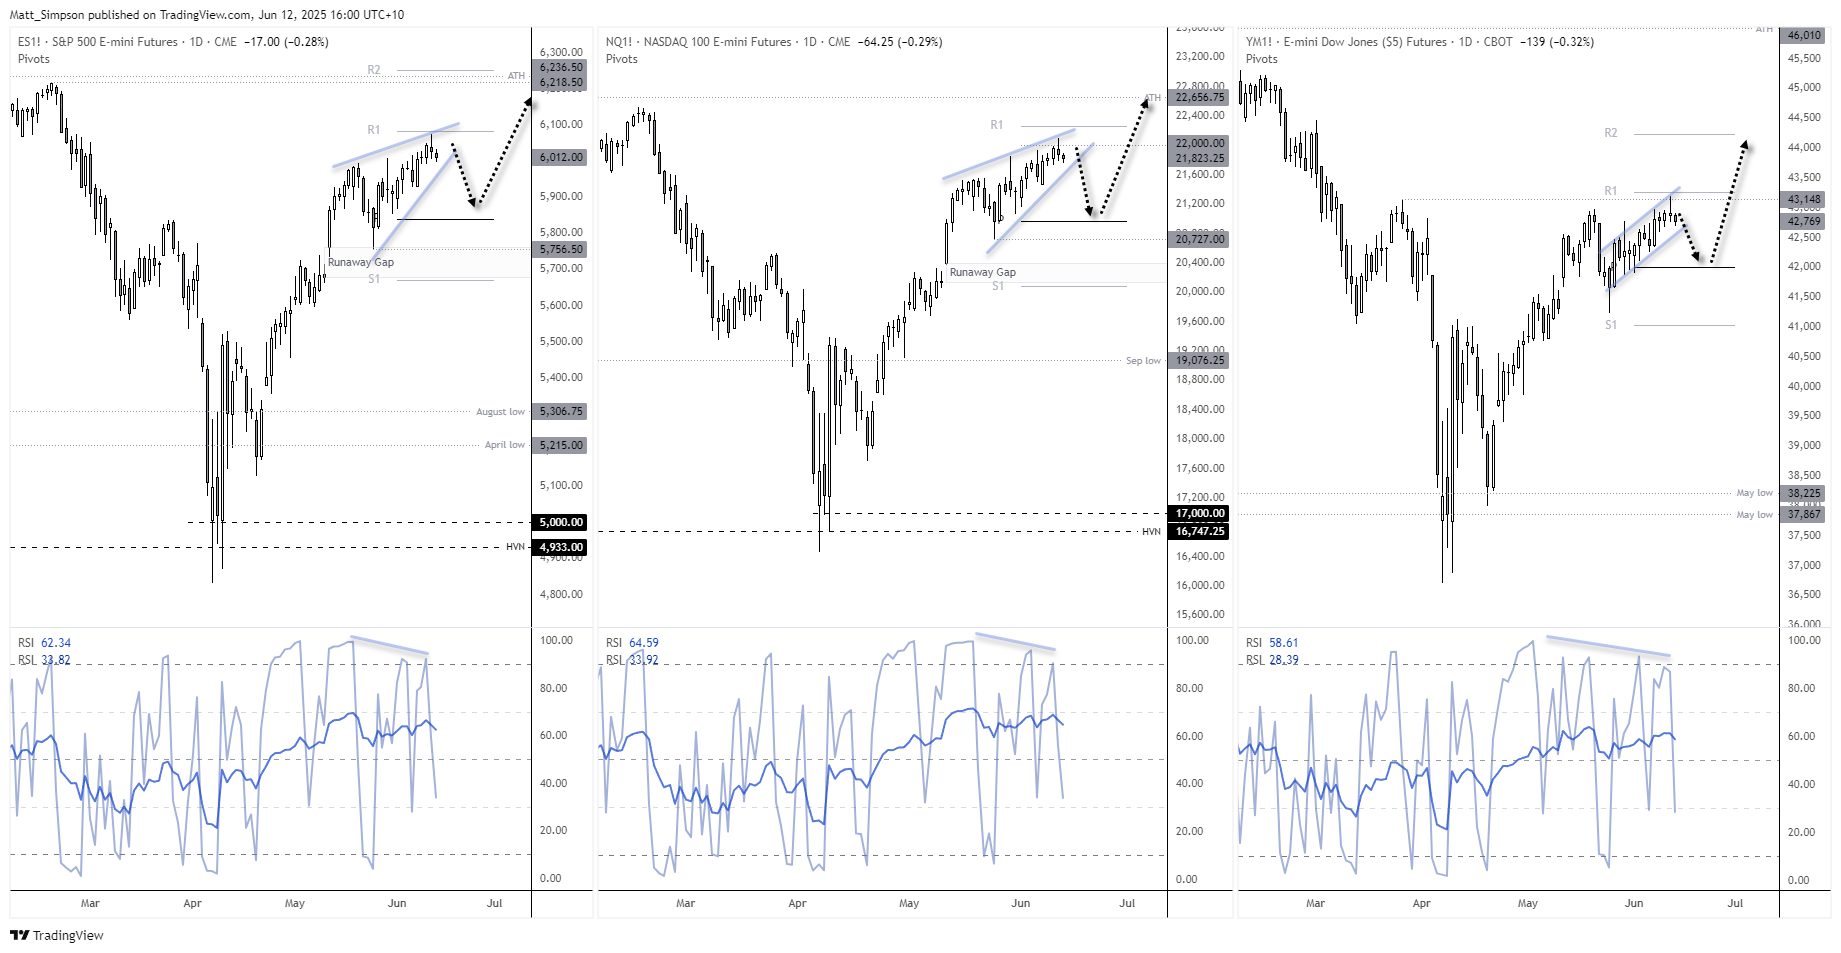
The S&P 500 futures market entered a technical bull market on Tuesday with its 20% rally from the daily-close low on April to Tuesday’s close. I have noted over the years such achievements are quite often followed by a reversal, as if traders are waiting to book profits on the ‘bull market’ headlines. It comes as no major surprise to see Wednesday was a small shooting star candle.
Furthermore, a rising wedge is forming on the daily charts with a bearish divergence on the RSI (14) and RSI (2) in the overbought zone. The rally has also paused just beneath the monthly pivot point (6083.25)
The rising wedge projects a target near its base at 5765.5, which is near the supposed ‘runaway gap’. If prices get that far we can safely say it was never a runaway gap after all – as they remain in the centre of very strong trends.
Nasdaq 100 Futures (NQ) Technical Analysis
The tech-heavy Nasdaq 100 has led Wall Street’s recovery, surging 34.3% from the April low to this week’s high. However, bearish reversal signals are emerging. A rising wedge pattern — often a precursor to a pullback — is forming alongside bearish divergences on key momentum indicators.
Unlike the S&P 500, Nasdaq 100 futures have yet to reach the monthly R1 pivot, leaving potential room to stretch higher. Still, if the wedge breaks lower, a downside target near 20,727 comes into focus. Traders should also watch the 21,000 region, where the monthly pivot point at 20,970 could act as interim support.
Dow Jones Futures (YM) Technical Analysis
While Dow Jones futures lack the rising wedge formations seen on the S&P 500 and Nasdaq 100, they may still present the most compelling bearish setup if market sentiment turns. The Dow’s 17.7% rally from the April low is the weakest of the three major Wall Street indices, and prices have stalled just below the March 7 high. A bearish pin bar has formed at this resistance zone, which coincides with the monthly R1 pivot.
Bearish divergences on the daily RSI (14) and RSI (2) add technical weight to the downside case, and a break below support could invalidate a minor bullish channel on the daily chart — potentially exposing the Dow Jones to a deeper correction.
-- Written by Matt Simpson
Follow Matt on Twitter @cLeverEdge
How to trade with City Index
You can trade with City Index by following these four easy steps:
- Open an account, or log in if you’re already a customer
• Open an account in the UK
• Open an account in Australia
• Open an account in Singapore
- Search for the market you want to trade in our award-winning platform
- Choose your position and size, and your stop and limit levels
- Place the trade




Open an account in minutes
Experience award-winning platforms with fast and secure execution, and enjoy tight spreads from 0.5 pts on FX and 0.3 pts on indices.
Economic calendar
Web Trader platform
Our sophisticated web-based platform is packed with features.
Related articles

Australian Dollar Outlook: AUD/USD Screams Sentiment Extreme Into Fed, CPI
AUD/USD rebounds despite record bearish futures positioning, with Australian Q3 CPI and the Fed meeting threatening to trigger another short squeeze.

EUR/USD weekly outlook: FOMC and ECB to set the tone
The current backdrop is modestly bearish. On Friday, the EUR/USD closed modestly lower, down for the third consecutive day. The pair also posted a weekly decline after staging a modest recovery attempt in the previous week. Out of the past 8 weeks, the EUR/USD has fallen on 6 occasions. There is not much supporting factors for the single currency right now. So, the upside remains capped.


S&P 500, Nasdaq, Dow Forecast: Nasdaq Selloff Deepens as Dow Rally Stalls 10 24 2026
A failed S&P breakout and looming Nasdaq support test raise the stakes for next week’s Fed decision and October’s monthly close.

This report is intended for general circulation only. It should not be construed as a recommendation, or an offer (or solicitation of an offer) to buy or sell any financial products. The information provided does not take into account your specific investment objectives, financial situation or particular needs. Before you act on any recommendation that may be contained in this report, independent advice ought to be sought from a financial adviser regarding the suitability of the investment product, taking into account your specific investment objectives, financial situation or particular needs.
StoneX Financial Pte. Ltd., may distribute reports produced by its respective foreign entities or affiliates within the StoneX group of companies or third parties pursuant to an arrangement under Regulation 32C of the Financial Advisers Regulations. Where the report is distributed to a person in Singapore who is not an accredited investor, expert investor or an institutional investor (as defined in the Securities Futures Act), StoneX Financial Pte. Ltd. accepts legal responsibility to such persons for the contents of the report only to the extent required by law. Singapore recipients should contact StoneX Financial Pte. Ltd. at 6826 9988 for matters arising from, or in connection with the report.
In the case of all other recipients of this report, to the extent permitted by applicable laws and regulations neither StoneX Financial Pte. Ltd. nor its associated companies will be responsible or liable for any loss or damage incurred arising out of, or in connection with, any use of the information contained in this report and all such liability is hereby expressly disclaimed. No representation or warranty is made, express or implied, that the content of this report is complete or accurate.
StoneX Financial Pte. Ltd. is not under any obligation to update this report.
Trading CFDs carries a high level of risk that may not be suitable for some investors. Consider your investment objectives, level of experience, financial resources, risk appetite and other relevant circumstances carefully. The possibility exists that you could lose some or all of your investments, including your initial deposits. If in doubt, please seek independent expert advice. Visit www.forex.com/en-sg/terms-and-policies for the complete Risk Disclosure Statement.