









Gold Outlook: Seasonal Weakness and Fading Momentum Hint at June Pullback
Gold prices failed to extend gains in May for the first time since November. Seasonality and waning momentum point to a potential pullback in June.
Share this:

View related analysis:
- Gold Rally Stalls Below Monthly High: Is a Deeper Pullback Brewing?
- Gold at Technical Crossroads Ahead of GDP, PCE; ASX 200 Stalls at Resistance
- AUD/USD, AUD/NZD Outlook: Trump–Xi Talks Spark USD Headwinds, Yen Strength
- AUD/JPY, GBP/JPY Outlook: Yen Slips as Trade Talk Optimism Boosts Risk Appetite
View related analysis:
- Gold Rally Stalls Below Monthly High: Is a Deeper Pullback Brewing?
- Gold at Technical Crossroads Ahead of GDP, PCE; ASX 200 Stalls at Resistance
- AUD/USD, AUD/NZD Outlook: Trump–Xi Talks Spark USD Headwinds, Yen Strength
- AUD/JPY, GBP/JPY Outlook: Yen Slips as Trade Talk Optimism Boosts Risk Appetite
May was the first month since November that gold prices failed to take out the prior month’s high. This may not sound significant, but it is certainly a change of character from the rally that broke out in April 2024 and tells is that volatility is receding. Furthermore, April closed the month with a Rickshaw Man Doji, the monthly RSI (14) has been overbought since January, and a bearish divergence has formed on the monthly RSI (2) in its overbought zone.
Seasonality also suggests that a pullback in gold could be due, even if only a minor one.
Gold Spot Price Analysis: 43-Year Seasonal Trends Suggest Bearish Tilt
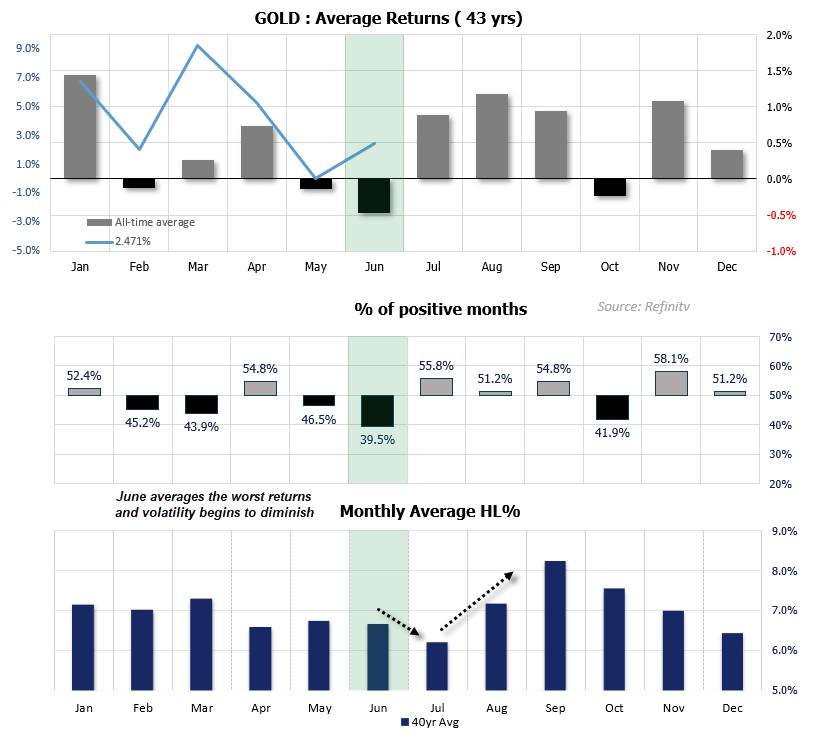
I have used 43 years of spot gold data, the maximum data available under the Refinitiv subscription. The statistical dashboard shows:
- June has averaged the strongest negative returns (-0.5%)
- Gold has also seen the lowest ‘win’ rate of 39.5% in June (60.5% lose rate)
- June is the fourth smallest average range for gold, with a high-to-low range of 6.7%
- July has delivered the least volatile average range for gold of 6.2%
- Volatility tends to increase notably in August and peak in September, while average returns become increasingly positive
Ultimately, price action supports my suspicion that gold’s recent rally may have run its course. The metal’s inability to extend gains in May signals that a pullback could be due—aligning with gold’s historically bearish seasonality in June. That said, any retracement may be shallow, as volatility typically softens during mid-year months before rising again in August.
Gold Investment Demand Eases, Weighing on Bullish Outlook
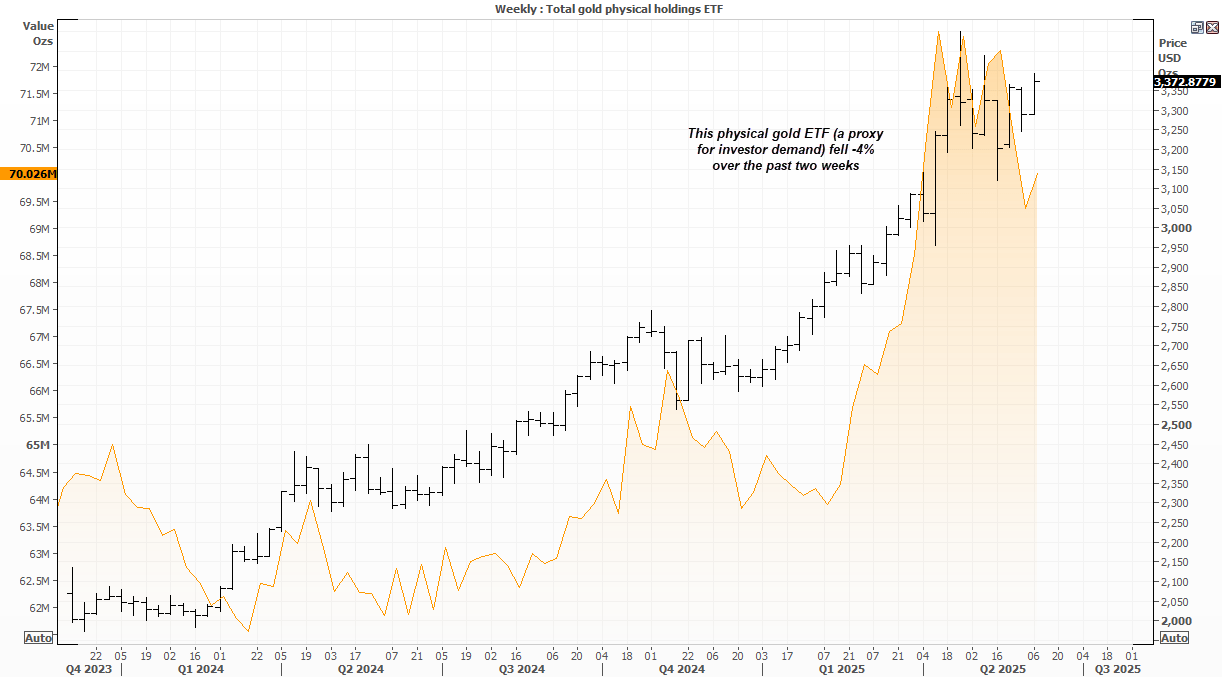
We should also factor in lower gold demand from investors, as reflected by the ‘Total Gold Physical Holdings ETF’. The ETF has fallen by 4% over the past two weeks, even as gold prices have continued to grind higher. While this may not be a compelling sell signal on its own, it does serve as a cautionary sign — a reminder not to assume a swift return to record highs.
Gold Futures (GC) Technical Analysis
Like most markets at present, gold finds itself in a holding pattern and at the whim of Trump's trade headlines — supported, yet hesitant to trade above this week's high. Volatility is also suppressed while we await comments from FOMC members and Friday's NFP report.
Trump wasted no time urging Powell to cut rates in light of the ADP payrolls, and that benefited gold on Wednesday. Though the ADP has a terrible track record of predicting NFP. If anything, it points to a stronger jobs change figure, which could weigh on gold.
It is unclear whether gold has completed a simple ABC correction — which would suggest we’re now in a wave iii move higher — or if this is the connecting ‘x’ wave of a double or triple zig-zag, implying at least one more ABC leg lower.
- Given the tendency for negative returns in June and the lower gold ETF, my bias is for the current rally to peter out and recycle lower.
- This therefore assumes a stronger US dollar and positive developments with Trump’s trade talks.
- If prices roll over beneath the May high (3475.6) then it is assumed that the ‘x’ wave has been seem an prices should in theory recycle lower as part of another ABC correction.
- A break above 3475.6 invalidates the ‘double zig-zag’ idea and assumes a break to new highs.
-- Written by Matt Simpson
Follow Matt on Twitter @cLeverEdge
How to trade with City Index
You can trade with City Index by following these four easy steps:
- Open an account, or log in if you’re already a customer
• Open an account in the UK
• Open an account in Australia
• Open an account in Singapore
- Search for the market you want to trade in our award-winning platform
- Choose your position and size, and your stop and limit levels
- Place the trade
Related tags:
Latest market news




Open an account in minutes
Experience award-winning platforms with fast and secure execution, and enjoy tight spreads from 0.5 pts on FX and 0.3 pts on indices.
Economic calendar
Web Trader platform
Our sophisticated web-based platform is packed with features.
Related articles
Euro Short-term Outlook: EUR/USD Rebound Faces Critical Test After Trend Break 10 21 2026
Euro bulls are struggling to extend the recovery from October lows, with a critical resistance barrier threatening to stall the advance.
Gold forecast: XAU/USD continues to coil as support holds again
Gold is being pulled in two directions by the same macro force: inflation. Persistent price pressures should, in theory, strengthen demand for the metal as a store of value. But if inflation proves sticky enough to keep central banks hawkish, the resulting rise in real and nominal yields makes gold less attractive at the margin.


Nasdaq 100 forecast: Stocks rebound ahead of more earnings
European indices recovered from a weaker start to turn positive by mid-morning trade, although US futures were still nursing small losses. Global indices were looking to add to their gains from the day before. Investors are weighing up encouraging earnings from SpaceX and Super Micro against elevated oil prices, which are limiting the upside for risk assets. We have more tech earnings coming up today which could shape the near-term Nasdaq 100 forecast.
This report is intended for general circulation only. It should not be construed as a recommendation, or an offer (or solicitation of an offer) to buy or sell any financial products. The information provided does not take into account your specific investment objectives, financial situation or particular needs. Before you act on any recommendation that may be contained in this report, independent advice ought to be sought from a financial adviser regarding the suitability of the investment product, taking into account your specific investment objectives, financial situation or particular needs.
StoneX Financial Pte. Ltd., may distribute reports produced by its respective foreign entities or affiliates within the StoneX group of companies or third parties pursuant to an arrangement under Regulation 32C of the Financial Advisers Regulations. Where the report is distributed to a person in Singapore who is not an accredited investor, expert investor or an institutional investor (as defined in the Securities Futures Act), StoneX Financial Pte. Ltd. accepts legal responsibility to such persons for the contents of the report only to the extent required by law. Singapore recipients should contact StoneX Financial Pte. Ltd. at 6826 9988 for matters arising from, or in connection with the report.
In the case of all other recipients of this report, to the extent permitted by applicable laws and regulations neither StoneX Financial Pte. Ltd. nor its associated companies will be responsible or liable for any loss or damage incurred arising out of, or in connection with, any use of the information contained in this report and all such liability is hereby expressly disclaimed. No representation or warranty is made, express or implied, that the content of this report is complete or accurate.
StoneX Financial Pte. Ltd. is not under any obligation to update this report.
Trading CFDs carries a high level of risk that may not be suitable for some investors. Consider your investment objectives, level of experience, financial resources, risk appetite and other relevant circumstances carefully. The possibility exists that you could lose some or all of your investments, including your initial deposits. If in doubt, please seek independent expert advice. Visit www.forex.com/en-sg/terms-and-policies for the complete Risk Disclosure Statement.