


USD/JPY, DAX Forecast: Two trades to watch
Will USD/JPY break out of its 2-month range? DAX nears record highs as oil prices fall to 2-month lows.
Share this:


Will USD/JPY break out of its 2-month range?
USD/JPY is rising after hot U.S. inflation and hawkish central bank comments raised the risk of an outsized hike from the Fed at its December meeting.
Data yesterday showed that U.S. inflation rose 0.4% month on month in October, ahead of the 0.3% expected, while core inflation (which removes more volatile items such as food and fuel) rose 0.3% in October, higher than the 0.2% forecast.
Prior to the release of the data, Federal Reserve Governor Christopher Waller had said that a higher-than-forecast reading of core inflation would prompt him to consider an outsized 50-basis-point hike at the upcoming December meeting.
Waller hasn't been the only Fed official leaning hawkish. Dallas Fed President Lorie Logan said two more rate rises were needed, while Chicago Fed President Austan Goolsbee warned about inflation.
Markets are pricing in a 25-basis-point hike in December and now a 10% probability of an outsized 50-basis-point hike. A total of three rate increases are fully priced in by the middle of next year.
We think the Fed is unlikely to hike by 50 basis points, but the hiking cycle could extend to a third hike in March 2027.
The repricing of rate expectations lifted the U.S. dollar against its major peers.
U.S. Treasury yields jumped, with the 2-year Treasury yield surging 18 basis points overnight, while the 10-year Treasury yield has climbed to 5%.
The Japanese yen is falling as markets unwind expectations around the Fed and BoJ rate paths. Attention is turning to the Tokyo producer price index for October, which is expected to have risen 0.3% month on month after declining at a similar pace in September.
USD/JPY forecast – technical analysis
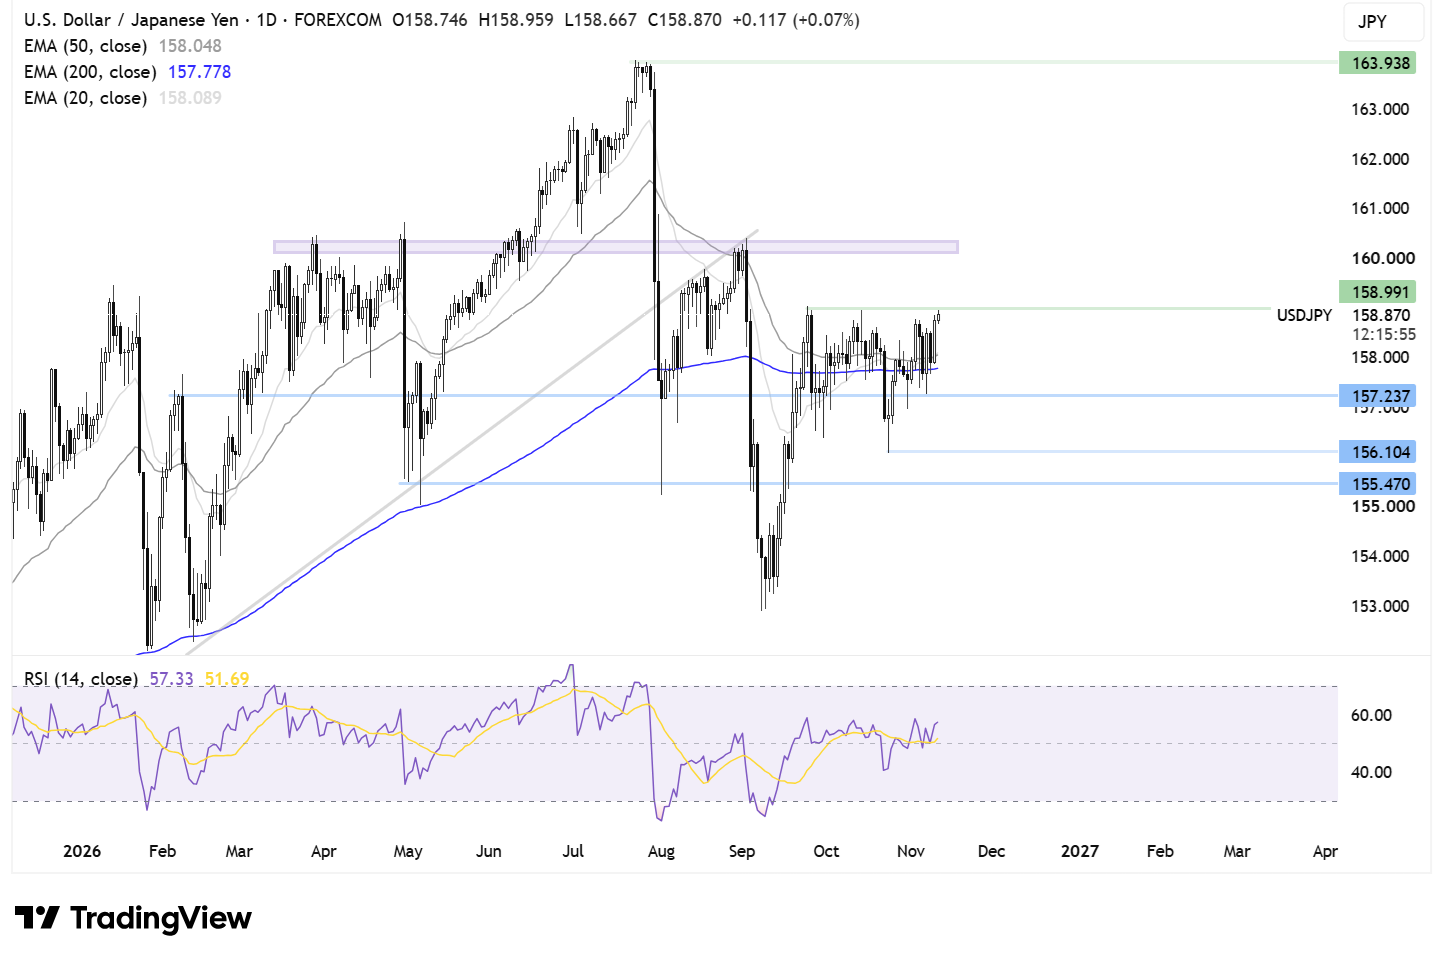
USD/JPY trades within a holding pattern dating back to 20 September. The price is supported at the bottom by 157.20 and capped on the upside by 159.
With momentum pointing higher, buyers will look to break above 159 to break out of the range, turning attention to the 160 resistance zone.
Failure to break out could see the price fall towards the 50 EMA at 158 and the 200 EMA at 157.75. It would take a break below 157.20 to trigger a downside breakout, turning attention towards 156.10, the October low, ahead of the 155.50 support zone.
DAX closes in on record highs as oil prices fall to 2-month lows
The DAX, together with its European peers, is holding up as softer oil prices ease inflation concerns and enthusiasm for the AI trade returns following CoreWeave's earnings and news surrounding Anthropic's upcoming IPO.
Oil prices have fallen to a two-month low on optimism that a Democrat-led Congress could mean a sooner end to the conflict in the Middle East, while President Trump has also sounded less hostile, saying he is prepared to give diplomacy a chance. Reports have also suggested that Middle Eastern oil shipments have nearly returned to pre-war levels despite ongoing attacks on vessels in the Strait of Hormuz.
Oil prices have fallen sharply, with Brent down 22% so far in November and WTI down 17% over the same period. This is helping to ease inflation concerns.
Meanwhile, rebounding optimism towards the AI trade is also supporting risk sentiment after solid third-quarter earnings from CoreWeave, the builder of AI data centres, eased concerns over the outlook for the AI trade.
Investors are also reacting positively to news that Anthropic is targeting a record-breaking IPO with a proposed valuation of $1.4 trillion.
DAX forecast – technical analysis
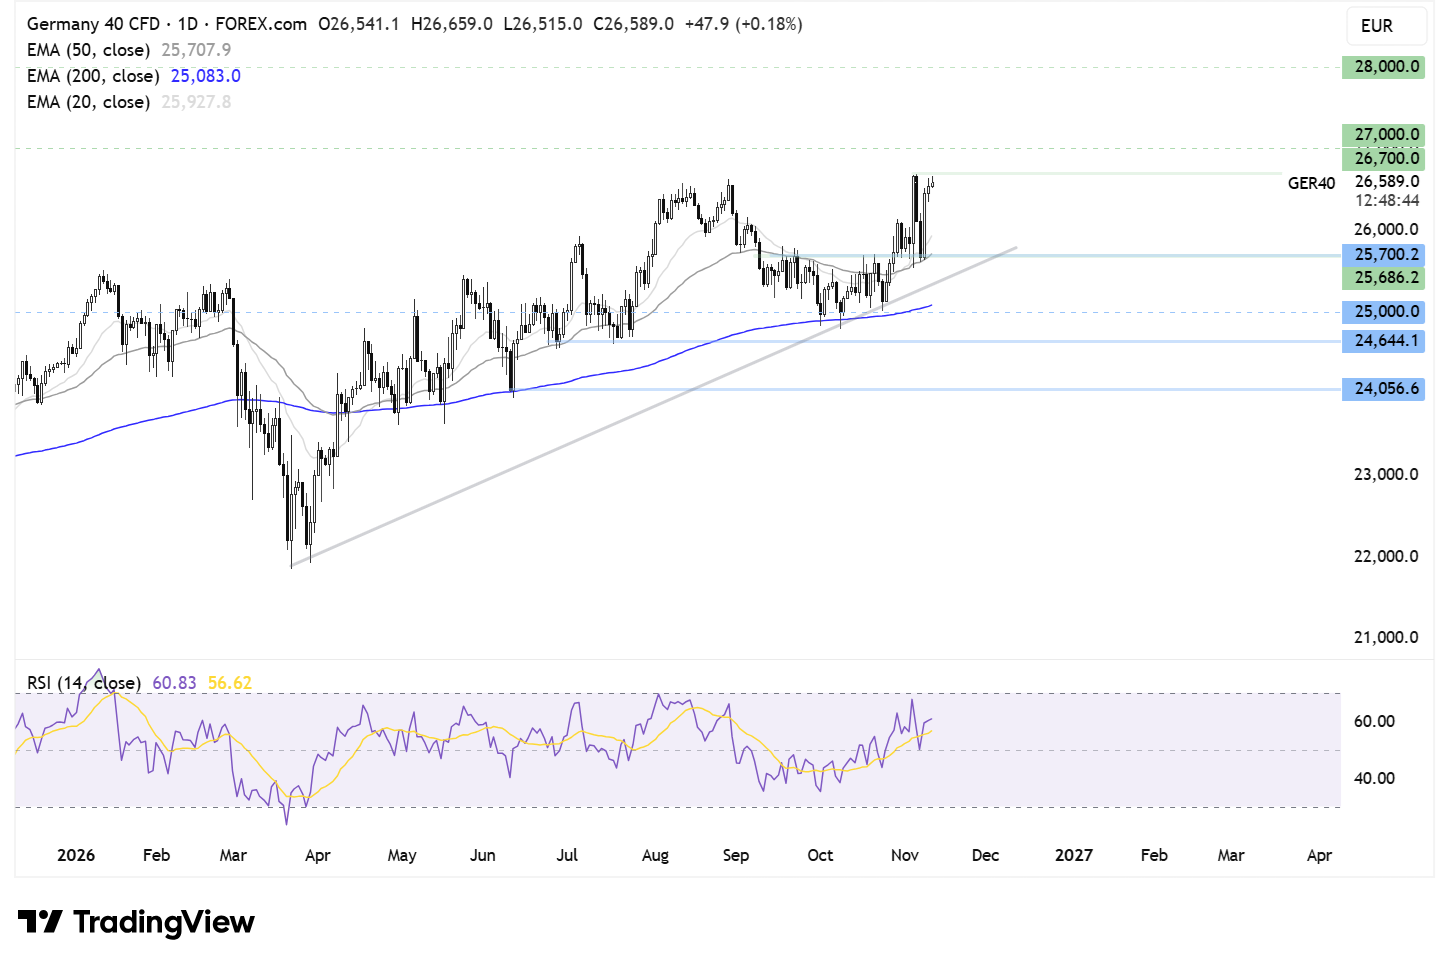
The DAX trades above its rising trend line, its 50 EMA and its 200 EMA, presenting a bullish picture. The price recently recovered from 25,700 support, around the 50 EMA, and has rebounded to 26,600, within a breath of its record high, just 60 points away.
Buyers, supported by the RSI above 50, will look to extend gains above 26,670 to refresh record levels, with 27,000 and 28,000 the next logical targets.
On the downside, support is seen at 26,700, the 50 EMA, with horizontal support also below here. The rising trend line comes into focus at 25,370, ahead of 25,000 horizontal support and the 200 EMA. Below here, sellers could gain traction towards 24,600, the July low.
Related tags:




Open an account in minutes
Experience award-winning platforms with fast and secure execution, and enjoy tight spreads from 0.5 pts on FX and 0.3 pts on indices.
Economic calendar
Web Trader platform
Our sophisticated web-based platform is packed with features.
Related articles

Japanese Yen Short-term Outlook: USD/JPY Breakout Hits 10-Week Highs—160 in Focus 11 11 2026
USD/JPY bulls need a decisive close above trend resistance to sustain the advance, with hotter U.S. inflation adding urgency to the test.


USD/JPY, DAX Forecast: Two trades to watch
Will USD/JPY break out of its 2-month range? DAX nears record highs as oil prices fall to 2-month lows.

USD/JPY, USD/CAD Outlook: Fed hawks put dollar bulls on alert
Hotter US inflation and hawkish Fed commentary have triggered a sharp repricing of interest rate expectations. USD/JPY and USD/CAD are in focus as the dollar's sensitivity to Fed policy strengthens.

This report is intended for general circulation only. It should not be construed as a recommendation, or an offer (or solicitation of an offer) to buy or sell any financial products. The information provided does not take into account your specific investment objectives, financial situation or particular needs. Before you act on any recommendation that may be contained in this report, independent advice ought to be sought from a financial adviser regarding the suitability of the investment product, taking into account your specific investment objectives, financial situation or particular needs.
StoneX Financial Pte. Ltd., may distribute reports produced by its respective foreign entities or affiliates within the StoneX group of companies or third parties pursuant to an arrangement under Regulation 32C of the Financial Advisers Regulations. Where the report is distributed to a person in Singapore who is not an accredited investor, expert investor or an institutional investor (as defined in the Securities Futures Act), StoneX Financial Pte. Ltd. accepts legal responsibility to such persons for the contents of the report only to the extent required by law. Singapore recipients should contact StoneX Financial Pte. Ltd. at 6826 9988 for matters arising from, or in connection with the report.
In the case of all other recipients of this report, to the extent permitted by applicable laws and regulations neither StoneX Financial Pte. Ltd. nor its associated companies will be responsible or liable for any loss or damage incurred arising out of, or in connection with, any use of the information contained in this report and all such liability is hereby expressly disclaimed. No representation or warranty is made, express or implied, that the content of this report is complete or accurate.
StoneX Financial Pte. Ltd. is not under any obligation to update this report.
Trading CFDs carries a high level of risk that may not be suitable for some investors. Consider your investment objectives, level of experience, financial resources, risk appetite and other relevant circumstances carefully. The possibility exists that you could lose some or all of your investments, including your initial deposits. If in doubt, please seek independent expert advice. Visit www.forex.com/en-sg/terms-and-policies for the complete Risk Disclosure Statement.