


USD/JPY Sinks to Familiar Support as Risk Off Fears Grow
Stocks are selling off in both the US and Japan and USD/JPY has started to show a degree of strain, with a pullback to a key support level even as USD-strength remains in-force elsewhere.
Share this:

USD/JPY Talking Points:
- USD/JPY has been in an ‘up the stairs, down the elevator’ pattern since the July FOMC and BoJ rate decisions.
- Interventions or threats of interventions have caused a hurried short-side move in the pair as a crowded trade led to a crowded exit.
- There’s reverberations of this elsewhere, as leverage brought upon by the carry trade helped to volley valuations in markets like AI stocks and with that trade coming under pressure, we might be seeing some unwind of hedges as a result or, or in anticipation of a larger de-leveraging event.
USD/JPY is at a familiar support level of 156.68, so right up front, this isn’t necessarily a doom-and-gloom scenario. Although given the backdrop and the context, there is some investigation in the other side of the argument that’s warranted. But, once of the better parts of price action is its objectivity, and until support gives way, bulls have an open door to make a push.
The 156.68 level was a quick swing low back in early-August, just after the first intervention-fueled sell-off. But, more than that, this price came in as resistance in early-September before showing multiple instances of support over the past month.
From the below chart, you can see that there hasn’t been a four-hour bar close below that price since the September 17th breakout, with multiple instances of underside wicks showing bullish support at that price.
USD/JPY Four-Hour Price Chart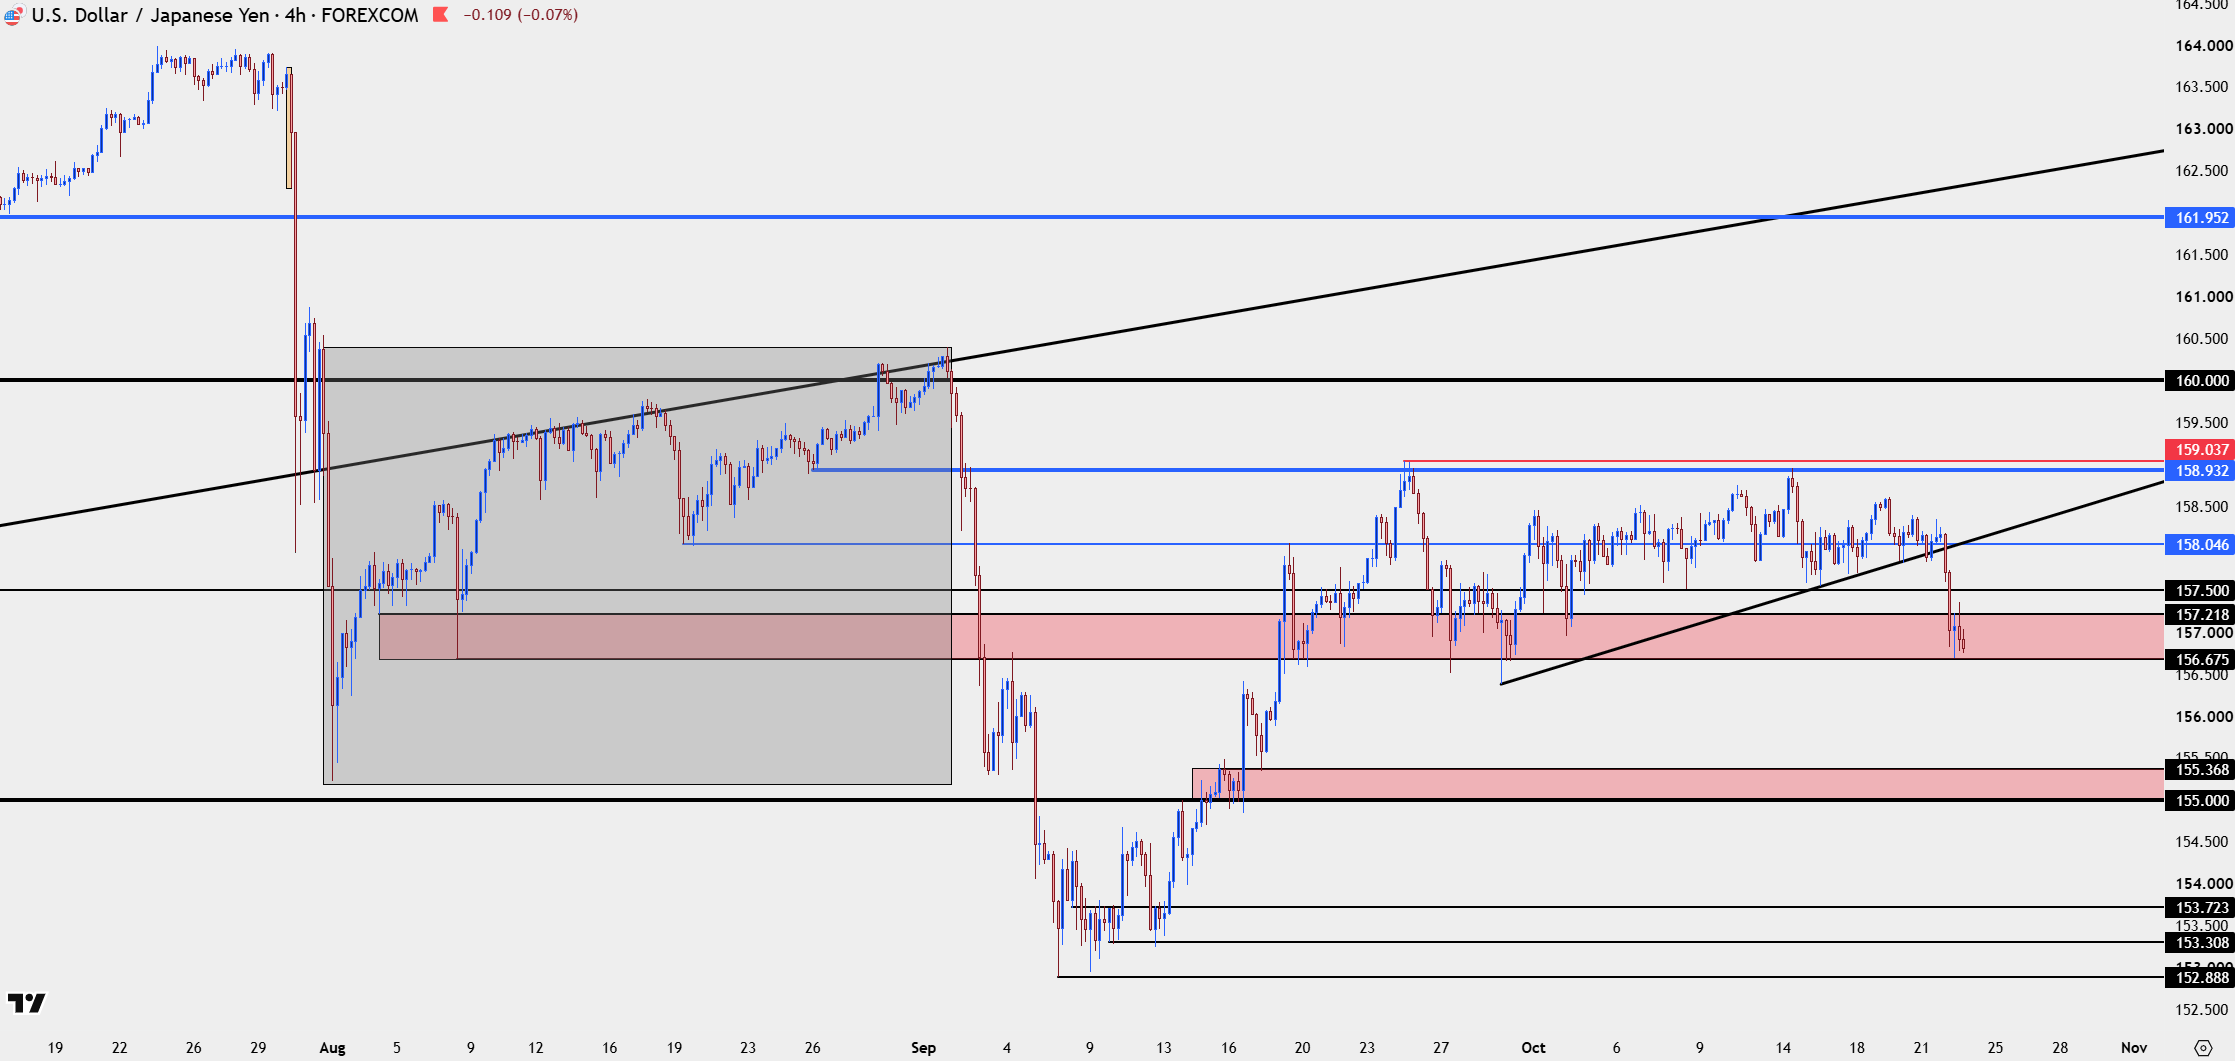
Chart prepared by James Stanley; data derived from Tradingview
USD/JPY: Fundamental Flow
At this point the fundamentals still favor the long side of the pair, with inflation and rate expectations higher in the US than in Japan. This is why the pair has been so persistently strong, even against the force of a dual intervention in July. The fact that this has broken down over the past day, especially considering the breakdown that’s been seen in stocks, is at least somewhat worrying.
As discussed before, the carry trade is essentially a form of global leverage. Institutions can go to Japan and borrow money cheaply and then invest elsewhere where rates (and growth) is higher and try to pocket the spread. The problem at that point is currency risk, because if the Yen weakens as much or more than the spread produces, well, the entire point of the trade is whittled away. So the logical thing to do is to hedge that risk, and that puts upward pressure on USD/JPY as institutional investors sell JPY to hedge the long JPY exposure from borrowing funds in Japan, and then offsets with another currency, such as the US Dollar.
As long as growth continues, there’s little reason for investors to remove those hedges. But, if we start to see fear creep in, that can change quickly. And given how crowded the carry trade is, that can lead to the ‘down the elevator’ dynamic that’s been commonplace for USD/JPY sell-offs over the past four years.
USD/JPY Weekly Chart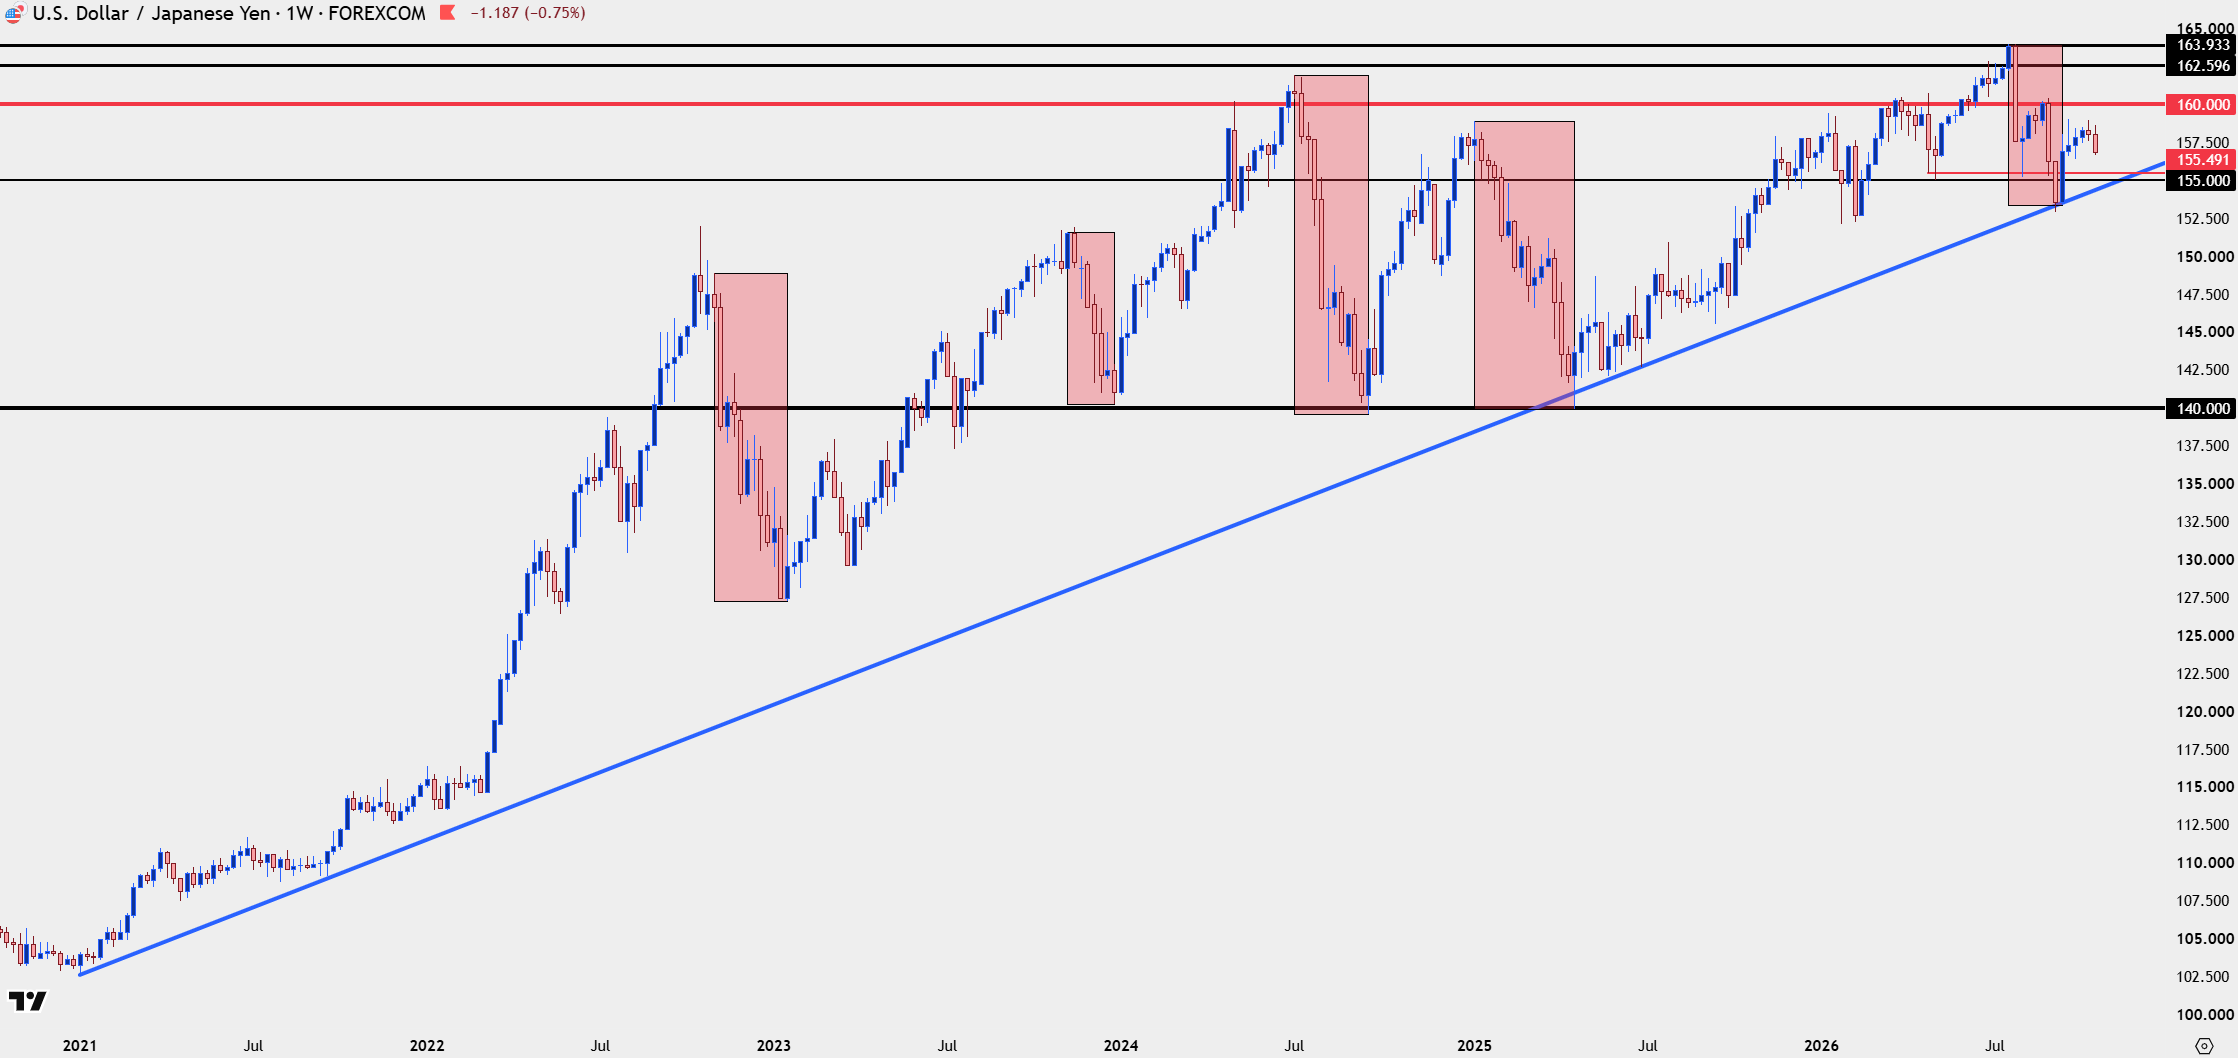
Chart prepared by James Stanley; data derived from Tradingview
What Could Trigger A Larger Sell-Off
Historically, it’s been slower US CPI that’s brought upon sell-offs in the pair, as fears of narrowing rate differentials have driven investors to close hedges. But – there’s also been a case of equity weakness driving USD/JPY sell-offs, as well, such as what we saw back in July of 2024.
Pardoxically, this happened as markets were pricing in US rate cuts. But, with the massive source of leverage coming under pressure in USD/JPY, there was spill-over, to the point that stocks sold aggressively after the July 2024 US CPI release, leading to the third highest ever spike in the VIX index.
Ultimately, cooler heads prevailed and USD/JPY held support just above 140.00 two days before the Fed cut rates in September. But, putting the pieces together for our current backdrop, where the fundamental divergence remains in place for the US and Japan, the fact that the pair hasn’t yet recovered more brings the possibility that, perhaps, the equity weakness that’s become more and more difficult to ignore, both in Asia (Japan and Korea, specifically) and in US tech stocks, may be causing unwind of hedges from the carry trade, that helped to fuel the leverage that built those rallies to such extremes.
Again, this is an early observation, and USD/JPY still has a claim to bullish structure, but traders should be aware of the other side of the argument in the event that we are on the cusp of ‘something new’ showing across macro markets.
Nikkei Futures, Weekly Chart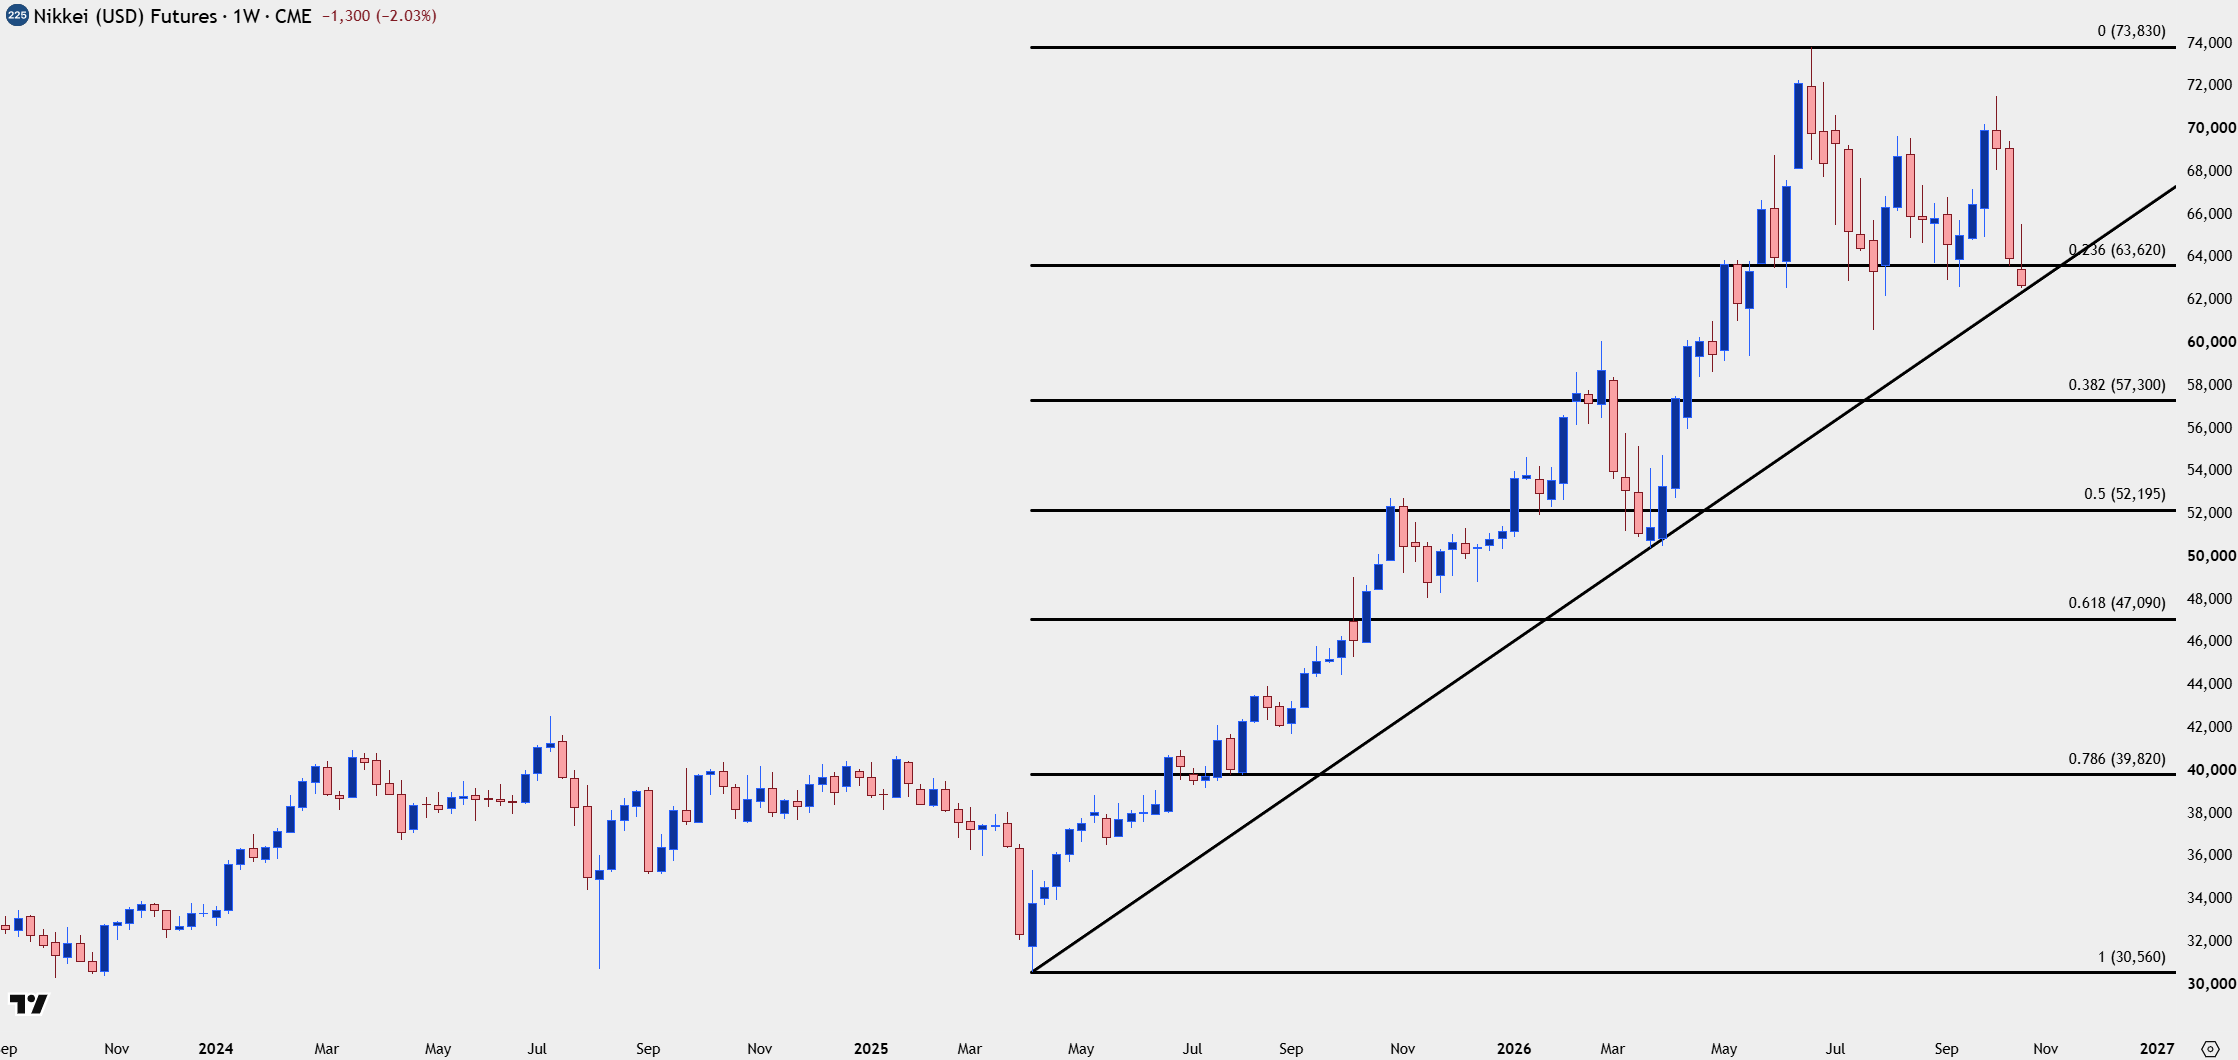
Chart prepared by James Stanley; data derived from Tradingview
--- written by James Stanley, Senior Market Analyst, Global Macro
Related tags:
Latest market news




Open an account in minutes
Experience award-winning platforms with fast and secure execution, and enjoy tight spreads from 0.5 pts on FX and 0.3 pts on indices.
Economic calendar
Web Trader platform
Our sophisticated web-based platform is packed with features.
Related articles
USD/JPY Sinks to Familiar Support as Risk Off Fears Grow
Stocks are selling off in both the US and Japan and USD/JPY has started to show a degree of strain, with a pullback to a key support level even as USD-strength remains in-force elsewhere.
EUR/USD Tries to Turn, Stumbles So Far
Both US Dollar strength and EUR/USD weakness were looking long-in-the-tooth last week, and the initial semblance of reversal started to show. But kicking into a new trend has been harder than imagined so far.

British Pound Rallies to Monthly High Against the USD
It’s been a fast week for GBP/USD, with the pair pulling back to a major support level last Wednesday followed by a strong reversal that’s set fresh monthly highs.
This report is intended for general circulation only. It should not be construed as a recommendation, or an offer (or solicitation of an offer) to buy or sell any financial products. The information provided does not take into account your specific investment objectives, financial situation or particular needs. Before you act on any recommendation that may be contained in this report, independent advice ought to be sought from a financial adviser regarding the suitability of the investment product, taking into account your specific investment objectives, financial situation or particular needs.
StoneX Financial Pte. Ltd., may distribute reports produced by its respective foreign entities or affiliates within the StoneX group of companies or third parties pursuant to an arrangement under Regulation 32C of the Financial Advisers Regulations. Where the report is distributed to a person in Singapore who is not an accredited investor, expert investor or an institutional investor (as defined in the Securities Futures Act), StoneX Financial Pte. Ltd. accepts legal responsibility to such persons for the contents of the report only to the extent required by law. Singapore recipients should contact StoneX Financial Pte. Ltd. at 6826 9988 for matters arising from, or in connection with the report.
In the case of all other recipients of this report, to the extent permitted by applicable laws and regulations neither StoneX Financial Pte. Ltd. nor its associated companies will be responsible or liable for any loss or damage incurred arising out of, or in connection with, any use of the information contained in this report and all such liability is hereby expressly disclaimed. No representation or warranty is made, express or implied, that the content of this report is complete or accurate.
StoneX Financial Pte. Ltd. is not under any obligation to update this report.
Trading CFDs carries a high level of risk that may not be suitable for some investors. Consider your investment objectives, level of experience, financial resources, risk appetite and other relevant circumstances carefully. The possibility exists that you could lose some or all of your investments, including your initial deposits. If in doubt, please seek independent expert advice. Visit www.forex.com/en-sg/terms-and-policies for the complete Risk Disclosure Statement.