








USD/JPY, USD/CHF Rise for 2nd Day, Market Forces Lend SNB a Hand
Trade optimism send the US dollar higher for a second day, and sending demand for the Japanese yen and Swiss franc lower. This bodes well for my bullish outlook for USD/JPY and USD/CHF.
Share this:

The US dollar rose for a second day on Wednesday on trade optimism, after Trump said that China’s tariffs could be much lower. That US Treasury Secretary Scott Bessent had already said that that tensions with China could de-escalate soon means Trump’s late-night concession likely carries more weight.
View related analysis:
- Tentative Signs of a US Dollar Rebound Ahead of Powell speech
- Japanese Yen Analysis: USD/JPY, CAD/JPY, AUD/JPY Price Action Setups
- USD/CHF Hurled Overboard, Swiss Franc, Gold Remain Supreme
- AUD/USD Rebound Stalls Near 64c, 200-day EMA; PMIs In Focus
View related analysis:
- Tentative Signs of a US Dollar Rebound Ahead of Powell speech
- Japanese Yen Analysis: USD/JPY, CAD/JPY, AUD/JPY Price Action Setups
- USD/CHF Hurled Overboard, Swiss Franc, Gold Remain Supreme
- AUD/USD Rebound Stalls Near 64c, 200-day EMA; PMIs In Focus
- The US dollar rose 0.9% during its best day in twelve, pulling the euro (EUR/USD) down to a six-day low, and second beneath the 1.14 handle.
- The question now is whether the US dollar index can break above 100 to mark the beginning of a meaningful rebound for USD.
- The Australian dollar (AUD/USD) continued to meander around its 200-day EMA and 64c level, though an inverted hammer candle suggests a hesitancy remains among bulls to break above key resistance levels.
- The Swiss franc (USD/CHF) rose for a second day, marking its best 2-day run since March 2020
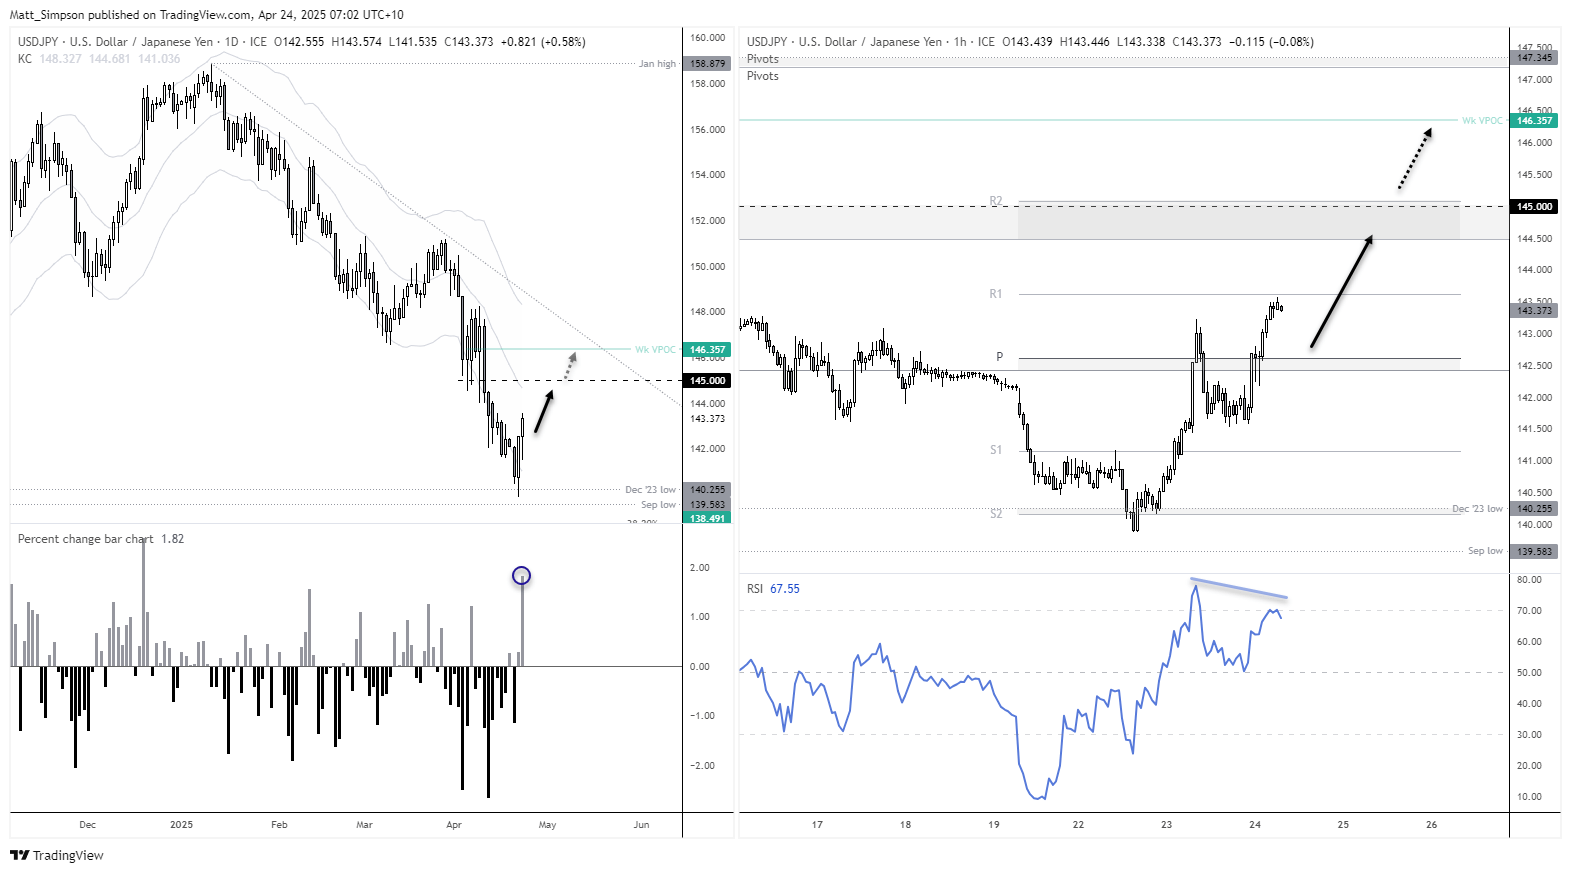
- The Japanese yen (USD/JPY) rose nearly 2% and rose for a second day, to mark its best 2-day run since December
A Higher USD/CHF Plays Nicely with the Swiss National Bank (SNB)
On 10 April I questioned whether the SNB would be forced to intervene in the currency market to support the surging Swiss franc (CHF). Not only had the franc risen over 14% against the dollar since the January low, but the extreme levels of volatility on the day forced USD/CHF below 0.92 – a level some had previously suggested was an intervention threshold for the SNB to support the franc.
10 April was also the fourth most bearish day on record at -4%, and the eighth most volatile, with a daily range of 4.2%. Curiously, there has been no apparent intervention from the central bank, though they have spoken about the potential for negative rates in an attempt to jawbone the franc. And if the US dollar continues to strengthen, as I suspect, this should reduce the need for the SNB to act, as USD/CHF should flourish.
Swiss Franc (USD/CHF) Technical Analysis
USD/CHF fell to its lowest level since the infamous day on 15 January, when the SNB removed the Swiss franc’s peg to the euro. USD/CHF printed an important low on Monday, just 41 pips shy of the 0.80 level, though Tuesday’s bullish engulfing candle strongly hinted at a swing low. The strength of the US dollar helped USD/CHF climb for a second consecutive day, though resistance looms nearby.
The daily chart suggests that USD/CHF could be a day or two's trade away from reaching 0.84, based on recent standards of volatility. However, with the 2023 low (0.8327) and 2024 low (0.8375) nearby, we may find that volatility recedes somewhat as USD/CHF approaches the 0.84 level.
Given the extended sell-off in the US dollar and the continued strength of the Swiss franc in recent weeks, USD/CHF remains vulnerable to a decent move higher should tariffs be significantly reduced for China. I therefore favour an initial move towards 0.84, followed by a minor pullback, ahead of a secondary move towards the 0.8565 VPOC, just beneath the 0.8600 handle.
Japanese Yen (USD/JPY) Technical Analysis
USD/JPY rose for a second day, in line with my bullish bias outlined in yesterday’s article. 145 remains the interim upside target, a break above which brings the 146 handle into focus near trend resistance and the 146.36 VPOC (volume point of control).
The 1-hour chart shows that the daily high for USD/JPY met resistance at the weekly R1 pivot (143.6), which, when coupled with the bearish RSI (14) divergence, could suggest a pullback is due before the trend resumes. Bulls could seek dips towards the 142.50 area, near the weekly pivot point (142.62) and monthly S3 pivot (142.33). Note the monthly S2 pivot at 144.45 and weekly R2 pivot at 145.07, which make potential interim targets for bulls.
Economic events in focus (AEDT)
- 09:50 – Japanese corporate services price index, foreigner bond and stock purchases
- 11:30 – RBA bulletin
- 13:35 – Japanese 2-year JGB auction
- 18:00 – German Ifo business climate
- 19:00 – UK 20-year gilt auction
- 22:30 – US jobless claims, Chicago Fed National Activity Index, durable goods orders
-- Written by Matt Simpson
Follow Matt on Twitter @cLeverEdge
How to trade with City Index
You can trade with City Index by following these four easy steps:
- Open an account, or log in if you’re already a customer
• Open an account in the UK
• Open an account in Australia
• Open an account in Singapore
- Search for the market you want to trade in our award-winning platform
- Choose your position and size, and your stop and limit levels
- Place the trade
Related tags:



Open an account in minutes
Experience award-winning platforms with fast and secure execution, and enjoy tight spreads from 0.5 pts on FX and 0.3 pts on indices.
Economic calendar
Web Trader platform
Our sophisticated web-based platform is packed with features.
Related articles
Australian Dollar Outlook: AUD/USD Screams Sentiment Extreme Into Fed, CPI
AUD/USD rebounds despite record bearish futures positioning, with Australian Q3 CPI and the Fed meeting threatening to trigger another short squeeze.

EUR/USD weekly outlook: FOMC and ECB to set the tone
The current backdrop is modestly bearish. On Friday, the EUR/USD closed modestly lower, down for the third consecutive day. The pair also posted a weekly decline after staging a modest recovery attempt in the previous week. Out of the past 8 weeks, the EUR/USD has fallen on 6 occasions. There is not much supporting factors for the single currency right now. So, the upside remains capped.


USD/JPY Weekly Outlook: AI earnings could overshadow the Fed and BoJ
AI sentiment has become a major driver of US Treasury yields and USD/JPY. With Microsoft, Alphabet and Amazon reporting this week, central bank decisions may have competition for traders' attention.

This report is intended for general circulation only. It should not be construed as a recommendation, or an offer (or solicitation of an offer) to buy or sell any financial products. The information provided does not take into account your specific investment objectives, financial situation or particular needs. Before you act on any recommendation that may be contained in this report, independent advice ought to be sought from a financial adviser regarding the suitability of the investment product, taking into account your specific investment objectives, financial situation or particular needs.
StoneX Financial Pte. Ltd., may distribute reports produced by its respective foreign entities or affiliates within the StoneX group of companies or third parties pursuant to an arrangement under Regulation 32C of the Financial Advisers Regulations. Where the report is distributed to a person in Singapore who is not an accredited investor, expert investor or an institutional investor (as defined in the Securities Futures Act), StoneX Financial Pte. Ltd. accepts legal responsibility to such persons for the contents of the report only to the extent required by law. Singapore recipients should contact StoneX Financial Pte. Ltd. at 6826 9988 for matters arising from, or in connection with the report.
In the case of all other recipients of this report, to the extent permitted by applicable laws and regulations neither StoneX Financial Pte. Ltd. nor its associated companies will be responsible or liable for any loss or damage incurred arising out of, or in connection with, any use of the information contained in this report and all such liability is hereby expressly disclaimed. No representation or warranty is made, express or implied, that the content of this report is complete or accurate.
StoneX Financial Pte. Ltd. is not under any obligation to update this report.
Trading CFDs carries a high level of risk that may not be suitable for some investors. Consider your investment objectives, level of experience, financial resources, risk appetite and other relevant circumstances carefully. The possibility exists that you could lose some or all of your investments, including your initial deposits. If in doubt, please seek independent expert advice. Visit www.forex.com/en-sg/terms-and-policies for the complete Risk Disclosure Statement.