








Japanese Yen Analysis: USD/JPY, CAD/JPY, AUD/JPY Price Action Setups
USD/JPY has fallen around 12% from its January high, but with several key levels of support nearby I am inclined to suspect this phase of the decline is much closer to the end than the beginning. CAD/JPY has formed a double bottom around a key support level, and AUD/JPY looks set to extend gains (over the near term).
Share this:

Last week I outlined a case for a low on the US dollar to form. While it did not nail the exact low, recent developments are shifting in favour of one forming. President Trump stated on Tuesday that he has no plans to fire Fed Chair Jerome Powell. Trump's apparent U-turn must come as a relief to Powell, which has helped support the US dollar on bets he won't be replaced with someone more dovish. But trade is the bigger story here - as how tariffs play out will dictate where the US economy, and therefore US interest rates, are headed.
And if US Treasury Secretary Bessent is correct in thinking that trade tensions with China are to recede, it could prompt prove to be the trigger that USD bulls were looking for. And that could bode well for a potential long setup on USD/JPY.
View related analysis:
- AUD/USD Rebound Stalls Near 64c, 200-day EMA; PMIs In Focus
- 2025 could be one heck of a ride if bearish AUD/JPY clues are correct
- Tentative Signs of a US Dollar Rebound Ahead of Powell speech
View related analysis:
- AUD/USD Rebound Stalls Near 64c, 200-day EMA; PMIs In Focus
- 2025 could be one heck of a ride if bearish AUD/JPY clues are correct
- Tentative Signs of a US Dollar Rebound Ahead of Powell speech
Japanese Yen Technical Analysis (USD/JPY): Weekly Charts
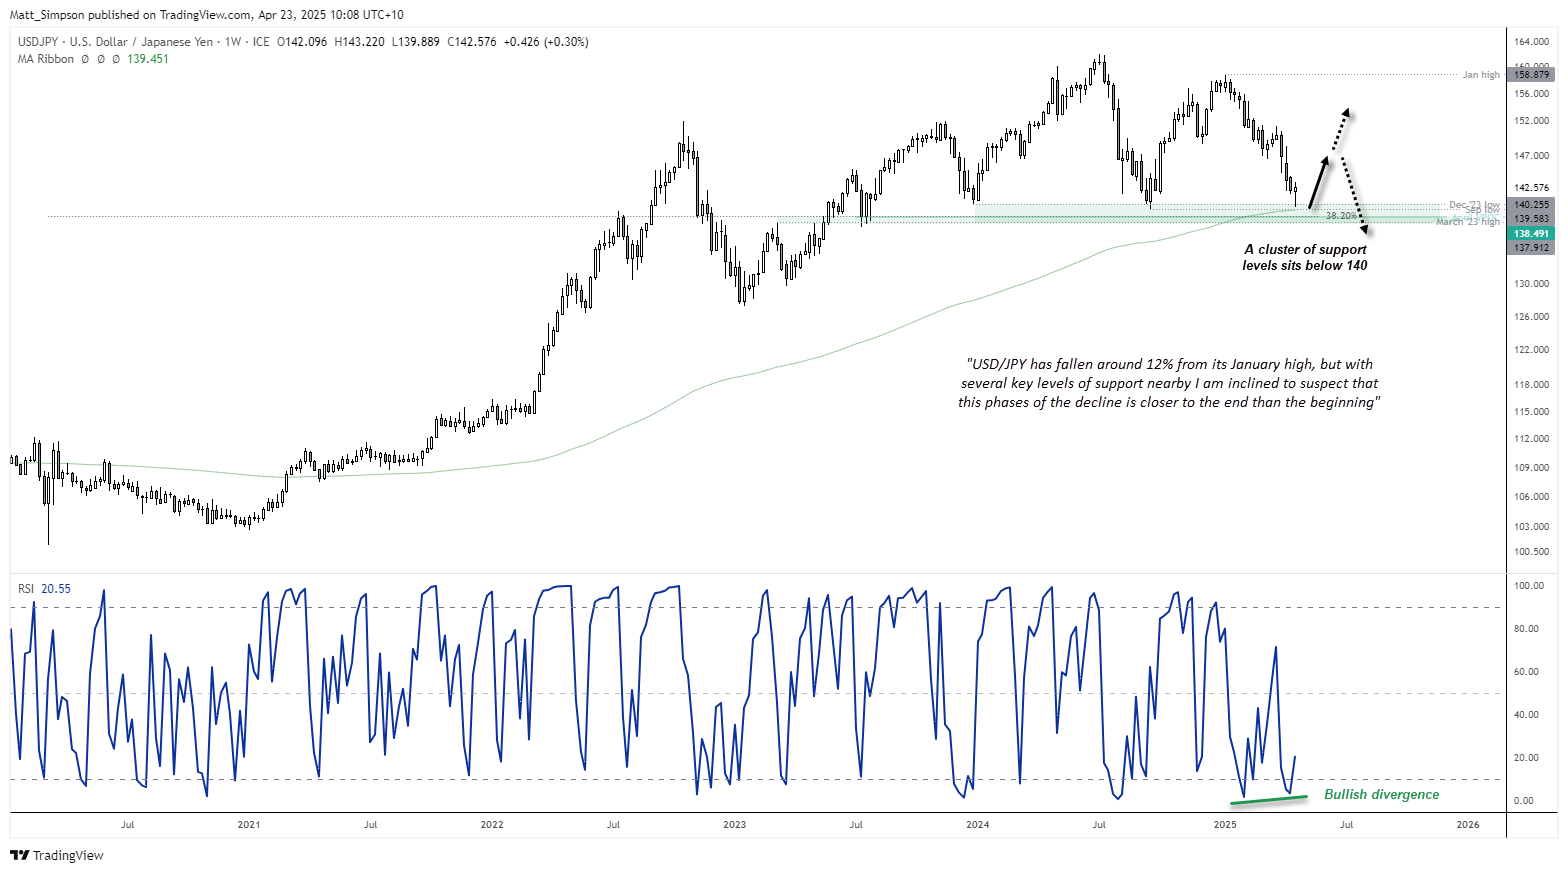
USD/JPY has fallen around 12% from its January high, but with several key levels of support nearby I am inclined to suspect this phase of the decline is much closer to the end than the beginning. The weekly RSI (2) formed a bullish divergence in the oversold zone last week, and this week’s low has heled above the 200-week EMA and September low. If prices were to close the week around current levels, a bullish pinbar / hammer would also form.
Japanese Yen (USD/JPY): Daily Chart
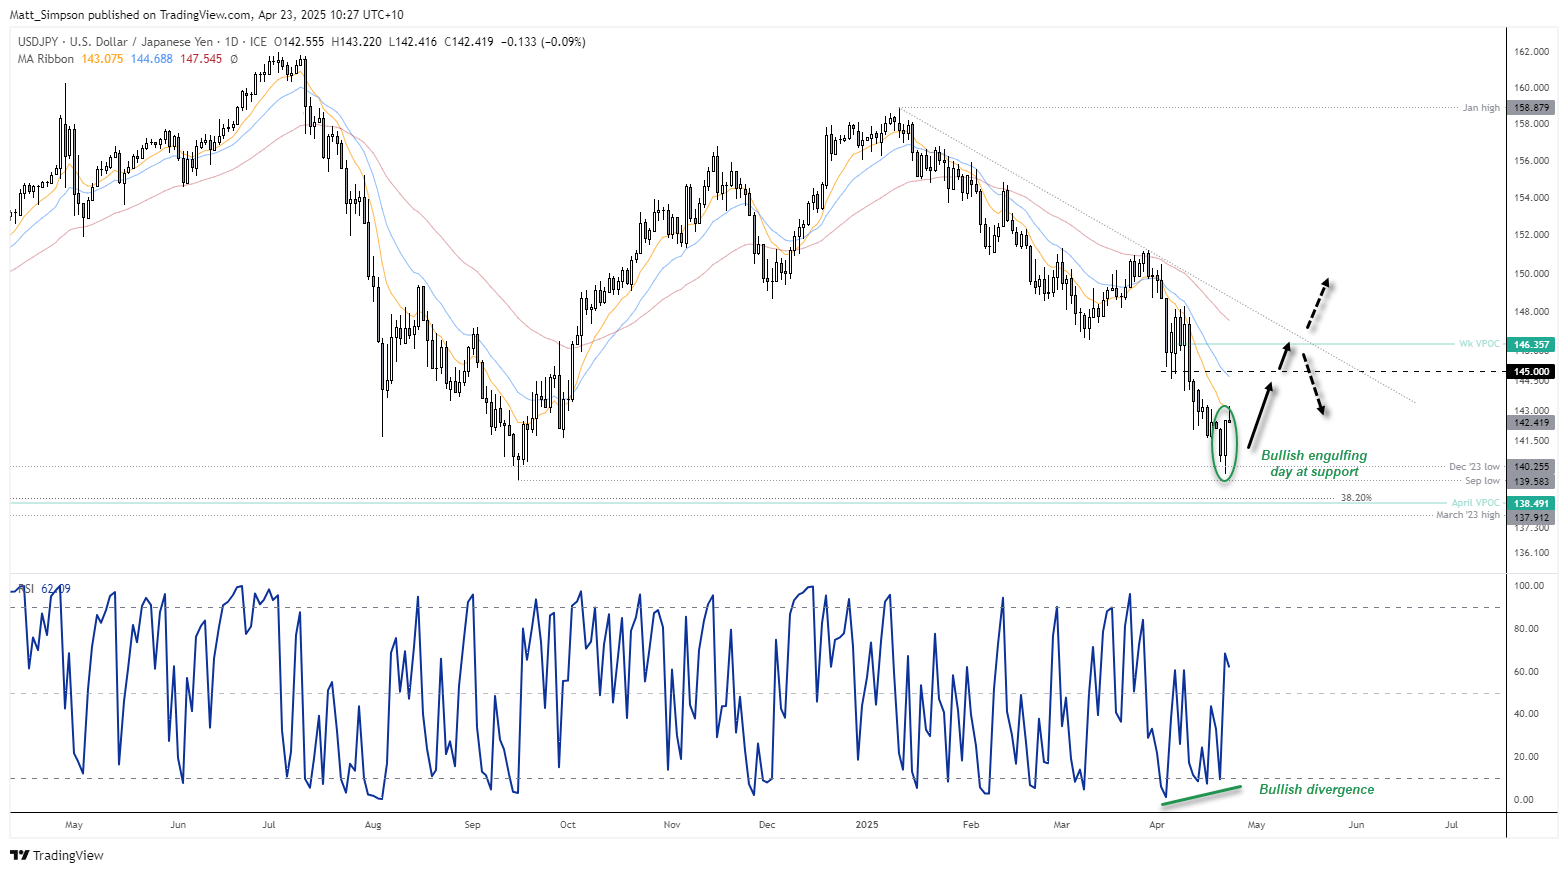
The daily chart shows that USD/JPY formed a bullish engulfing candle on Monday, following its false break of the December 2023 low earlier in the day. Prices have continued higher early in the Asian session, although the 10-day EMA is capping as resistance.
Bulls could seek dips within yesterday’s range in anticipation of a move towards the 20-day EMA, near the 145 handle. But traders should also take note that the prior correction which began on March 11 say prices mean revert to the 50-day EMA before its next leg lower from 151.20. Should prices retrace again to the 50-day EMA, a move up to 147.57 could be on the cards.
Personally, I suspect the weekly VPOC (volume point of control) at 146.35 and the bearish trendline make likely resistance areas for bears to target over the near term.
Canadian Dollar, Japanese Yen Technical Analysis (CAD/JPY)
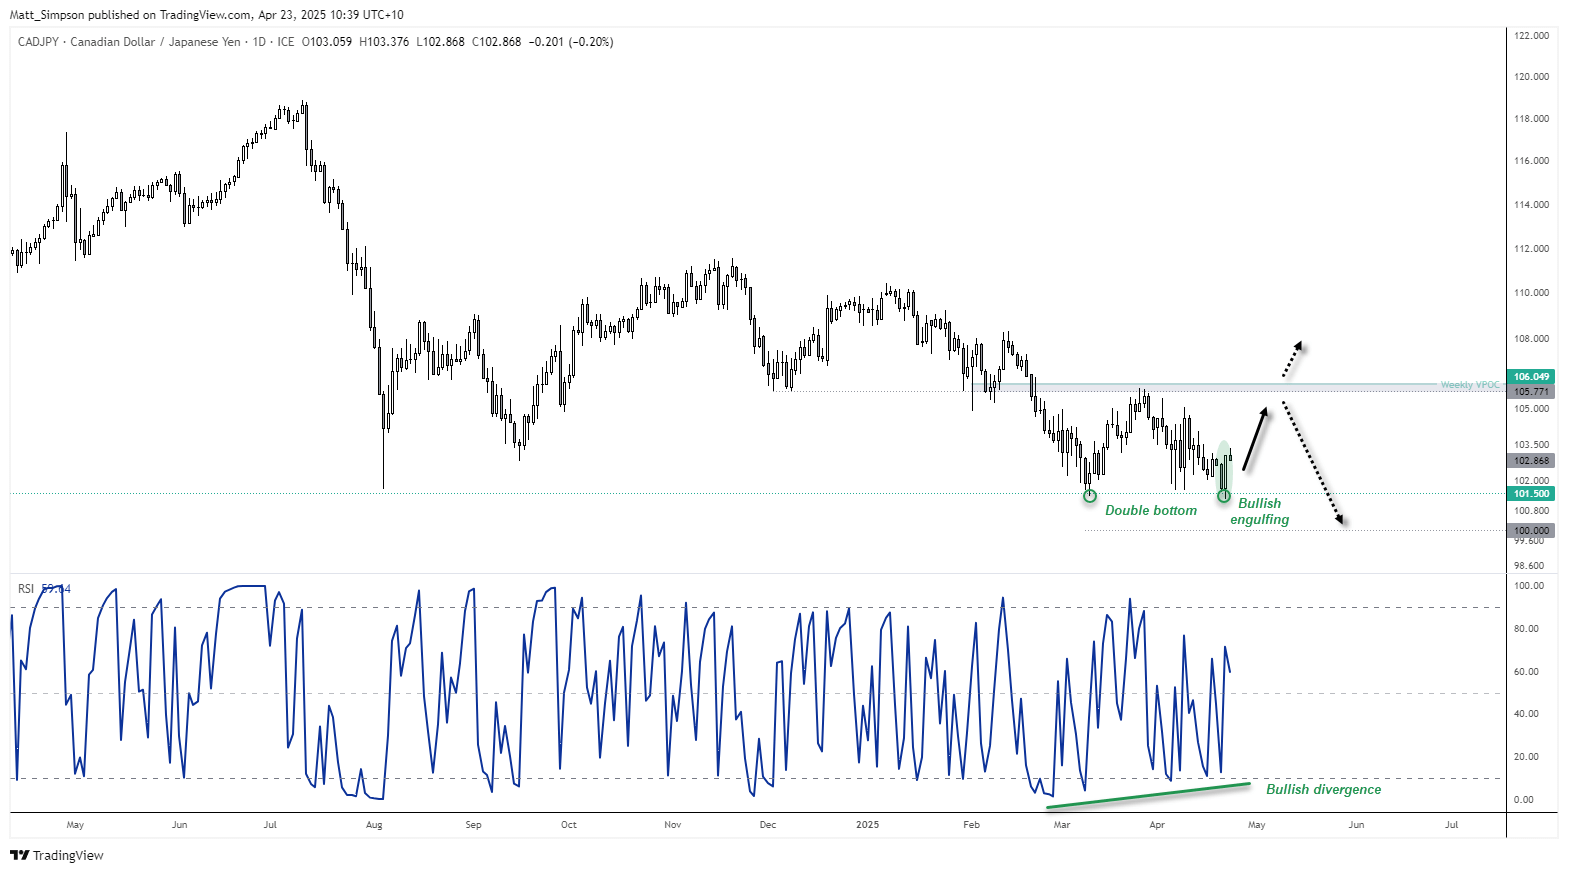
There have been multiple instances since August 2022 that the 101.50 area has provided support for CAD/JPY. So it is interest to see that CAD/JPY respected that level of support again on Tuesday, following a false, intraday break beneath it. A bullish engulfing day also formed to suggest a swing low has arrived, following a multi-week bullish divergence on the daily RSI (2). It could also mark a double bottom around the historical support level of 101.50.
I am not seeking for an over-sized bonce on CAD/JPY at this stage, especially with Canada’s Federal election looming. But perhaps it could muster up the energy for a move to 105 or even 106, which has proven to be a pivotal level since December.
Beyond that, should we re-enter a phase of risk-off which drags commodity currencies such as the Canadian dollar lower, a break beneath Tuesday’s low assumes a move to 100.
Australian Dollar, Japanese Yen Technical Analysis (AUD/JPY)
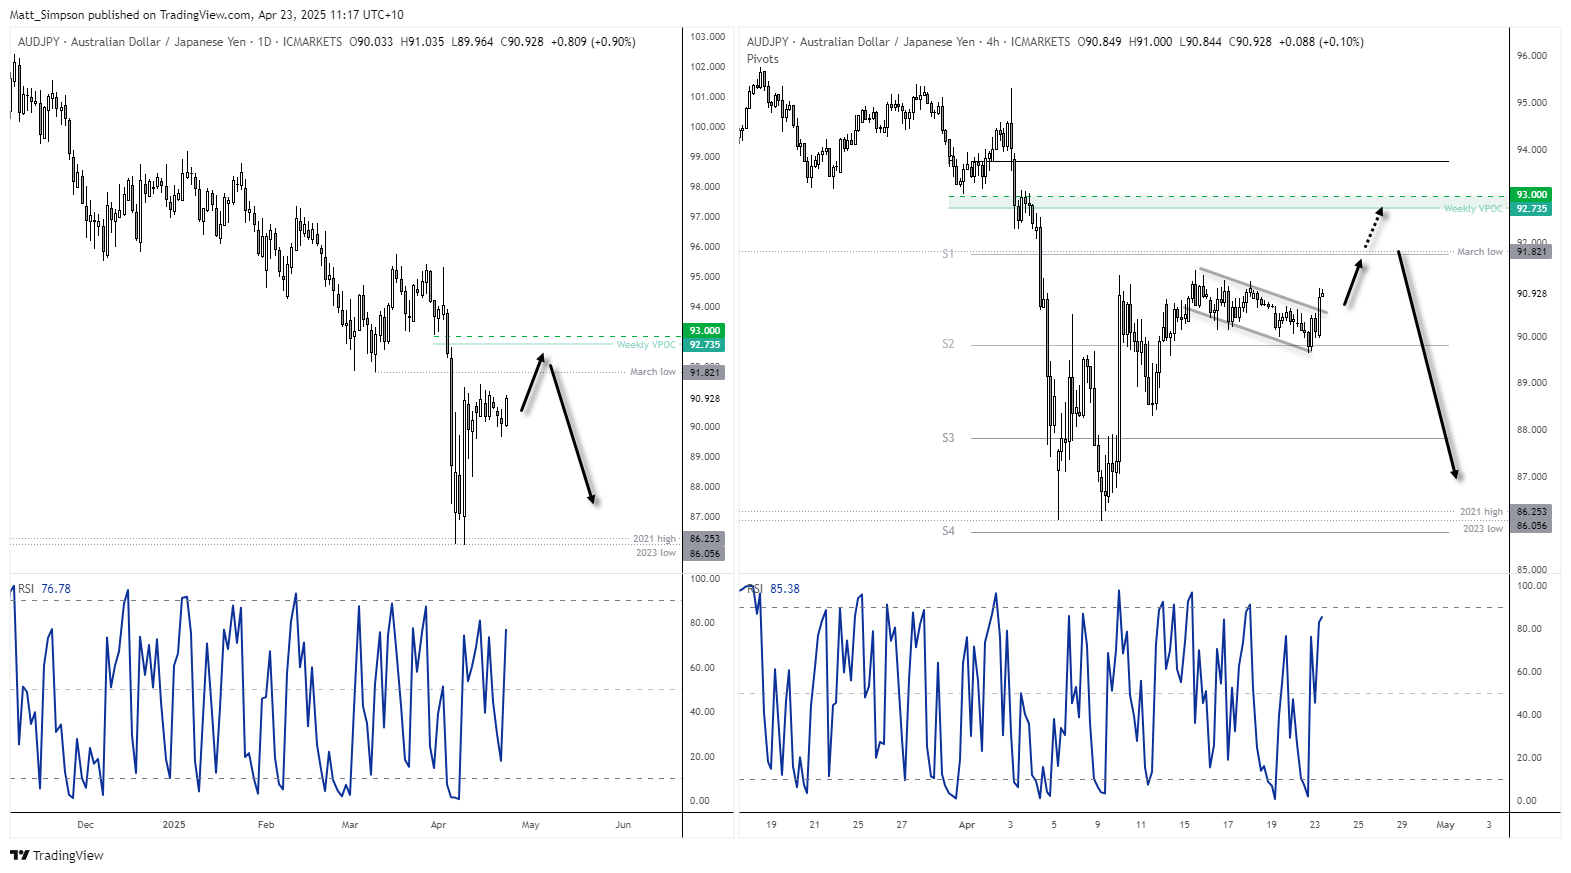
The daily trend structure on AUD/JPY is much mor bearish than that of CAD/JPY, which is why I suspect any bounce on the former may be outpaced by the latter. But this also ties in with my hunch that AUD/USD could be due a retracement lower, given I am also looking for a semi-decent bounce on USD/JPY.
AUD/JPY is already up 1% during the first half of Asian trade, which places it on track for snap a 3-day bearish streak. A move to at least the March low (91.82) could now be on the cards, or perhaps the weekly VPOC (92.73) at a stretch, just below the 93 handle. However, should these near-term bullish targets be met, I will also be on the lookout for a potential swing high to form.
-- Written by Matt Simpson
Follow Matt on Twitter @cLeverEdge
How to trade with City Index
You can trade with City Index by following these four easy steps:
- Open an account, or log in if you’re already a customer
• Open an account in the UK
• Open an account in Australia
• Open an account in Singapore
- Search for the market you want to trade in our award-winning platform
- Choose your position and size, and your stop and limit levels
- Place the trade
Related tags:



Open an account in minutes
Experience award-winning platforms with fast and secure execution, and enjoy tight spreads from 0.5 pts on FX and 0.3 pts on indices.
Economic calendar
Web Trader platform
Our sophisticated web-based platform is packed with features.
Related articles
Australian Dollar Outlook: AUD/USD Screams Sentiment Extreme Into Fed, CPI
AUD/USD rebounds despite record bearish futures positioning, with Australian Q3 CPI and the Fed meeting threatening to trigger another short squeeze.

EUR/USD weekly outlook: FOMC and ECB to set the tone
The current backdrop is modestly bearish. On Friday, the EUR/USD closed modestly lower, down for the third consecutive day. The pair also posted a weekly decline after staging a modest recovery attempt in the previous week. Out of the past 8 weeks, the EUR/USD has fallen on 6 occasions. There is not much supporting factors for the single currency right now. So, the upside remains capped.


USD/JPY Weekly Outlook: AI earnings could overshadow the Fed and BoJ
AI sentiment has become a major driver of US Treasury yields and USD/JPY. With Microsoft, Alphabet and Amazon reporting this week, central bank decisions may have competition for traders' attention.

This report is intended for general circulation only. It should not be construed as a recommendation, or an offer (or solicitation of an offer) to buy or sell any financial products. The information provided does not take into account your specific investment objectives, financial situation or particular needs. Before you act on any recommendation that may be contained in this report, independent advice ought to be sought from a financial adviser regarding the suitability of the investment product, taking into account your specific investment objectives, financial situation or particular needs.
StoneX Financial Pte. Ltd., may distribute reports produced by its respective foreign entities or affiliates within the StoneX group of companies or third parties pursuant to an arrangement under Regulation 32C of the Financial Advisers Regulations. Where the report is distributed to a person in Singapore who is not an accredited investor, expert investor or an institutional investor (as defined in the Securities Futures Act), StoneX Financial Pte. Ltd. accepts legal responsibility to such persons for the contents of the report only to the extent required by law. Singapore recipients should contact StoneX Financial Pte. Ltd. at 6826 9988 for matters arising from, or in connection with the report.
In the case of all other recipients of this report, to the extent permitted by applicable laws and regulations neither StoneX Financial Pte. Ltd. nor its associated companies will be responsible or liable for any loss or damage incurred arising out of, or in connection with, any use of the information contained in this report and all such liability is hereby expressly disclaimed. No representation or warranty is made, express or implied, that the content of this report is complete or accurate.
StoneX Financial Pte. Ltd. is not under any obligation to update this report.
Trading CFDs carries a high level of risk that may not be suitable for some investors. Consider your investment objectives, level of experience, financial resources, risk appetite and other relevant circumstances carefully. The possibility exists that you could lose some or all of your investments, including your initial deposits. If in doubt, please seek independent expert advice. Visit www.forex.com/en-sg/terms-and-policies for the complete Risk Disclosure Statement.