





usdjpy showing potential bearish exhaustion signs ahead of jackson hole 1828272016
<p>The recent one month decline seen in the USD/JPY has lead the pair back to the key long-term support zone of 100.70/99.00 which is not […]</p>
Share this:

The recent one month decline seen in the USD/JPY has lead the pair back to the key long-term support zone of 100.70/99.00 which is not triggered by a return of risk aversion behaviour such as the Brexit event in June but rather by reactions towards future monetary policies of the U.S. Federal Reserve (Fed) and Bank of Japan (BOJ).
The BOJ which is engaged in the world’s longest running quantitative easing (QE) programme has appeared to reach its limits on its current monetary policy toolbox (bonds buying, Japanese equities purchases via exchange traded funds & negative interest). In the last BOJ monetary policy meeting in July, BOJ has disappointed market participants’ expectations by just increasing its equites related exchange trade funds (ETFs) purchases to an annual pace of 6 trillion yen from 3.3 trillion yen. The quantum of government bonds purchases (quantitative easing) was left unchanged at an annual pace of 80 trillion yen and nothing is being mentioned about enacting polices related to “helicopter money”.
Since the last fed funds interest rate hike of 25bps in December 2015, the Fed’s communication has been mixed on the pace of its policy interest rate normalisation cycle after close to 7years of ZIRP (0% interest rate policy). From an initial planned of 4 interest rate hikes for 2016, Fed officials have toned down to at most 2 interest rates hikes in their latest “dot-plot” projections. Adding to the woes of USD bulls, Fed Chairwoman Yellen has always used the “balanced analysis” approach in her press conferences where she has acknowledged the ongoing strength of the U.S. economy but mindful of the economic downside risks that can be triggered by external factors such as a hard landing in China and now the negative spill over effects from Brexit. For the rest of 2016, the fed funds futures market has now only priced in a 21% chance of a hike in the next September meeting, 25% chance in the November meeting and 41% chance in the December meeting. All these actions by Fed and BOJ have led USD bulls to trim their bets of a further USD/JPY appreciation.
Therefore, the Jackson Hole conference will be an important event to watch for cues on the direction of future monetary policies from Fed and BOJ. Fed Chairwoman will be speaking today and BOJ Governor Kuroda will take part in a panel discussion on Saturday. These are the highlights that we should be monitoring:
- Fed Chairwoman Yellen’s speech on “The Federal Reserves’ Monetary Policy Toolkit” @1400GMT, Friday 26 August 2016 – it is unlikely that she will be explicit about on the timing of the next interest rate hike but we can look out for statements that allude confidence in the external environment such as stabilisation in the China economy, risks of Brexit can be mitigated by both current fiscal and monetary policies implemented by U.K. policy makers. The market may view such statements as “external risks” have subsided and future Fed monetary policies will be more dependent on the health of the U.S. economy which can be positive for the USD.
- BOJ Governor Kuroda panel discussion @1600GMT Saturday 27 August 2016 – One of the hot topics may be centred on “helicopter money” policies. In a surprise move seen in the last BOJ monetary policy meeting held in July, Governor Kuroda has ordered an assessment of the effectiveness of BOJ policy to be undertaken at the next monetary policy meeting in September. This action has implied that BOJ has subtlety acknowledged that the current monetary policies are losing its effectiveness to drive up the targeted economic targets, especially on inflation which actually opens the door for a discussion on a change in legislation to allow for unconventional policies such as “helicopter money”. Therefore if Kuroda starts to drop hints during the panel discussion that BOJ is opening up to new ideas on monetary policies that can be “partnered” with fiscal policies to achieve the ultimate goal of reaching its desired inflation target of 2%. This discussion implies some form of “helicopter money” that fiscal spending is being financed by BOJ which may reverse the current strength seen in the JPY.
Let’s us now take a deep dive into USD/JPY from a technical analysis perspective
USD/JPY
Key elements
- Since the last BOJ’s monetary policy meeting on 29 July 2016, the USD/JPY has continued to tumble from its high of 105.38 to retest the Brexit’s low zone of 100.00/99.00. Interestingly, it is now hovering right above a key long-term pivotal support of 100.70/99.00 which is defined by the former descending trendline resistance in place since August 1998 high of 147.65 now turns pull-back support and a Fibonacci cluster zone.
- Based on the Elliot Wave Principal and fractal analysis, the USD/JPY is coming close to complete a cycle degree (multi-month) bearish impulsive 5 wave structure down move, labelled as (1), (2), (3), (4), (5) of A from the June 2015 high of 125.85. Current price action is undergoing the potential final 5th wave of the primary degree wave bearish impulsive down move (5) to complete the higher cycle degree wave A. These observations suggest that the USD/JPY may start to see a multi-month recovery (cycle corrective wave B) at this juncture to retrace at least 50% to 61.8% of the ongoing multi-month decline from June 2015 high (see weekly chart).
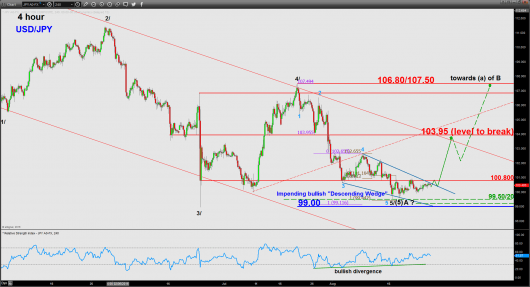
- Chart pattern analysis also reinforces the aforementioned preferred Elliot Wave count. As seen from the 4 hour chart, the recent price movement of the USD/JPY has started to trace out an impending bullish “Descending Wedge” formation (depicted blue) in place since the 08 August 2016 minor swing high of 102.65. This bullish chart formation tends to occur at the last leg/phase of a downtrend as it depicts a bearish exhaustion sign on the current down move. As seen by the two blue lines drawn on the 4 hour chart, the magnitude of the minor swing lows (support line) is lesser than the magnitude of the minor swing highs (resistance line).
- The upper boundary (resistance) of the “Descending Wedge” stands at slightly below the former 02 /12 August 2016 minor swing low area of 100.80 that has been rejected recently on this Monday, Asian session. The lower boundary (support) of the “Descending Wedge” rests at 99.50/20 zone which also confluences with a 5th wave Fibonacci projection of a minor degree.
- Momentum indicators are also indicating a potential bearish exhaustion for this on-going multi-month downtrend. Longer-term RSI oscillators from monthly to daily are now resting at their respective supports in the oversold region. In addition, the shorter-term 4 hour RSI has flashed a bullish divergence signal even though recent price actions have continued to drift lower since the last BOJ meeting on 29 July 2016.
- The significant resistance to watch will be at 103.95 where a break above it is likely to reinforce the preferred multi-month corrective rally view. The 103.95 resistance is defined by the upper boundary of a long-term bearish descending channel that has capped prior advances since late January 2016.
- Above 103.95 will be the 1068.80/107.50 medium-term swing high area of 23 June/20 July 2016.
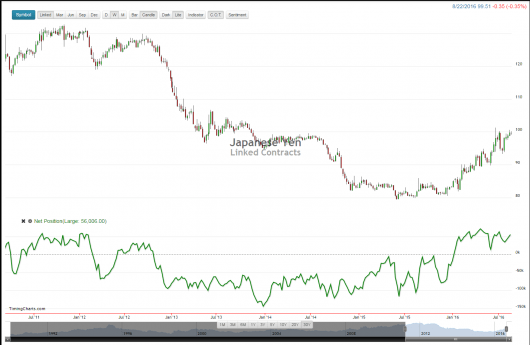
- Based on the latest Commitment Of Traders report as at 16 August 2016, net long positions of “large” speculators on JPY futures has increased to 56,006 contracts which remains elevated on the topside as it is closed to the extreme bullishness level seen on 10 January 2012 where net long positions went up to a high of 59,657 contracts. This flow of positioning can represent an overcrowded trade in JPY on the long side which is at risk of a significant short squeeze on USD/JPY that can translate into a potential swift and violent upward movement in the USD/JPY (refer to the last chart).
Key levels (1 to 3 months)
Intermediate support: 99.50/20
Pivot (key support): 99.00
Resistances: 100.80, 103.95 & 106.80/107.50
Next support: 94.80
Conclusion
Technically, the USD/JPY has pushed backed down towards the lower limit of its key long-term pivotal support zone of 100.70/99.00 with integrated potential bearish exhaustion signals as mentioned above. In addition, net long positioning on JPY as seen in large specs accounts (such as hedge funds) has reached to an extreme level in the currency futures market. This type of sizable positioning that skews to one extreme side (long JPY) can see the risk of squeeze where a rush to cover initial long JPY positions can lead to a potential pronounced rally in USD/JPY.
Therefore, the risk seems to be skewed towards USD/JPY bears at this juncture. Given the highly monitored Fed Chairwoman, Yellen’s speech later at 10.00 EST for the Jackson Hole Conference, we cannot rule out the possibility of a “residual” push down to test the 99.50/20 intermediate support first (lower boundary of the Descending Wedge). As long as the 99.00 key pivotal support holds and a break above 100.80 (upper boundary of the Descending Wedge) is likely to see a further push up towards the next resistance at 103.95 for the USD/JPY (the upper boundary of the descending channel in place since late January 2016) in the first step.
On the other hand, failure to hold above the 99.00 key pivotal support is likely to invalidate the corrective recovery scenario for USD/JPY for a continuation of the down move to target the next support at 94.80.
Charts are from eSignal & & www.timingcharts.com
Disclaimer
This report is intended for general circulation only. It should not be construed as a recommendation, or an offer (or solicitation of an offer) to buy or sell any financial products. The information provided does not take into account your specific investment objectives, financial situation or particular needs. Before you act on any recommendation that may be contained in this email, independent advice ought to be sought from a financial adviser regarding the suitability of the investment product, taking into account your specific investment objectives, financial situation or particular needs. All queries regarding the contents of this material are to be directed to City Index, a trading name of GAIN Capital Singapore Pte Ltd.
Trading CFDs and FX on margin carries a high level of risk that may not be suitable for some investors. Consider your investment objectives, level of experience, financial resources, risk appetite and other relevant circumstances carefully. The possibility exists that you could lose some or all of your investments, including your initial deposits. If in doubt, please seek independent expert advice. Visit cityindex.com.sg for the complete Risk Disclosure Statement.
Related tags:




Open an account in minutes
Experience award-winning platforms with fast and secure execution, and enjoy tight spreads from 0.5 pts on FX and 0.3 pts on indices.
Economic calendar
Web Trader platform
Our sophisticated web-based platform is packed with features.
Related articles
This report is intended for general circulation only. It should not be construed as a recommendation, or an offer (or solicitation of an offer) to buy or sell any financial products. The information provided does not take into account your specific investment objectives, financial situation or particular needs. Before you act on any recommendation that may be contained in this report, independent advice ought to be sought from a financial adviser regarding the suitability of the investment product, taking into account your specific investment objectives, financial situation or particular needs.
StoneX Financial Pte. Ltd., may distribute reports produced by its respective foreign entities or affiliates within the StoneX group of companies or third parties pursuant to an arrangement under Regulation 32C of the Financial Advisers Regulations. Where the report is distributed to a person in Singapore who is not an accredited investor, expert investor or an institutional investor (as defined in the Securities Futures Act), StoneX Financial Pte. Ltd. accepts legal responsibility to such persons for the contents of the report only to the extent required by law. Singapore recipients should contact StoneX Financial Pte. Ltd. at 6826 9988 for matters arising from, or in connection with the report.
In the case of all other recipients of this report, to the extent permitted by applicable laws and regulations neither StoneX Financial Pte. Ltd. nor its associated companies will be responsible or liable for any loss or damage incurred arising out of, or in connection with, any use of the information contained in this report and all such liability is hereby expressly disclaimed. No representation or warranty is made, express or implied, that the content of this report is complete or accurate.
StoneX Financial Pte. Ltd. is not under any obligation to update this report.
Trading CFDs carries a high level of risk that may not be suitable for some investors. Consider your investment objectives, level of experience, financial resources, risk appetite and other relevant circumstances carefully. The possibility exists that you could lose some or all of your investments, including your initial deposits. If in doubt, please seek independent expert advice. Visit www.forex.com/en-sg/terms-and-policies for the complete Risk Disclosure Statement.