










Wall Street, Crude oil, gold jump for joy on dovish Fed
Risk appetite made a swift comeback when the Fed opened the door to beginning their rate-cut cycle in September. The question is whether Wall Street indices, gold or WTI crude can extend their gains.
Share this:

Gold bulls couldn’t resist the urge to buy more of their precious metal after the Fed effectively signalled the beginning of its rate cut cycle. And the buying wasn’t limited to gold. Silver, copper, crude oil and Wall Street indices embarked upon a risk-on rally thanks to the combination of lower yields, US dollar and dovish Fed.
However, with the US dollar showing signs of stability around its 200-day EMA, gold bugs may want to exercise some caution above $2500. Especially since gold futures have struggled to hold onto gains on the three occasions it broke above $2500 in April, May and July. Furthermore, markets were already pricing in a September cut, so the Fed’s announcement should not have come as a surprise – although it is an important step they needed to take before doing the deed.
It is debatable as to how relevant the ISM and NFP reports are now the Fed have signalled cuts. Unless the data comes in much hotter than expected, and that could dent gold as we head towards the weekend. And if it comes in soft, it could undermine the gains we saw on Wall Street indices on Wednesday.
S&P 500, Nasdaq, Dow Jones futures analysis:
Index futures are the top row, cash markets are the bottom. The bounce on cash markets were a little underwhelming, so I’m not convinced we have seen ‘the’ swing low of this current correction.
While the S&P 500 and Nasdaq futures markets formed bullish engulfing candles on Wednesday, both remain beneath high-volume nodes – and these areas can act as a magnet for prices before turning into support. And if ISM and NFP data comes in soft alongside weak earning, we could see swing highs form on them.
With the Dow Jones being the outperformer of late, this market seems less favourable for bears even if we see swing highs on the S&P 500 or Nasdaq. But it would be the first choice if US indices extend their rallies, given how well the Dow Jones stood up to the recent retracement from its record high.
Gold technical analysis:
We have seen limited upside for gold in today’s Asian session. Its rise above 2500 was very brief and prices have now retreated back beneath this key level while holding above last Wednesday’s high. The daily RSI (2) is in the overbought zone, and with the US dollar index holding support and showing the potential for a bounce, bulls may want to wait for a pullback to support before seeking fresh longs.
The 1-hout chart shows a strong rally to 2500, although a shooting star and subsequent bearish engulfing candle warn of a near-term top. Intraday bears could seek to fade into small rallies towards the engulfing-candle high with a stop above the shooting-star candle’s high and target the 2365/75 area. Bulls could step aside and wait for evidence of a swing low around support levels such as the monthly pivot point (2461.5), high-volume node (2465.5) or weekly R1 (2473).
A break above 2504 assumes a move up to 2517, near the weekly R2 pivot and April high. Caution is warranted around the 2520 area given highs formed in April and May.
Crude oil technical analysis:
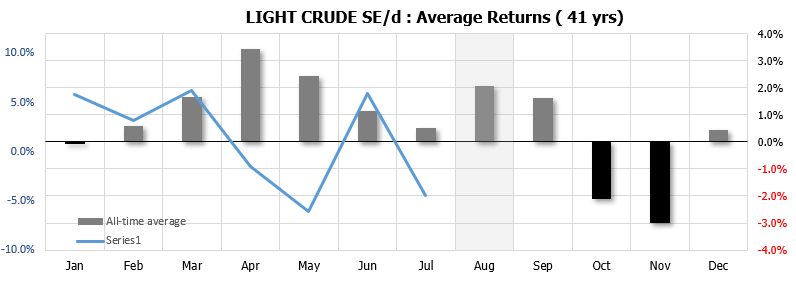
The 3-wave correction between the July high to low and spanned around -10%. Demand concerns from China overpowered the usually positive seasonality from US driving season, but momentum ahs now turned. Wednesday’s 4.3% was the best day of the year and likely marks Tuesday’s low (the July low) as an important swing low. Daily trading volume was also the highest in 30 to suggest bulls initiated new positions, and the move was not simply one of short covering.
The 1-hour chart shows the strong rally from the July low provided a single shallow retracement, which is a testament to the strength of the move. Yet the market is clearly hesitant to break above 79 for now, the weekly R1 pivot hovers overhead at 78.85 and the RSI (14) has also been overbought for the past 12 hours.
Given the US dollar index is consolidating above its 200-day EMA, bulls may want to see if a retracement materialises before seeking fresh longs. Potential support areas to seek swing lows include the 77 – 77.50 zone, where the weekly pivot point, high-volume node (HVN) and 38.2% Fibonacci level reside. A break above 79 assumes a move for 80.
-- Written by Matt Simpson
Follow Matt on Twitter @cLeverEdge
How to trade with City Index
You can trade with City Index by following these four easy steps:
- Open an account, or log in if you’re already a customer
• Open an account in the UK
• Open an account in Australia
• Open an account in Singapore
- Search for the market you want to trade in our award-winning platform
- Choose your position and size, and your stop and limit levels
- Place the trade
Related tags:


Open an account in minutes
Experience award-winning platforms with fast and secure execution, and enjoy tight spreads from 0.5 pts on FX and 0.3 pts on indices.
Economic calendar
Web Trader platform
Our sophisticated web-based platform is packed with features.
Related articles
Gold Breaks Down on Descending Triangle, Sets Up $4k Test
Gold started last week with a strong sell-off but from that move a bounce developed. Bulls could not hold on through the weekly close, however, and the bearish structure remains in-place for XAU/USD.

Gold Update: XAU/USD Remains Under Pressure Even After the NFP Report
As the trading week comes to an end, weakness around gold price action remains evident in the short term. This can be seen in the performance of the past two sessions, where the metal has declined by approximately 0.3%. Although the move has not been particularly aggressive, it highlights that buying pressure continues to struggle to regain control of the market.


USD/CAD forecast: rally could accelerate above June highs at 1.4250
USD/CAD recovered quickly after weaker US jobs data, keeping the bullish trend in focus. A move above the June highs could accelerate the rally as inflation keeps the Fed under pressure.

This report is intended for general circulation only. It should not be construed as a recommendation, or an offer (or solicitation of an offer) to buy or sell any financial products. The information provided does not take into account your specific investment objectives, financial situation or particular needs. Before you act on any recommendation that may be contained in this report, independent advice ought to be sought from a financial adviser regarding the suitability of the investment product, taking into account your specific investment objectives, financial situation or particular needs.
StoneX Financial Pte. Ltd., may distribute reports produced by its respective foreign entities or affiliates within the StoneX group of companies or third parties pursuant to an arrangement under Regulation 32C of the Financial Advisers Regulations. Where the report is distributed to a person in Singapore who is not an accredited investor, expert investor or an institutional investor (as defined in the Securities Futures Act), StoneX Financial Pte. Ltd. accepts legal responsibility to such persons for the contents of the report only to the extent required by law. Singapore recipients should contact StoneX Financial Pte. Ltd. at 6826 9988 for matters arising from, or in connection with the report.
In the case of all other recipients of this report, to the extent permitted by applicable laws and regulations neither StoneX Financial Pte. Ltd. nor its associated companies will be responsible or liable for any loss or damage incurred arising out of, or in connection with, any use of the information contained in this report and all such liability is hereby expressly disclaimed. No representation or warranty is made, express or implied, that the content of this report is complete or accurate.
StoneX Financial Pte. Ltd. is not under any obligation to update this report.
Trading CFDs carries a high level of risk that may not be suitable for some investors. Consider your investment objectives, level of experience, financial resources, risk appetite and other relevant circumstances carefully. The possibility exists that you could lose some or all of your investments, including your initial deposits. If in doubt, please seek independent expert advice. Visit www.forex.com/en-sg/terms-and-policies for the complete Risk Disclosure Statement.