



Weekly COT Report: Bearish exposure to AUD hits a new record
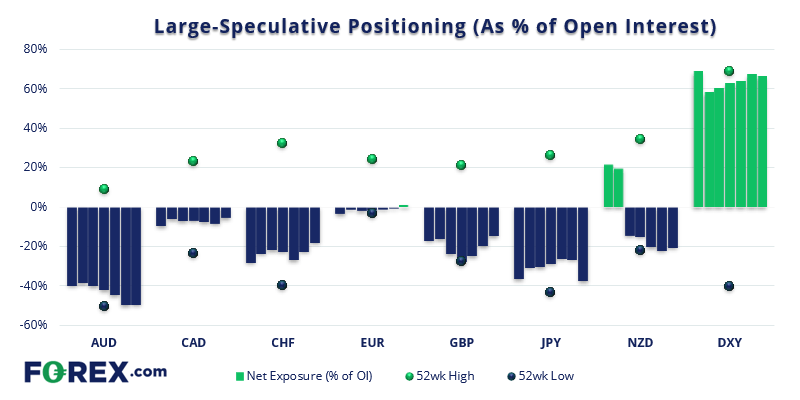
AT -91.5k contracts net-short, it is the most aggressively bearish exposure on AUD futures by large speculators on record.
Share this:
As of Tuesday 11th January 2022:
- Traders increased bullish exposure to USD by $0.42 billion, according to IMM
- Traders flipped to net-long exposure to euro futures
- Net-short exposure to AUD futures hit a new record
- Large speculators increased net-short exposure to yen futures to a 6-week high

Read our guide on how to interpret the weekly COT report
Read our guide on how to interpret the weekly COT report
AUD futures:
Traders sold short 1.8k contracts against the Australian dollar and trimmed longs by -249 contracts, which takes the net-sort exposure to a new record of -91.5k contracts. Whilst shorts rose a little last week, the increase of short exposure has mainly been a function of longs being closed out since the end of November. Yet despite the bearish exposure to AUD prices continue to hold up well overall, which means we need to see prices roll over or bears will be forced to close and potentially spark a short-covering rally (like we’ve seen on GBP futures recently).
Read our guide on the Australian Dollar
Read our guide on the Australian Dollar


EUR futures:
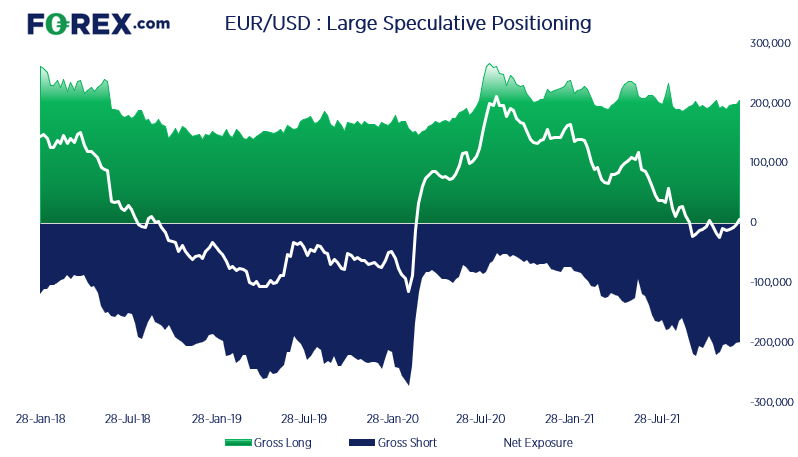
Traders flipped to net-long exposure on euro futures by 6 contracts. Yet we note there is a lot of trading activity in both directions, with longs and shorts sitting around 200k contracts each, so it appears investors are hedging their bets. So for a sustainable move to materialise we’d need to see a significant reduction in longs or shorts, as opposed to newly initiated activity.

JPY futures:
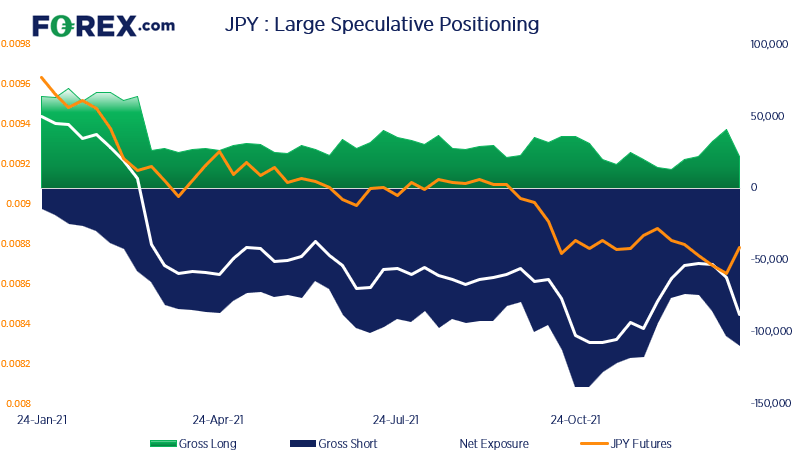
Last week traders closed 18.4k long contracts on yen futures and added 6.8k short contracts, which saw net-short exposure increase by 25.3k contracts. Yet prices went on to rally 1.48%, most of which was seen on Wednesday – a day after the report was compiled. So we have to assume some of those shorts have since been closed.

As of Tuesday 11th January 2022:
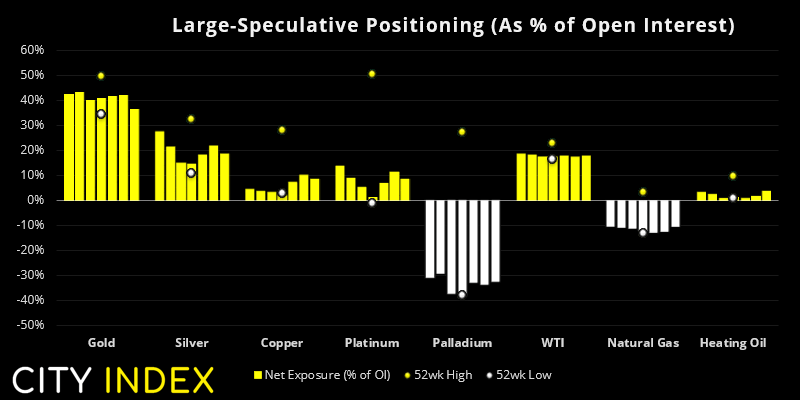
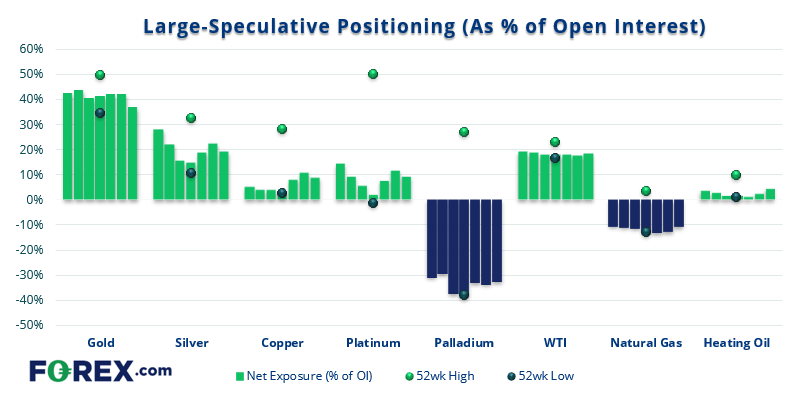
- Traders increased net-long exposure to WTI futures by 27.7k contracts
- Large speculators trimmed net-long exposure to gold futures by -11.6k contracts
WTI futures:
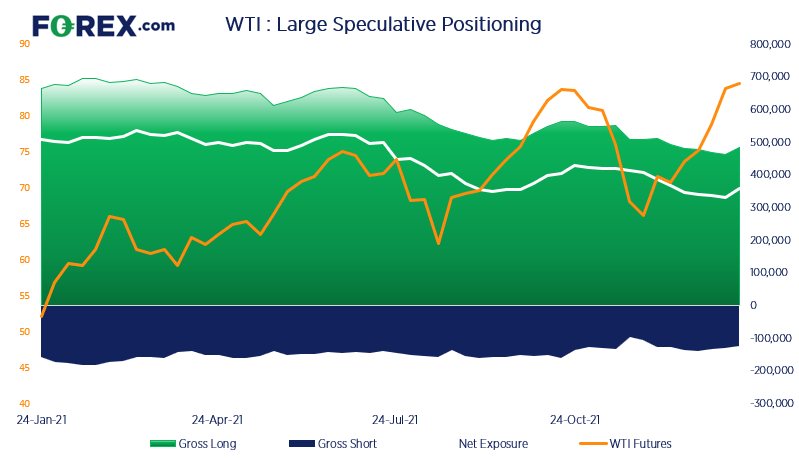
Traders increased their net-long exposure to WTI futures by 27.7k contracts last week, which is the most bullish weekly increase in 13-months. As gross logs have been trending lower for about a year it raises the odds that net-long positioning has seen a trough, and oil prices could potentially rally from here.

How to trade with City Index
You can easily trade with City Index by using these four easy steps:
- Open an account, or log in if you’re already a customer
• Open an account in the UK
• Open an account in Australia
• Open an account in Singapore
- Search for the company you want to trade in our award-winning platform
- Choose your position and size, and your stop and limit levels
- Place the trade

Open an account in minutes
Experience award-winning platforms with fast and secure execution, and enjoy tight spreads from 0.5 pts on FX and 0.3 pts on indices.
Economic calendar
Web Trader platform
Our sophisticated web-based platform is packed with features.
Related articles

Crude Oil Weekly Outlook: Elections Test Brent–WTI Resistance Levels
Crude Oil Weekly Outlook: Brent–WTI spread tests long-term resistance as monthly RSI reaches overbought territory and key elections approach. Brent and WTI levels and risks ahead.


US Dollar Bulls Hold Firm, but Euro Warns of Squeeze Risk | COT Report
US dollar bulls remain firmly positioned, but record euro shorts have failed to break EUR/USD support, raising the risk of a short-covering rally.

USD/CAD reversal risk builds as central bank showdown looms
USD/CAD has delivered a bullish reversal signal from established support, just as traders prepare for Fed and BoC decisions. Aggressive Canadian rate hike expectations and conflicting momentum signals make the coming session important.

This report is intended for general circulation only. It should not be construed as a recommendation, or an offer (or solicitation of an offer) to buy or sell any financial products. The information provided does not take into account your specific investment objectives, financial situation or particular needs. Before you act on any recommendation that may be contained in this report, independent advice ought to be sought from a financial adviser regarding the suitability of the investment product, taking into account your specific investment objectives, financial situation or particular needs.
StoneX Financial Pte. Ltd., may distribute reports produced by its respective foreign entities or affiliates within the StoneX group of companies or third parties pursuant to an arrangement under Regulation 32C of the Financial Advisers Regulations. Where the report is distributed to a person in Singapore who is not an accredited investor, expert investor or an institutional investor (as defined in the Securities Futures Act), StoneX Financial Pte. Ltd. accepts legal responsibility to such persons for the contents of the report only to the extent required by law. Singapore recipients should contact StoneX Financial Pte. Ltd. at 6826 9988 for matters arising from, or in connection with the report.
In the case of all other recipients of this report, to the extent permitted by applicable laws and regulations neither StoneX Financial Pte. Ltd. nor its associated companies will be responsible or liable for any loss or damage incurred arising out of, or in connection with, any use of the information contained in this report and all such liability is hereby expressly disclaimed. No representation or warranty is made, express or implied, that the content of this report is complete or accurate.
StoneX Financial Pte. Ltd. is not under any obligation to update this report.
Trading CFDs carries a high level of risk that may not be suitable for some investors. Consider your investment objectives, level of experience, financial resources, risk appetite and other relevant circumstances carefully. The possibility exists that you could lose some or all of your investments, including your initial deposits. If in doubt, please seek independent expert advice. Visit www.forex.com/en-sg/terms-and-policies for the complete Risk Disclosure Statement.