


With US Dollar ‘Rebound’ Waning, EUR/USD and GBP/USD Could Bounce
The US dollar’s rebound shows signs of exhaustion, opening the door for EUR/USD and GBP/USD to recover ahead of key US inflation and jobs data.
Share this:

The US dollar’s rebound appears to be running out of steam, raising the prospect of a recovery in EUR/USD and GBP/USD ahead of key US data releases. With inflation figures still due despite the government shutdown and jobless claims on schedule, weaker-than-expected readings could quickly undermine the greenback and reignite bullish momentum in the euro and British pound.
View related analysis:
View related analysis:
US Dollar Weakness Could Lift EUR/USD and GBP/USD
On Monday, I outlined my bias for the US Dollar Index to rebound against last week’s sell-off, which I expected would pressure EUR/USD and GBP/USD lower in the near term. I also noted that any retracements in the euro and British pound could be limited before both currencies resume their upward trends. I believe we’re now entering that phase of the outlook, so today I’ll update my key levels.
Keep in mind that US inflation data is still scheduled for release tomorrow despite the ongoing government shutdown. The weekly jobless claims report will also be published today and remains one of the few data sets continuing on schedule. Weakness in either release could quickly feed back into a softer US dollar on renewed bets of Fed rate cuts.
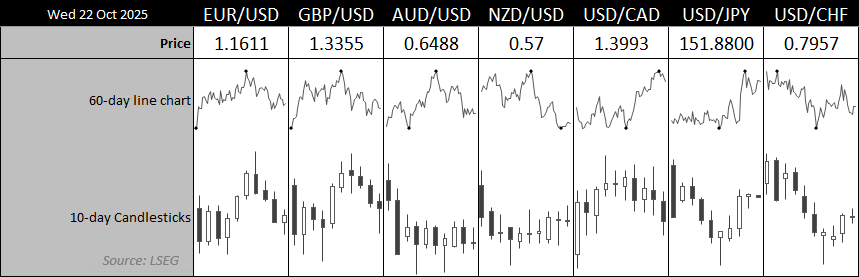
Chart prepared by Matt Simpson – source: LSEG


US Dollar Index (DXY) Technical Analysis
It has been a decent start to the week for the US dollar, having staged a three-day countertrend rally from its 50-day EMA. However, if there’s one thing missing from this rebound, it’s conviction — both volume and bullish volatility are lacking. Daily trading volume has not only been trending lower for nearly two weeks but is now running at roughly half its 20-day average.
Given that this decline in volume coincides with the dollar’s bounce, it suggests the move so far is corrective. Also note the doji that formed on Wednesday, indicating a loss of bullish momentum — hence, I’m now on guard for a potential swing high.
- The weekly R1 sits near the 99 handle, which could attract sellers if the dollar initially pushes higher.
- The weekly pivot at 99.41 serves as a near-term downside target; a break below it would bring the 50-day EMA and high-volume node (HVN) at 97.63 into focus.
- A move above the 99.28 high and 200-day EMA would invalidate the near-term bearish bias.

Chart analysis by Matt Simpson - data source: TradingView
EUR/USD Technical Analysis: Euro vs US Dollar
The euro declined for a third consecutive session against the US dollar, taking EUR/USD back to its monthly S1 pivot point near 1.1588. A small doji candle formed on Wednesday around this key support level, suggesting that bearish momentum may be fading. Also note that the weekly S1 pivot aligns with prior cycle lows, offering further potential support should we see another bout of volatility before a rebound.
If my assumption of a developing swing high in the US Dollar Index (DXY) proves correct, EUR/USD could now stage a recovery. The 50-day EMA (1.1664) represents a logical interim upside target for bulls over the near term, while a sustained break above that level would bring the weekly R1 pivot, monthly pivot, and the 1.1780 high into focus.
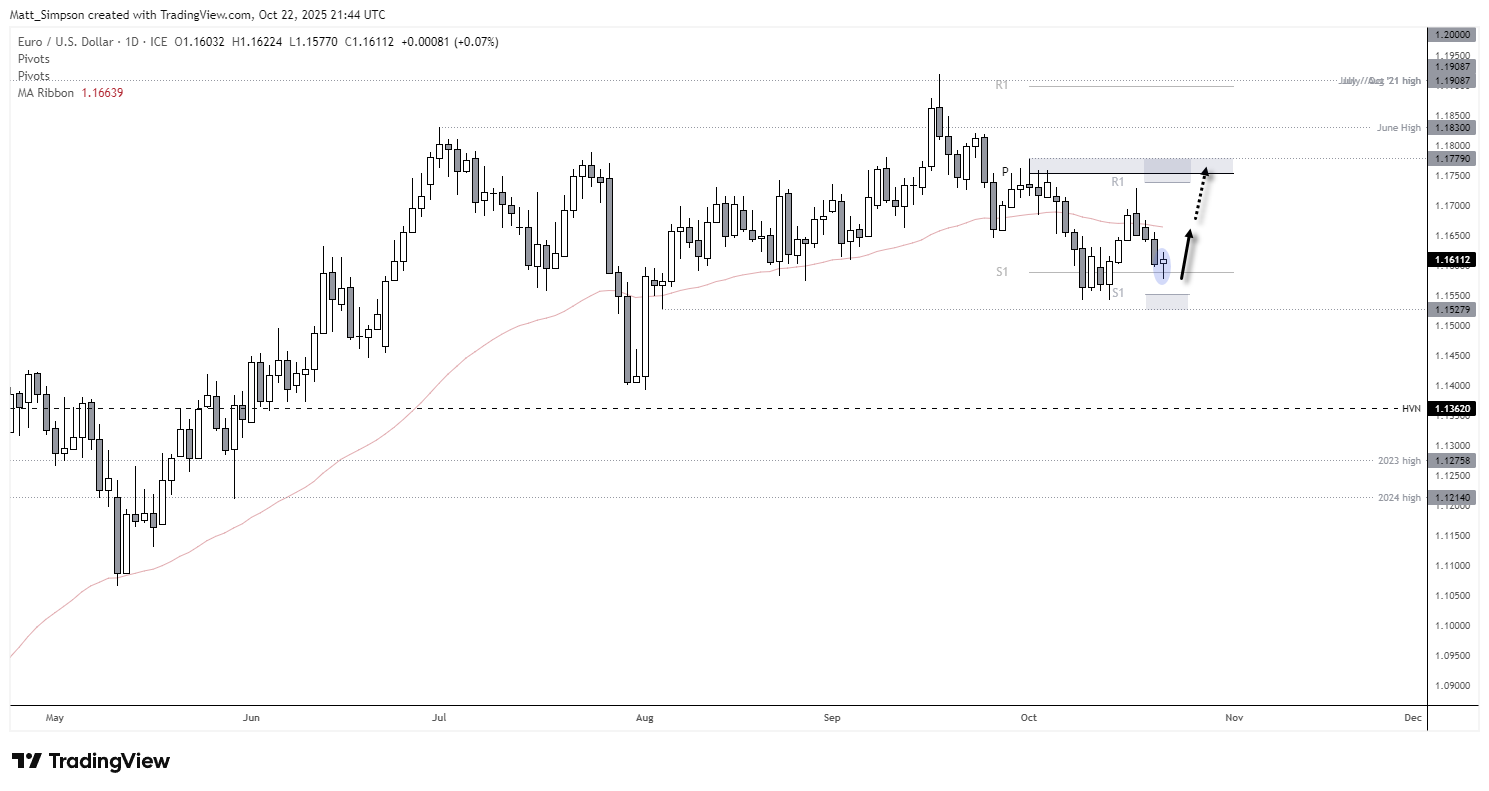
Chart analysis by Matt Simpson - data source: TradingView EUR/USD


GBP/USD Technical Analysis: British Pound vs US Dollar
The bounce from the 200-day EMA worked well — eventually. GBP/USD showed intent to rally from this key moving average a week last Friday, but it wasn’t until last Tuesday’s bullish hammer that we saw the real bounce materialise. The pair reached my upper target near the October VPOC, and since then, my near-term bearish bias has played out nicely this week.
Given Wednesday’s bullish hammer and the fact we’ve now seen four consecutive bearish sessions, I’ve shifted back to a near-term bullish bias. Note that the weekly S1 pivot sits just above the 200-day EMA and the 1.3278 support level, should momentum dip lower once more.
- Overall, bulls may look to buy dips towards Wednesday’s low and maintain a bullish bias while prices remain above the 200-day EMA (1.3274).
- 1.35 could be the next target for bulls, near the monthly pivot point and September VPOC.
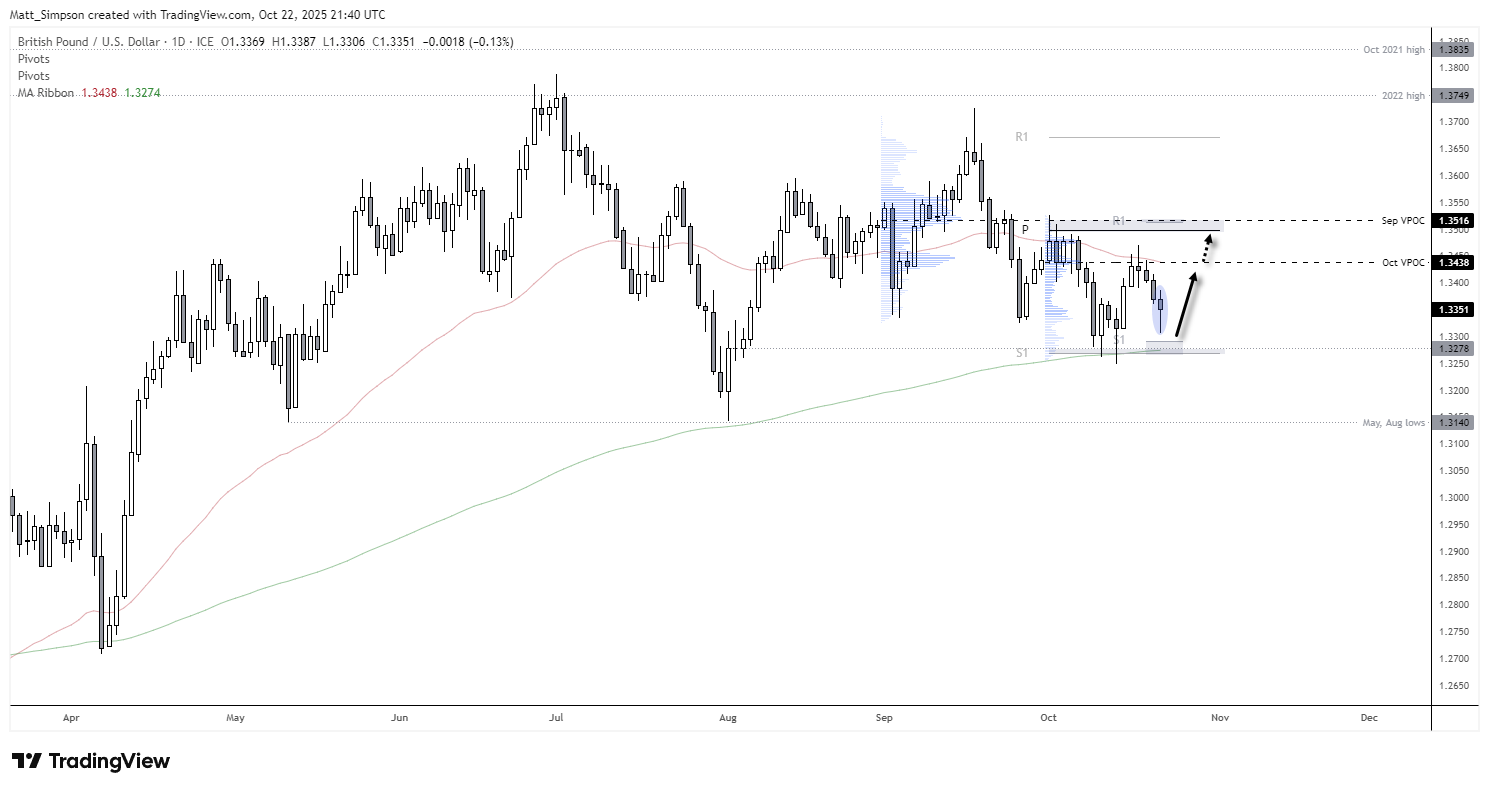
Chart analysis by Matt Simpson - data source: TradingView GBP/USD
View the full economic calendar
View the full economic calendar
-- Written by Matt Simpson
Follow Matt on Twitter @cLeverEdge
How to trade with City Index
You can trade with City Index by following these four easy steps:
- Open an account, or log in if you’re already a customer
• Open an account in the UK
• Open an account in Australia
• Open an account in Singapore
- Search for the market you want to trade in our award-winning platform
- Choose your position and size, and your stop and limit levels
- Place the trade
Related tags:
Latest market news




Open an account in minutes
Experience award-winning platforms with fast and secure execution, and enjoy tight spreads from 0.5 pts on FX and 0.3 pts on indices.
Economic calendar
Web Trader platform
Our sophisticated web-based platform is packed with features.
Related articles
US Dollar Bulls Hold Firm, but Euro Warns of Squeeze Risk | COT Report
US dollar bulls remain firmly positioned, but record euro shorts have failed to break EUR/USD support, raising the risk of a short-covering rally.
USD/CAD reversal risk builds as central bank showdown looms
USD/CAD has delivered a bullish reversal signal from established support, just as traders prepare for Fed and BoC decisions. Aggressive Canadian rate hike expectations and conflicting momentum signals make the coming session important.

Australian Dollar Outlook: AUD/USD Screams Sentiment Extreme Into Fed, CPI
AUD/USD rebounds despite record bearish futures positioning, with Australian Q3 CPI and the Fed meeting threatening to trigger another short squeeze.
This report is intended for general circulation only. It should not be construed as a recommendation, or an offer (or solicitation of an offer) to buy or sell any financial products. The information provided does not take into account your specific investment objectives, financial situation or particular needs. Before you act on any recommendation that may be contained in this report, independent advice ought to be sought from a financial adviser regarding the suitability of the investment product, taking into account your specific investment objectives, financial situation or particular needs.
StoneX Financial Pte. Ltd., may distribute reports produced by its respective foreign entities or affiliates within the StoneX group of companies or third parties pursuant to an arrangement under Regulation 32C of the Financial Advisers Regulations. Where the report is distributed to a person in Singapore who is not an accredited investor, expert investor or an institutional investor (as defined in the Securities Futures Act), StoneX Financial Pte. Ltd. accepts legal responsibility to such persons for the contents of the report only to the extent required by law. Singapore recipients should contact StoneX Financial Pte. Ltd. at 6826 9988 for matters arising from, or in connection with the report.
In the case of all other recipients of this report, to the extent permitted by applicable laws and regulations neither StoneX Financial Pte. Ltd. nor its associated companies will be responsible or liable for any loss or damage incurred arising out of, or in connection with, any use of the information contained in this report and all such liability is hereby expressly disclaimed. No representation or warranty is made, express or implied, that the content of this report is complete or accurate.
StoneX Financial Pte. Ltd. is not under any obligation to update this report.
Trading CFDs carries a high level of risk that may not be suitable for some investors. Consider your investment objectives, level of experience, financial resources, risk appetite and other relevant circumstances carefully. The possibility exists that you could lose some or all of your investments, including your initial deposits. If in doubt, please seek independent expert advice. Visit www.forex.com/en-sg/terms-and-policies for the complete Risk Disclosure Statement.