



Canadian Dollar Price Action Setups Into CPI: USD/CAD, GBP/CAD, EUR/CAD
Canadian dollar traders eye CPI data as BoC’s next rate decision nears, with USD/CAD, GBP/CAD, and EUR/CAD all showing key technical inflection zones.
Share this:
The Canadian dollar enters a pivotal week as traders position for the Bank of Canada’s (BoC) upcoming rate decision on October 29. With inflation data due today, markets are watching whether price pressures will justify another rate cut or force policymakers to stay patient. Meanwhile, key CAD crosses — USD/CAD, GBP/CAD, and EUR/CAD — are testing important resistance and support levels, setting up potential volatility around the CPI release.
View related analysis:
View related analysis:
Bank of Canada Business Outlook Shows Softer Sales Expectations
Business conditions rose for a fourth straight month to a nine-month high of 19%, according to the Bank of Canada’s quarterly Business Outlook Survey. However, the report noted that “firms’ outlooks and intentions remain subdued.” Uncertainty remains elevated, cost pressures have increased for a second consecutive quarter, and sales expectations over the next 12 months contracted for the first time in 10 months to -2.

Chart prepared by Matt Simpson, data source: Statistics Canada, BOC, LSEG
Inflation in Focus Ahead of Next Week’s Bank of Canada Decision
The Bank of Canada (BoC) will announce its next interest rate decision on October 29, making today’s inflation report a key event for Canadian dollar traders. Despite inflation falling within the BoC’s 1–3% target band earlier this year, core measures have since trended higher, with the weighted median exceeding the upper range three times since April and the trimmed mean twice.
Still, with a slowing economy and weaker business sentiment, there’s optimism that inflation could ease — though tariff risks from a revived Trump agenda remain a wild card. The 1-month OIS currently implies a 48% chance of a 25bp rate cut to 2.25%, while the 6-month OIS has fully priced in a 25bp cut.
BoC Governor Tiff Macklem recently emphasised the need to focus on “the risks” surrounding the next policy move, citing persistent uncertainty and urging humility in forecasts. GDP is expected to recover modestly after contracting 1.6% in Q2, but a strong rebound is unlikely in the near term.

Chart prepared by Matt Simpson, data source: Statistics Canada, LSEG


USD/CAD Technical Analysis: US Dollar vs Canadian Dollar
The US dollar (USD) reached a six-month high against the Canadian dollar (CAD) last week, although bullish momentum is starting to fade on the weekly chart, with a bearish hammer forming just above the 1.40 handle. That said, the daily chart remains within an established uptrend, even if short-term momentum is beginning to soften.
The 1.40–1.4010 area, marked by the monthly R1 pivot, appears to be a key inflection zone for both bulls and bears. If the 1.40 support level holds, bulls could target a move toward 1.41, near the monthly R2 pivot (1.4105). However, a break below 1.40 would expose downside potential toward the 1.3948 high-volume node (HVN) and the 20-day EMA.
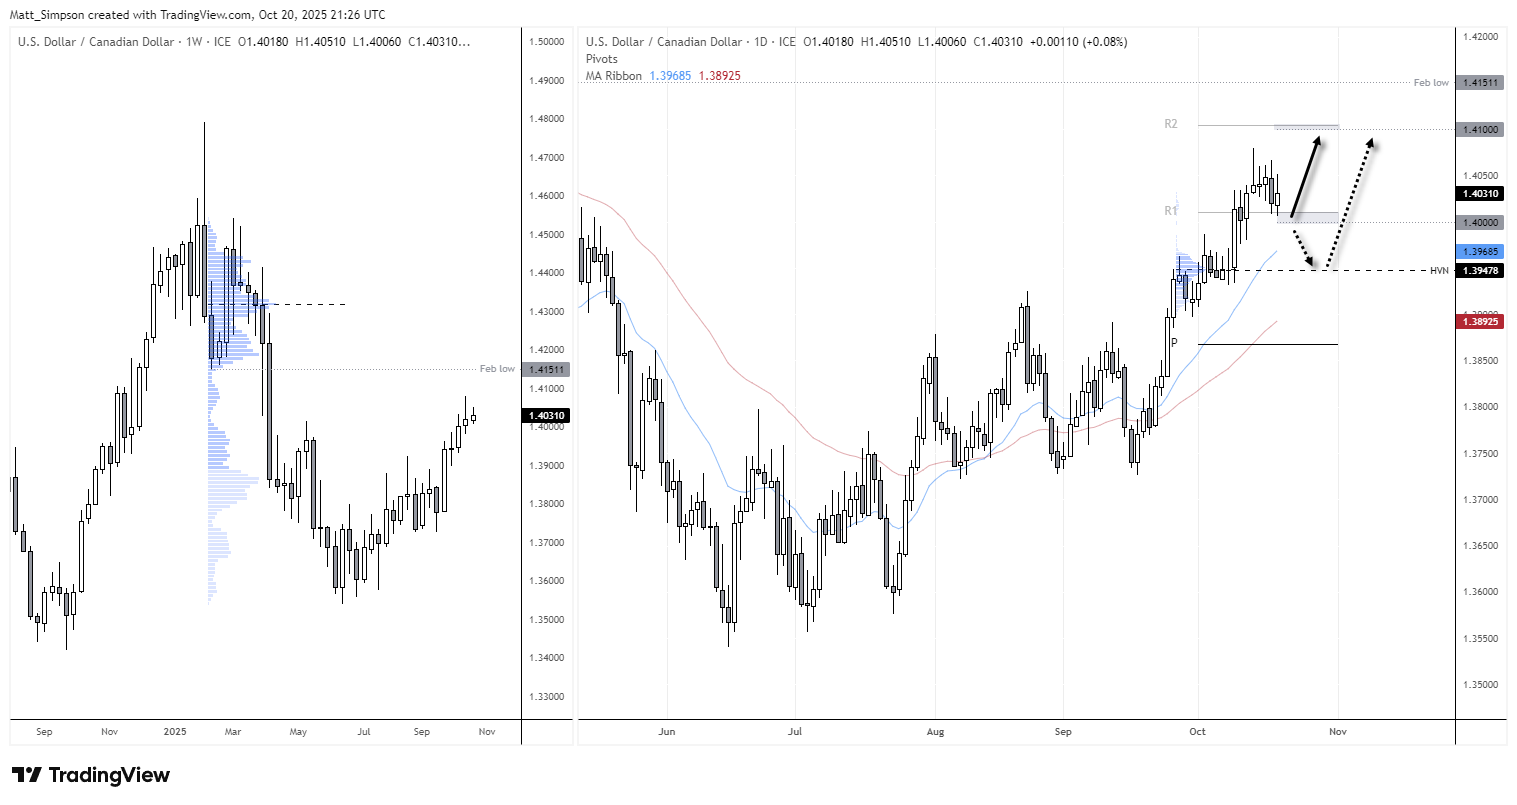
Chart analysis by Matt Simpson - data source: TradingView USD/CAD
GBP/CAD Technical Analysis: British Pound vs Canadian Dollar
The British pound (GBP) has gained around 35% against the Canadian dollar (CAD) since the September 2022 low, maintaining a strong uptrend on the weekly chart. The broader bias remains bullish unless the UK delivers another disappointing Autumn Budget. A series of higher lows on GBP/CAD in recent weeks, supported by the 20-week EMA, underline steady upside momentum — though the daily chart hints at potential short-term pullbacks.
On the daily timeframe, a two-bar bearish reversal pattern (dark cloud cover) has appeared near the monthly R1 pivot and 1.89 handle. Price action is now testing its recent low, suggesting scope for bearish mean reversion. Bears may look to fade rallies within Friday or Monday’s range, eyeing potential retracements toward the 20-day EMA (1.8742), 1.87 handle, 50-day EMA (1.8677), or monthly pivot point (1.8851) before reassessing for a new swing low.

Chart analysis by Matt Simpson - data source: TradingView GBP/CAD


EUR/CAD Technical Analysis: Euro vs Canadian Dollar
A similar technical setup has emerged on EUR/CAD, though the euro (EUR) has maintained a stronger uptrend against the Canadian dollar (CAD) than the British pound this year. In theory, any pullback could be shallower, suggesting bulls may prefer to wait for evidence of a swing low before re-entering long positions, while bears should proceed with caution.
A bearish engulfing candle formed on Monday, with its high aligning precisely with the monthly R1 pivot acting as resistance. Bulls could look for signs of a swing low forming near the monthly pivot (1.6238) and retain a bullish bias while prices remain above the 1.6170 low.
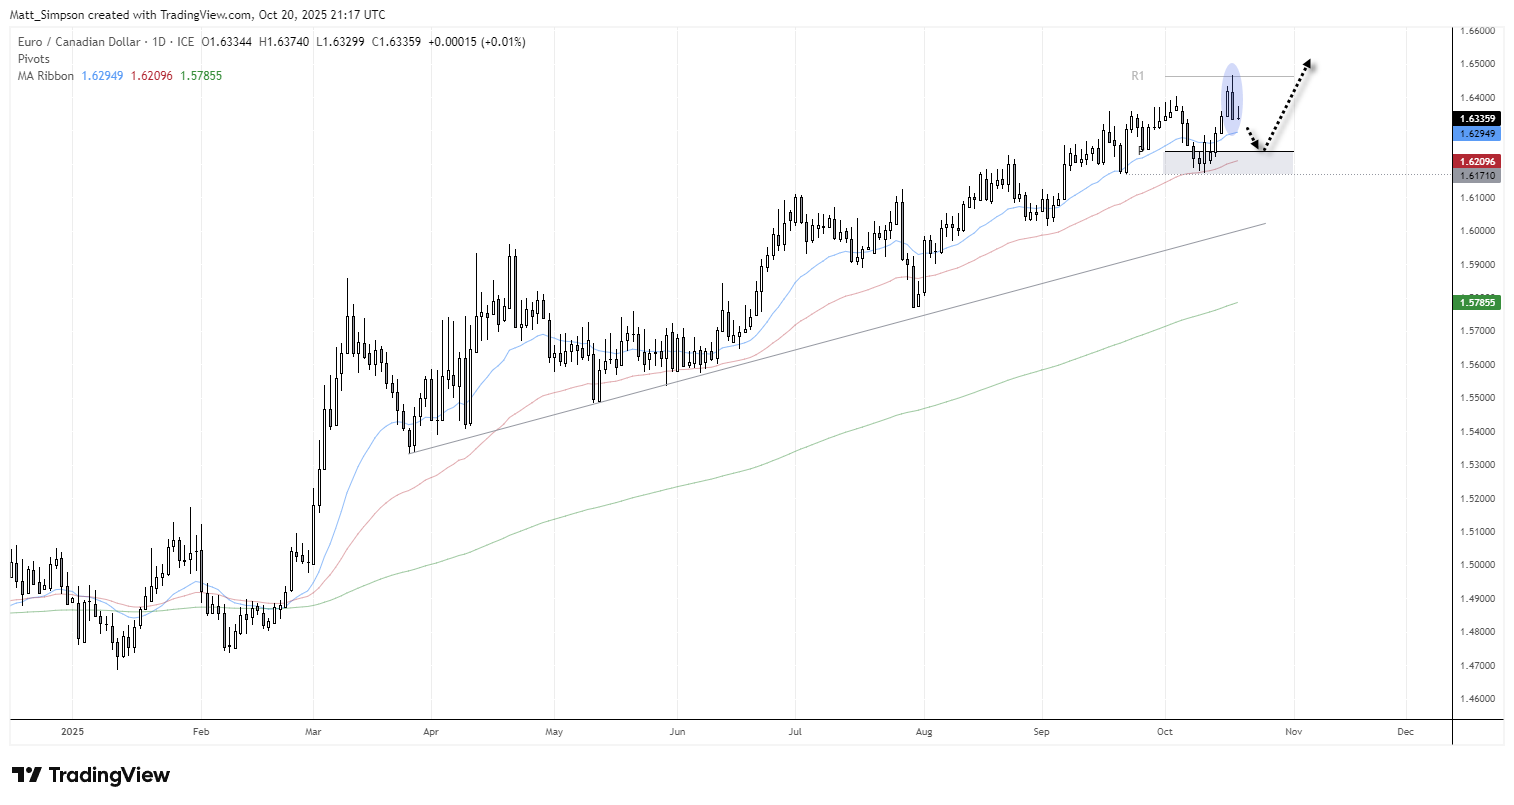
Chart analysis by Matt Simpson - data source: TradingView EUR/CAD
Key Economic Events for Traders (AEDT / GMT+11)
08:45 NZD Trade Report: Exports, Imports, Trade Balance (Sep) (NZD/USD, AUD/NZD, NZD/JPY)
10:45 AUD RBA Assistant Governor Jones Speaks (AUD/USD, AUD/JPY, ASX 200)
12:00 EUR German Buba President Nagel Speaks (EUR/USD, EUR/GBP, DAX)
13:00 NZD Credit Card Spending (Sep) (NZD/USD, AUD/NZD, NZD/JPY)
15:00 EUR German Buba President Nagel Speaks (EUR/USD, EUR/GBP, DAX)
17:00 GBP Public Sector Borrowing and Cash Requirement (Sep) (GBP/USD, EUR/GBP, FTSE 100)
17:00 CHF Trade Balance (Sep) (USD/CHF, EUR/CHF, SMI Index)
18:00 CHF M3 Money Supply (Sep) (USD/CHF, EUR/CHF, SMI Index)
18:00 EUR ECB’s Lane Speaks (EUR/USD, EUR/GBP, DAX)
21:30 GBP BoE Governor Bailey Speaks (GBP/USD, EUR/GBP, FTSE 100)
22:00 EUR ECB President Lagarde Speaks (EUR/USD, EUR/GBP, DAX)
23:30 CAD CPI Report: Headline, Core, Common, Median, Trimmed (Sep) (USD/CAD, EUR/CAD, CAD/JPY)
23:55 USD Redbook (S&P 500, Nasdaq 100, USD/JPY)
00:00 USD Fed Waller Speaks (S&P 500, Nasdaq 100, USD/JPY)
02:00 NZD Global Dairy Trade Price Index (NZD/USD, AUD/NZD, NZD/JPY)
02:00 USD Milk Auctions (S&P 500, Nasdaq 100, USD/JPY)
04:00 EUR German Buba Balz Speaks (EUR/USD, EUR/GBP, DAX)
06:30 USD Fed Waller Speaks (S&P 500, Nasdaq 100, USD/JPY)
07:30 USD API Weekly Crude Oil Stock (WTI Crude, Brent Crude, USD/CAD)
View the full economic calendar
View the full economic calendar
-- Written by Matt Simpson
Follow Matt on Twitter @cLeverEdge
How to trade with City Index
You can trade with City Index by following these four easy steps:
- Open an account, or log in if you’re already a customer
• Open an account in the UK
• Open an account in Australia
• Open an account in Singapore
- Search for the market you want to trade in our award-winning platform
- Choose your position and size, and your stop and limit levels
- Place the trade
Related tags:


Open an account in minutes
Experience award-winning platforms with fast and secure execution, and enjoy tight spreads from 0.5 pts on FX and 0.3 pts on indices.
Economic calendar
Web Trader platform
Our sophisticated web-based platform is packed with features.
Related articles

USD/JPY Forecast: Is Rising Japanese Inflation Supporting the Yen?
As the trading week comes to an end, one of the most relevant developments in the FX market has been the renewed strength of the Japanese yen. This can be seen in the recent performance of USD/JPY, which has fallen nearly 1.0% over the last two trading sessions, highlighting a meaningful recovery in the Japanese currency against the U.S. dollar.


US Dollar Price Action Setups: EUR/USD, USD/JPY, GBP/USD, USD/CAD
The Dollar is working on its second consecutive red week and while sellers didn’t exactly pounce on fresh lows, there’s an opening door for bears to make a move.

Australian Dollar Forecast: AUD/USD Support Reversal Sparks Monthly Range Breakout 10 23 2026
A sharp reversal off key support has fueled the AUD/USD recovery, with resistance now in focus ahead of next week’s Fed decision and Australian CPI.

This report is intended for general circulation only. It should not be construed as a recommendation, or an offer (or solicitation of an offer) to buy or sell any financial products. The information provided does not take into account your specific investment objectives, financial situation or particular needs. Before you act on any recommendation that may be contained in this report, independent advice ought to be sought from a financial adviser regarding the suitability of the investment product, taking into account your specific investment objectives, financial situation or particular needs.
StoneX Financial Pte. Ltd., may distribute reports produced by its respective foreign entities or affiliates within the StoneX group of companies or third parties pursuant to an arrangement under Regulation 32C of the Financial Advisers Regulations. Where the report is distributed to a person in Singapore who is not an accredited investor, expert investor or an institutional investor (as defined in the Securities Futures Act), StoneX Financial Pte. Ltd. accepts legal responsibility to such persons for the contents of the report only to the extent required by law. Singapore recipients should contact StoneX Financial Pte. Ltd. at 6826 9988 for matters arising from, or in connection with the report.
In the case of all other recipients of this report, to the extent permitted by applicable laws and regulations neither StoneX Financial Pte. Ltd. nor its associated companies will be responsible or liable for any loss or damage incurred arising out of, or in connection with, any use of the information contained in this report and all such liability is hereby expressly disclaimed. No representation or warranty is made, express or implied, that the content of this report is complete or accurate.
StoneX Financial Pte. Ltd. is not under any obligation to update this report.
Trading CFDs carries a high level of risk that may not be suitable for some investors. Consider your investment objectives, level of experience, financial resources, risk appetite and other relevant circumstances carefully. The possibility exists that you could lose some or all of your investments, including your initial deposits. If in doubt, please seek independent expert advice. Visit www.forex.com/en-sg/terms-and-policies for the complete Risk Disclosure Statement.