



Bulls Blanch with Bitcoin on the Brink of a Big Bearish Breakdown
A strong selloff from here is a distinct possibility for Bitcoin
Share this:

As is often the case with the nascent asset class, today’s broad-based selloff appears to have little in the way of a fundamental catalyst, but there were certainly technical signs that a big move was likely.
One effective way to identify the potential for large moves is to use a variation of the Bollinger Band indicator. Invented by John Bollinger back in 1980s, Bollinger Bands have become one of the most popular technical indicators today. For the uninitiated, Bollinger Bands consist of a moving average “center line,” with upper and lower lines set two standard deviations above and below that line. These bands create a price envelope that follows an instrument’s price up and down over time, expanding and contracting in response to the underlying market’s recent volatility.
Market volatility tends to be cyclical, meaning that markets alternate between periods of large trending movements and small rangebound trade. When the Bollinger Band Width (the distance between the upper and lower band) contracts, it creates a Bollinger Band “squeeze” setup, suggesting that the market is poised to see a breakout and a return of volatility.
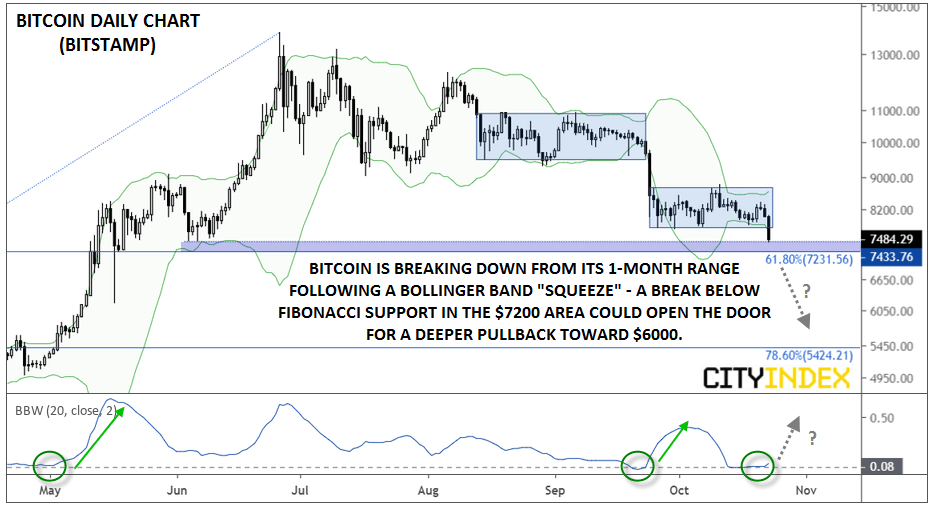
In Bitcoin’s case, prices have spent the last month consolidating in a tight range, reminiscent of the sideways trade we saw from mid-August to late-September. Similarly, the Bollinger Band Width dropped to just 8%, an abnormally low level (for Bitcoin at least!). With price breaking out of its range after the prolonged contraction in volatility, a strong selloff from here is a distinct possibility:
Source: Trading View, City Index
As for the key levels to watch, the June low and 61.8% Fibonacci retracement of this year’s rally converge in the $7200-$7400 area, so bulls do have a clear area to make their stand. If that potential support area is broken, Bitcoin could quickly fall toward $6,000, likely dragging the broader cryptoasset market down with it.
As is often the case with the nascent asset class, today’s broad-based selloff appears to have little in the way of a fundamental catalyst, but there were certainly technical signs that a big move was likely.
One effective way to identify the potential for large moves is to use a variation of the Bollinger Band indicator. Invented by John Bollinger back in 1980s, Bollinger Bands have become one of the most popular technical indicators today. For the uninitiated, Bollinger Bands consist of a moving average “center line,” with upper and lower lines set two standard deviations above and below that line. These bands create a price envelope that follows an instrument’s price up and down over time, expanding and contracting in response to the underlying market’s recent volatility.
Market volatility tends to be cyclical, meaning that markets alternate between periods of large trending movements and small rangebound trade. When the Bollinger Band Width (the distance between the upper and lower band) contracts, it creates a Bollinger Band “squeeze” setup, suggesting that the market is poised to see a breakout and a return of volatility.
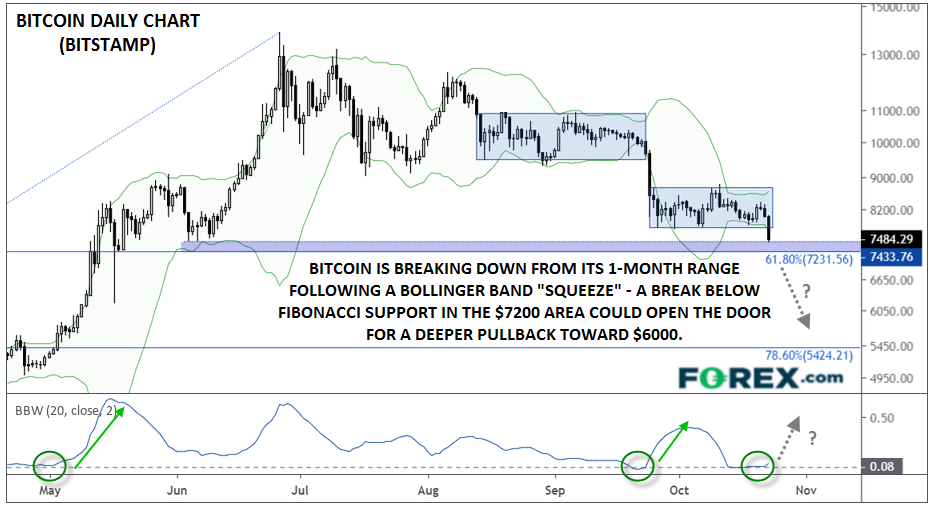
In Bitcoin’s case, prices have spent the last month consolidating in a tight range, reminiscent of the sideways trade we saw from mid-August to late-September. Similarly, the Bollinger Band Width dropped to just 8%, an abnormally low level (for Bitcoin at least!). With price breaking out of its range after the prolonged contraction in volatility, a strong selloff from here is a distinct possibility:
Source: Trading View, FOREX.com
As for the key levels to watch, the June low and 61.8% Fibonacci retracement of this year’s rally converge in the $7200-$7400 area, so bulls do have a clear area to make their stand. If that potential support area is broken, Bitcoin could quickly fall toward $6,000, likely dragging the broader cryptoasset market down with it.
Related tags:




Open an account in minutes
Experience award-winning platforms with fast and secure execution.
Economic calendar
Web Trader platform
Our sophisticated web-based platform is packed with features.
Related articles

Bitcoin, Gold Outlook: Bullish Hold or Bearish Shift?
Bitcoin, Gold Outlook: The dollar’s surge to new 2026 highs and approach toward nine-month resistance are raising near-term reversal risks across precious metals and currency markets. This follows recent declines that pushed Bitcoin below $70,000 and gold below $3,870.


Bitcoin Selloff Deepens as Midterm Sweep Stalls Crypto Bill
The Bitcoin selloff is being driven by hot U.S. inflation data, a Democratic midterm sweep that stalls the CLARITY Act and heavy ETF outflows.


Bitcoin Analysis: BTC Weakness Deepens as Price Approaches $70K
These continue to be challenging sessions for Bitcoin in the short term. The cryptocurrency keeps losing ground consistently and has declined nearly 2.7% over the last three trading sessions, highlighting a phase of weakness that is becoming increasingly relevant within the market.

StoneX Financial Ltd (trading as "FOREX.com") is an execution-only service provider. This material, whether or not it states any opinions, is for general information purposes only and it does not take into account your personal circumstances or objectives. This material has been prepared using the thoughts and opinions of the author and these may change. However, FOREX.com does not plan to provide further updates to any material once published and it is not under any obligation to keep this material up to date.
This material is short term in nature and may only relate to facts and circumstances existing at a specific time or day. Nothing in this material is (or should be considered to be) financial, investment, legal, tax or other advice and no reliance should be placed on it. No opinion given in this material constitutes a recommendation by FOREX.com or the author that any particular investment, security, transaction or investment strategy is suitable for any specific person.
The material has not been prepared in accordance with legal requirements designed to promote the independence of investment research. Although FOREX.com is not specifically prevented from dealing before providing this material, FOREX.com does not seek to take advantage of the material prior to its dissemination. This material is not intended for distribution to, or use by, any person in any country or jurisdiction where such distribution or use would be contrary to local law or regulation. For further details see our full non-independent research disclaimer and quarterly summary.