


USD/JPY, AUD/JPY: Central Bank Divergence Creates Two-Way Risk
USD/JPY eyes a breakout above 160, while AUD/JPY faces further losses as Fed, RBA and BoJ interest rate expectations diverge.
Share this:

The Japanese yen has found some support despite Japan's disappointing GDP figures, as traders weigh the prospect of further Bank of Japan (BoJ) rate hikes against increasingly hawkish expectations for the Federal Reserve.
However, the outlook for yen crosses is far from uniform. While I suspect USD/JPY could eventually break above 160, the prospect of the RBA having reached peak interest rates, alongside further BoJ tightening, could favour bearish continuation for AUD/JPY.
View related analysis:
Why Central Bank Divergence Could Split USD/JPY and AUD/JPY
Japan's Weak GDP Complicates the BoJ's Hawkish Outlook
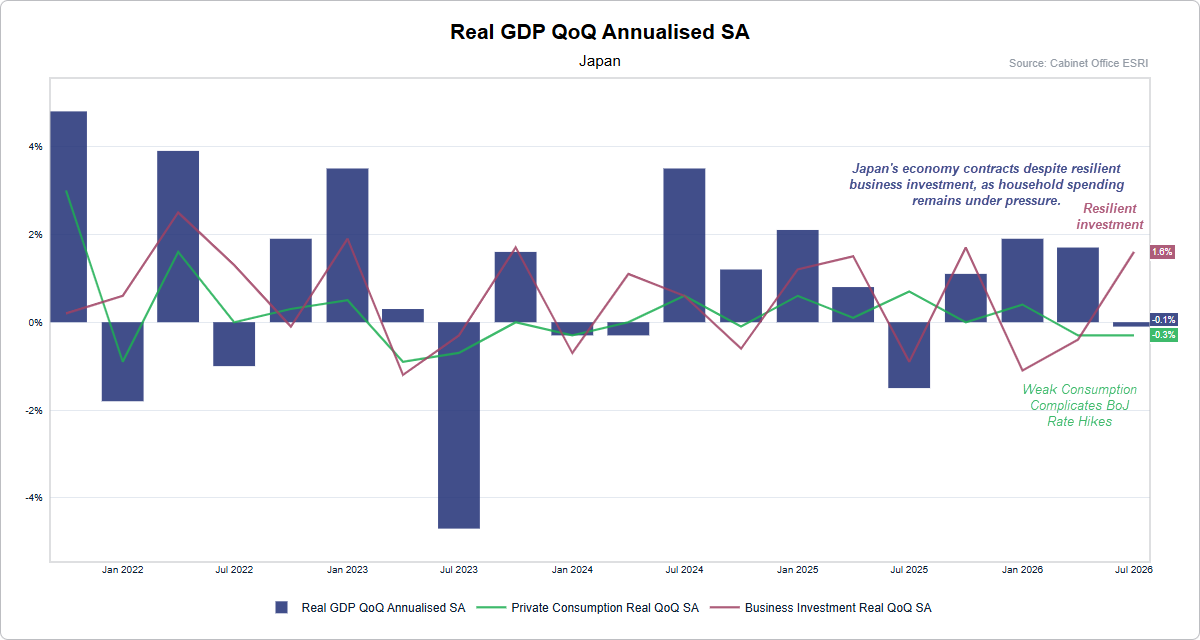
Japan's economy unexpectedly contracted by 0.1% annualised in Q3, compared with expectations for 0.3% growth. Household consumption fell 0.3% over the quarter, highlighting the pressure inflation continues to place on consumers. However, business investment rose 1.6%, partly supported by resilient AI-related spending.
This presents an awkward backdrop for the BoJ, which is expected to raise interest rates again in December despite signs of weakness in domestic demand.
Hawkish board member Hajime Takata reinforced the case for further tightening on Monday, calling for relatively swift rate hikes towards the midpoint of the BoJ's estimated neutral-rate range of 1.1%–2.5%. Although Takata was already advocating higher rates in October, his comments reinforce the central bank's determination to contain inflation.
Market pricing continues to favour a December hike, with OIS-derived estimates around 82%–84% as of Monday.
Fed-BoJ Rate Divergence Supports USD/JPY, While AUD/JPY Faces Pressure
Yet the yen's performance will also depend on how quickly other central banks tighten policy. Markets expect further hikes from both the Fed and BoJ, although the US is projected to retain a sizeable interest-rate advantage through 2027.
The Fed is widely expected to deliver another 25bp hike in December, with stronger inflation and employment data supporting the US dollar. That could keep USD/JPY supported even if the BoJ raises rates next month.
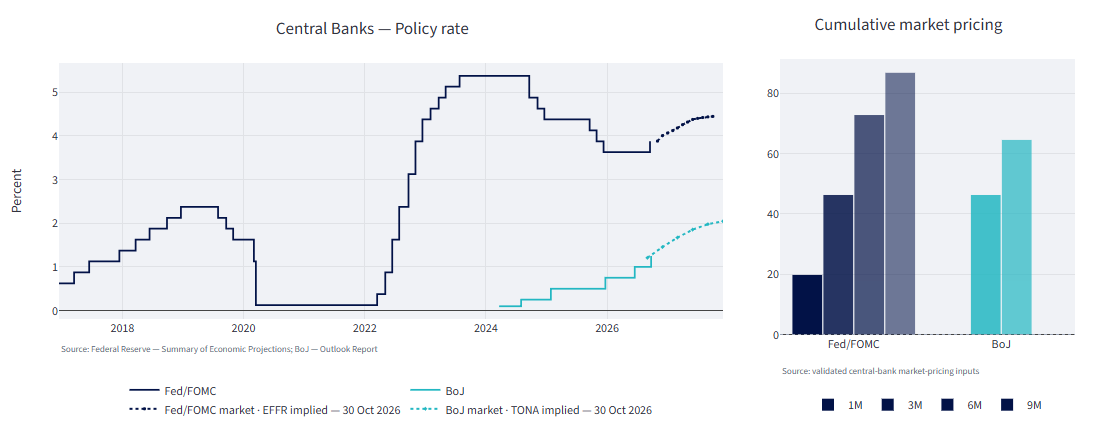
Conversely, the RBA's November hike to 4.85% may prove to be its last, particularly if Australia's labour market continues to soften. With the BoJ still expected to tighten, the relative policy outlook could become increasingly favourable for the yen against the Australian dollar.
This divergence in interest-rate expectations helps explain why I favour different outcomes for USD/JPY and AUD/JPY.
USD/JPY and AUD/JPY Technical Analysis
USD/JPY Bulls Eye Fresh Highs, But Patience May Pay Off
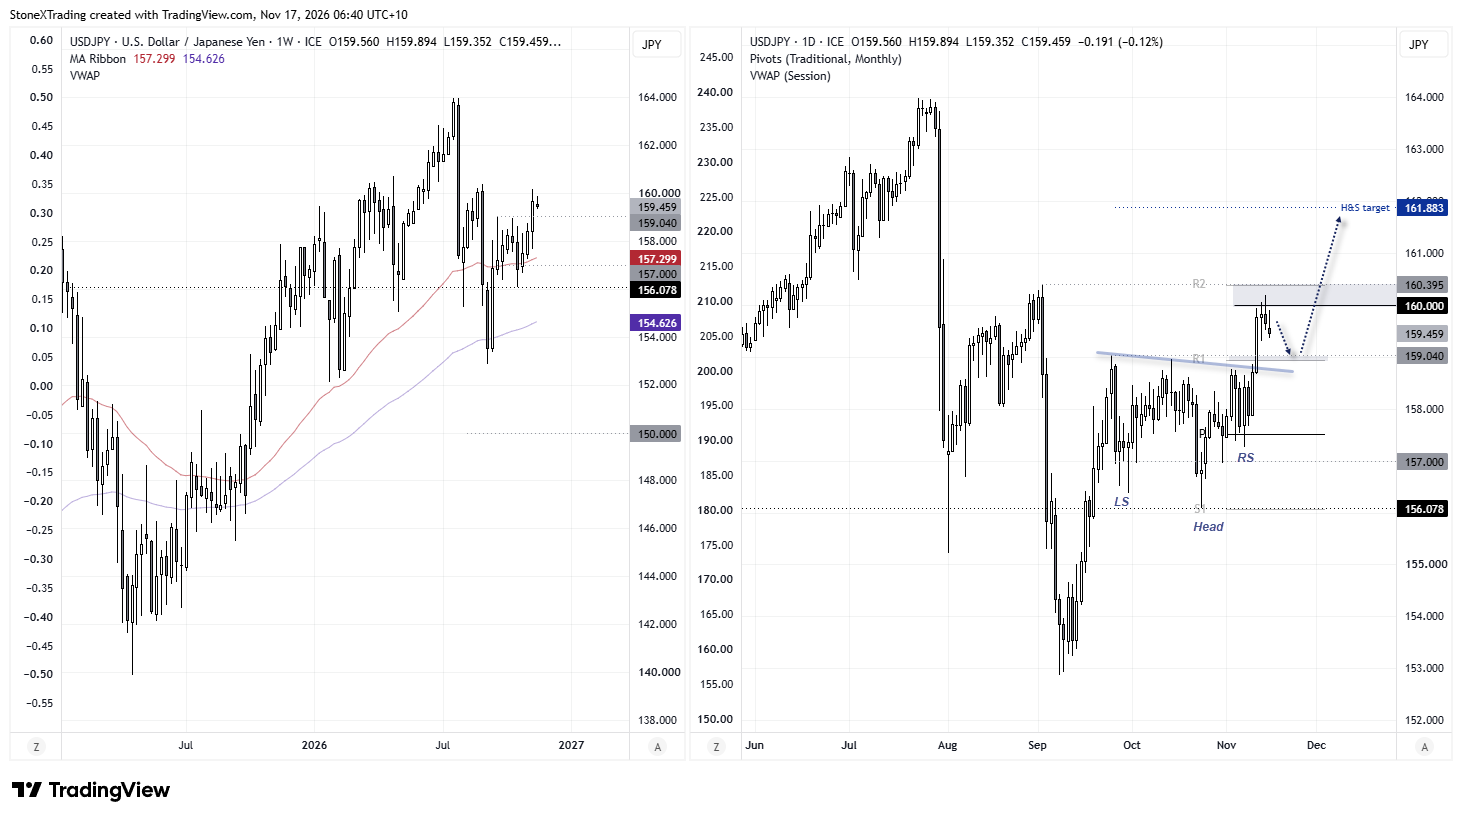
Price action on the USD/JPY daily chart appears increasingly bullish, although bulls may be seeking more favourable prices before recommitting. The 160 handle is the obvious fly in the ointment for now, but a pullback towards 159 could help bulls position themselves for a more attractive reward-to-risk ratio.
Interestingly, an inverted head and shoulders pattern has formed, with the head at 156 and the right shoulder around 157. If successful, the pattern projects an approximate target of 161.88, although USD/JPY would first need to break above 160.40 to confirm the bullish breakout. It would also need to hold above the neckline around 159 for the pattern to remain in play.
Source: ICE, TradingView

AUD/JPY Bears Target 106 as Topping Pattern Confirms Downside Break
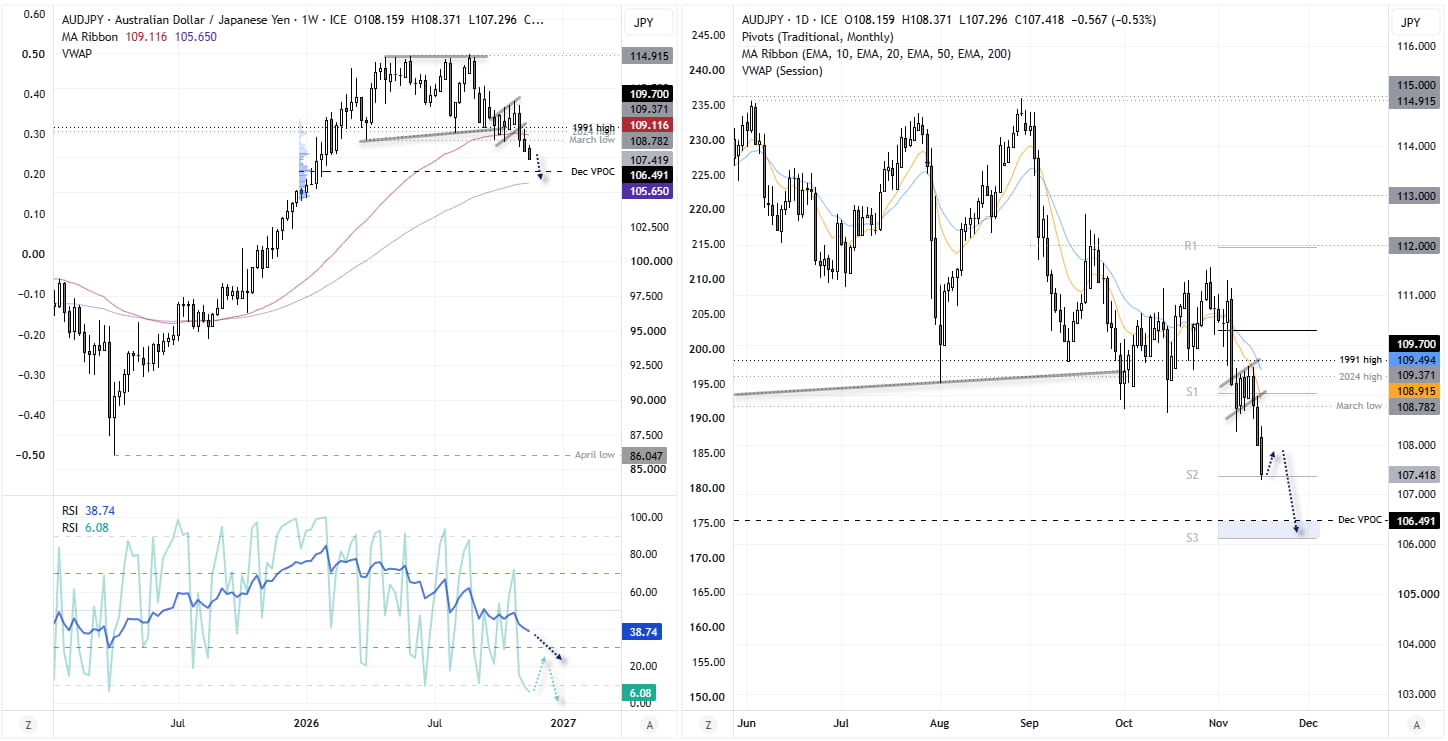
The weekly chart shows AUD/JPY has broken down from its multi-month topping pattern and now appears to be trending towards the December volume point of control (VPOC) at 106.49 or the 100-week EMA (105.65).
The weekly RSI (14) is trending lower alongside prices, but is neither oversold nor showing signs of bullish divergence. The weekly RSI (2) is oversold, warning of near-term downside overextension. However, price structure and RSI (14) suggest bears may be looking to fade rallies.
The daily chart shows AUD/JPY broke down from a bear flag last week, having respected the 10-day EMA as resistance. Bears have retained control for a third day, although prices remain above the monthly R2 pivot point for now.
Regardless, my bias remains to fade rallies, with 106 in sight. The 107 handle and 106.49 VPOC could provide interim support along the way.
Source: ICE, TradingView
Related tags:
Latest market news




Open an account in minutes
Experience award-winning platforms with fast and secure execution.
Economic calendar
Web Trader platform
Our sophisticated web-based platform is packed with features.
Related articles
USD/JPY, AUD/JPY: Central Bank Divergence Creates Two-Way Risk
USD/JPY eyes a breakout above 160, while AUD/JPY faces further losses as Fed, RBA and BoJ interest rate expectations diverge.

AUD/USD Bears Tighten Their Grip Into AU Jobs, RBA Minutes
AUD/USD falls below 68 cents as US dollar strength and peak RBA rate expectations put Australian jobs data and RBA minutes in focus.

Gold, EUR/USD hit 2026 lows as US yields erupt
US Treasury yields have staged one of their largest four-session increases in decades, hammering EUR/USD and gold. But while the euro's decline makes sense, gold's reaction has been extraordinary.

StoneX Financial Ltd (trading as "FOREX.com") is an execution-only service provider. This material, whether or not it states any opinions, is for general information purposes only and it does not take into account your personal circumstances or objectives. This material has been prepared using the thoughts and opinions of the author and these may change. However, FOREX.com does not plan to provide further updates to any material once published and it is not under any obligation to keep this material up to date.
This material is short term in nature and may only relate to facts and circumstances existing at a specific time or day. Nothing in this material is (or should be considered to be) financial, investment, legal, tax or other advice and no reliance should be placed on it. No opinion given in this material constitutes a recommendation by FOREX.com or the author that any particular investment, security, transaction or investment strategy is suitable for any specific person.
The material has not been prepared in accordance with legal requirements designed to promote the independence of investment research. Although FOREX.com is not specifically prevented from dealing before providing this material, FOREX.com does not seek to take advantage of the material prior to its dissemination. This material is not intended for distribution to, or use by, any person in any country or jurisdiction where such distribution or use would be contrary to local law or regulation. For further details see our full non-independent research disclaimer and quarterly summary.