



ASX 200 Outlook: Second-Best Day in 11 Months, FMG and GMG in Focus
ASX 200 posts its second-best day in 11 months as softer inflation fails to convince. FMG and GMG setups point to key technical turning points.
Share this:

The ASX 200 has staged a strong rebound, logging its second-best day in 11 months despite inflation remaining well above the RBA’s target. While softer CPI offered short-term relief, underlying price pressures and geopolitical risks continue to shape the outlook. Against this backdrop, traders are watching whether the index can build on recent gains, while key stocks such as Fortescue (FMG) and Goodman Group (GMG) approach important technical inflection points.
View related analysis:
View related analysis:
ASX 200 rebounds on ‘soft’ CPI, FMG and GMG approach key technical levels
‘Softer’ inflation unlikely to ease cost-of-living concerns
Inflation data for February came in slightly softer than expected, though there is little to celebrate as CPI remains well above the RBA’s target and we are yet to see the full impact from the Middle East. Consumers tend to gauge inflation in real time at the pump, so headlines of ‘softer inflation’ are unlikely to resonate. Besides, trimmed mean sits at 3.3% — just 0.1 percentage points below forecast and still 0.3 points above the RBA’s upper band.


ASX 200 rebound warns bears as key levels reclaimed
Still, it was enough to help the ASX 200 post its second-best day since April and close at a four-day high. With prices also back above the September low, it should serve as a warning to bears that they may have pushed their luck. Unless a fresh bearish catalyst emerges from Middle Eastern developments, near-term risks for the ASX appear skewed to the upside.
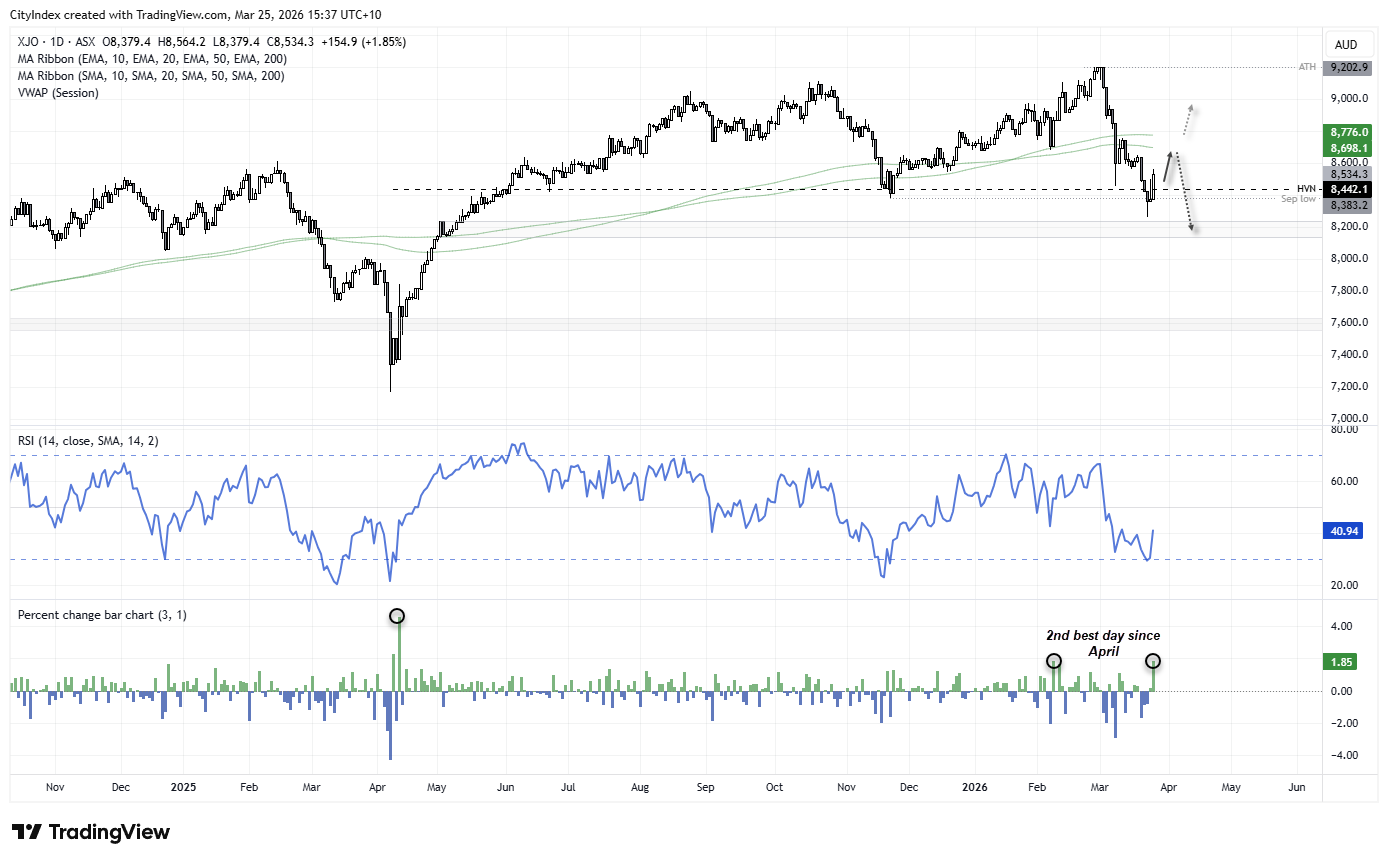
Source: ASX, LSEG
Fortescue (FMG) Technical Analysis
There are several technical clues suggesting an important swing low may have formed on Monday. It has been three months since FMG printed a double top across December and January, which led to an -18.5% decline.
The weekly chart shows an elongated bullish engulfing candle formed two weeks ago around a high-volume node (HVN), the 50-week SMA, and the 38.2% Fibonacci retracement level. A bullish divergence also formed on the RSI (2). While two trading days remain this week, FMG is on track to print another bullish engulfing candle.
The daily chart shows a strong gap higher on Tuesday above the 200-day SMA, with momentum extending higher today. Bulls could look for dips towards the gap low around 19 and maintain a bullish bias while price holds above the double bottom low at 18.50. A break above 21 would invalidate the bearish move from the double top highs and suggest the rally from the 2025 low has resumed.
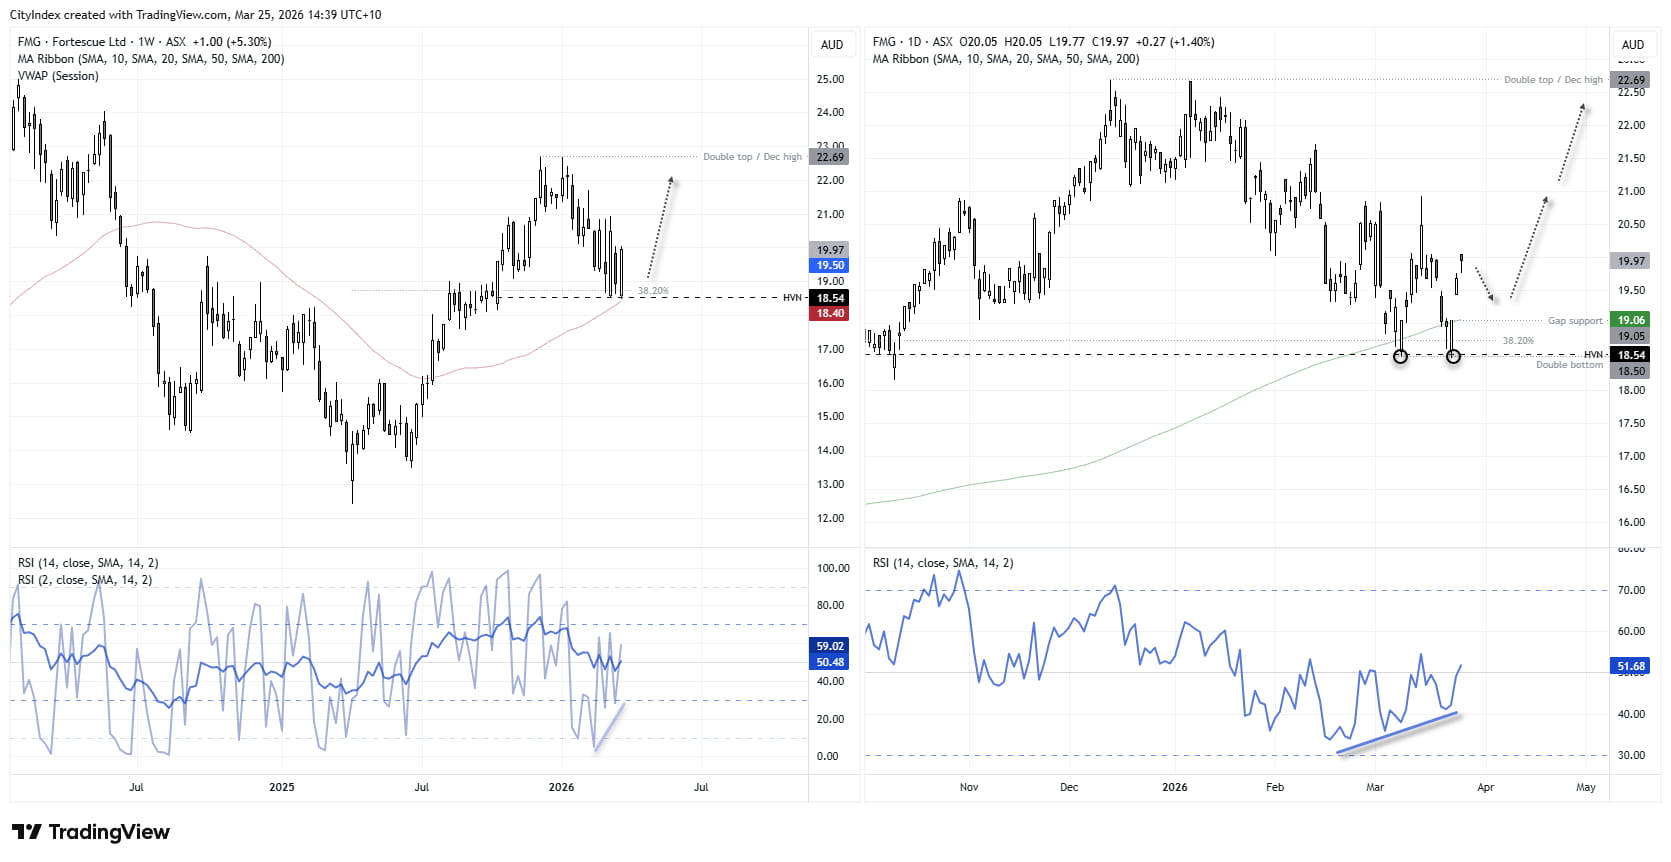
Source: ASX, LSEG
Goodman Group (GMG) Technical Analysis
This is a stock attempting to stabilise after a heavy bout of selling, although I’m not convinced bulls will get their way for long without a genuine catalyst. GMG has fallen -35% from its August high, with -22.9% of that decline occurring over the past seven weeks.
For now, the April low appears to be providing support. Like FMG, it is attempting to form a bullish engulfing week, so there is scope for a near-term bounce if GMG can avoid a fresh break lower.
However, with the dominant trend still pointing lower, rallies are likely to be sold into. Gap resistance around 27 and the prior support band just above 28 stand out as near-term upside targets for bulls and potential fade zones for bears.
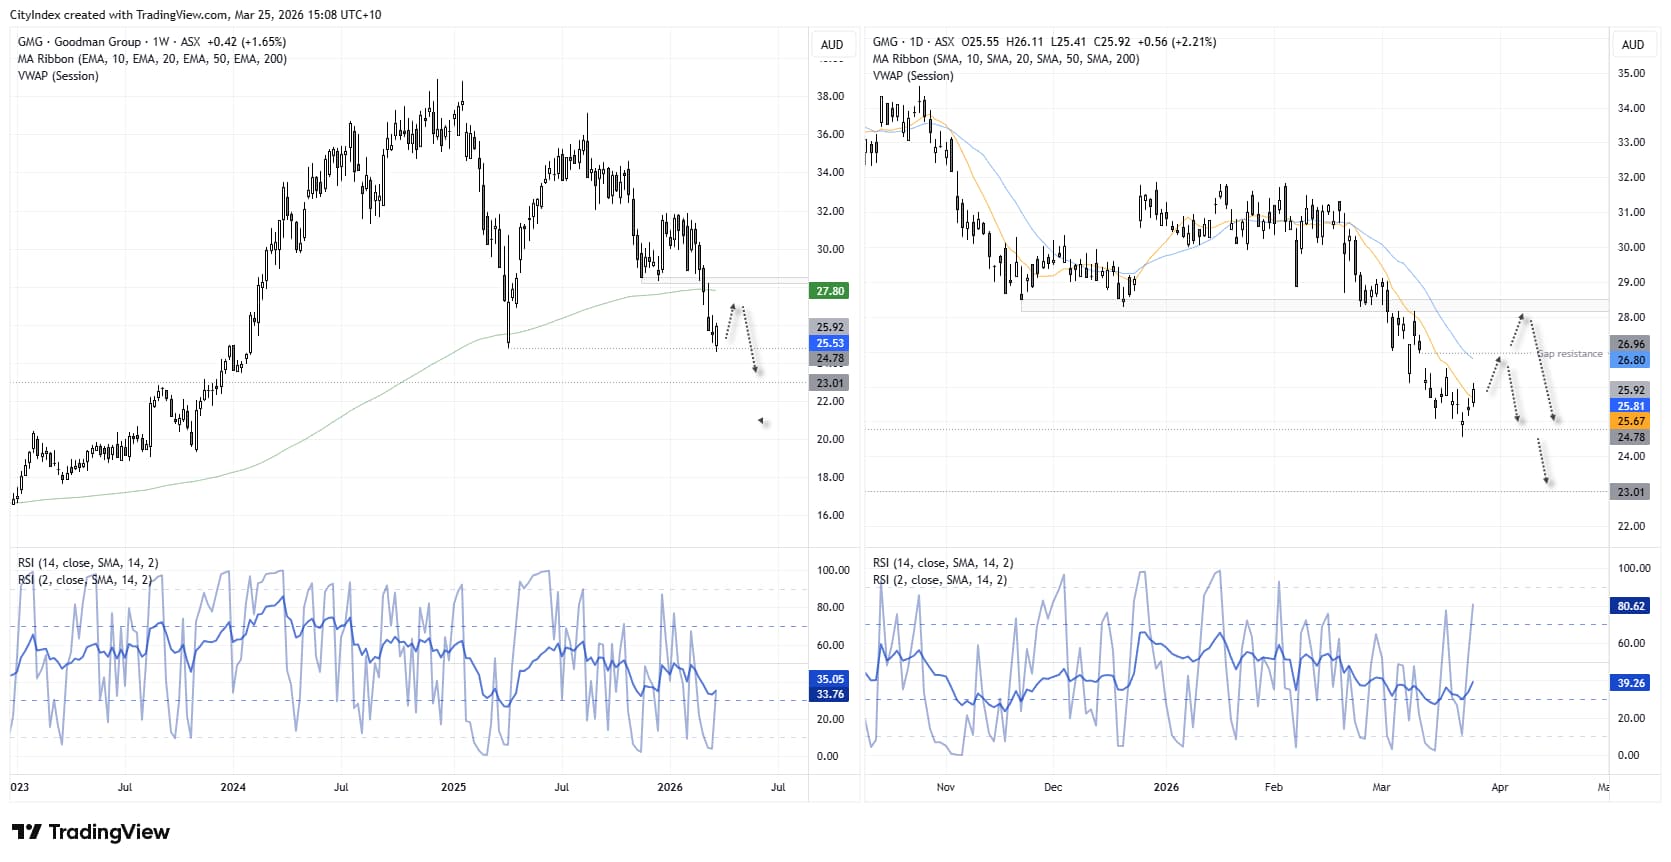
Source: ASX, ASX24, TradingView
View the full economic calendar
View the full economic calendar
-- Written by Matt Simpson
Follow Matt on Twitter @cLeverEdge
How to trade with City Index
You can trade with City Index by following these four easy steps:
- Open an account, or log in if you’re already a customer
• Open an account in the UK
• Open an account in Australia
• Open an account in Singapore
- Search for the market you want to trade in our award-winning platform
- Choose your position and size, and your stop and limit levels
- Place the trade
Related tags:



Open an account in minutes
Experience award-winning platforms with fast and secure execution.
Economic calendar
Web Trader platform
Our sophisticated web-based platform is packed with features.
Related articles

Nikkei swings harder than Nasdaq as AI fears deepen
Nikkei 225 volatility is running well ahead of Nasdaq 100, with the index construction and Japan's heavy exposure to AI manufacturing potentially explaining the difference.

S&P 500, Nasdaq 100 Claw Back But NVDA Cloud Looms Overhead
Last week was green for both the Nasdaq and S&P 500 but given the sell-off that led into that bounce there’s still a very real question as to whether bears still have a statement to make. And the NVDA situation presents a very real threat.


Nasdaq 100 forecast: Nvidia troubles put AI recovery into question
The recovery for major indices this week has helped repair much of the technical damage inflicted by last week’s sell-off, but the latest developments with Nvidia suggest investors are not quite ready to put the underlying risks behind them. The Nasdaq 100 led other US index futures lower overnight, with falls of around 0.8%.

StoneX Financial Ltd (trading as "FOREX.com") is an execution-only service provider. This material, whether or not it states any opinions, is for general information purposes only and it does not take into account your personal circumstances or objectives. This material has been prepared using the thoughts and opinions of the author and these may change. However, FOREX.com does not plan to provide further updates to any material once published and it is not under any obligation to keep this material up to date.
This material is short term in nature and may only relate to facts and circumstances existing at a specific time or day. Nothing in this material is (or should be considered to be) financial, investment, legal, tax or other advice and no reliance should be placed on it. No opinion given in this material constitutes a recommendation by FOREX.com or the author that any particular investment, security, transaction or investment strategy is suitable for any specific person.
The material has not been prepared in accordance with legal requirements designed to promote the independence of investment research. Although FOREX.com is not specifically prevented from dealing before providing this material, FOREX.com does not seek to take advantage of the material prior to its dissemination. This material is not intended for distribution to, or use by, any person in any country or jurisdiction where such distribution or use would be contrary to local law or regulation. For further details see our full non-independent research disclaimer and quarterly summary.