



BTC/USD Breaks Higher. Is the Bitcoin Tide Turning?
Bullish signals and momentum shifts hint at a trend reversal. Is it time to position for upside?
Share this:

- Dips below $108K bought aggressively
- BTC/USD breaks downtrend, momentum bullish
- Watch $113,500 support and $116K resistance.
Summary
The tide may be turning for BTC/USD.
With buyers lining up to buy dips below $108,000 last week, delivering an engulfing candle on Thursday, the bullish signals continue to pile up for bitcoin. Earlier today, the price smashed through the downtrend from the record highs, helped by extremely elevated risk appetite that has seen major equity indices across Asia surge to record levels.
With bullish momentum signals being triggered across an increasing number of timeframes, the path of least resistance may now be higher, not lower.
BTC/USD Bear Phase Over?
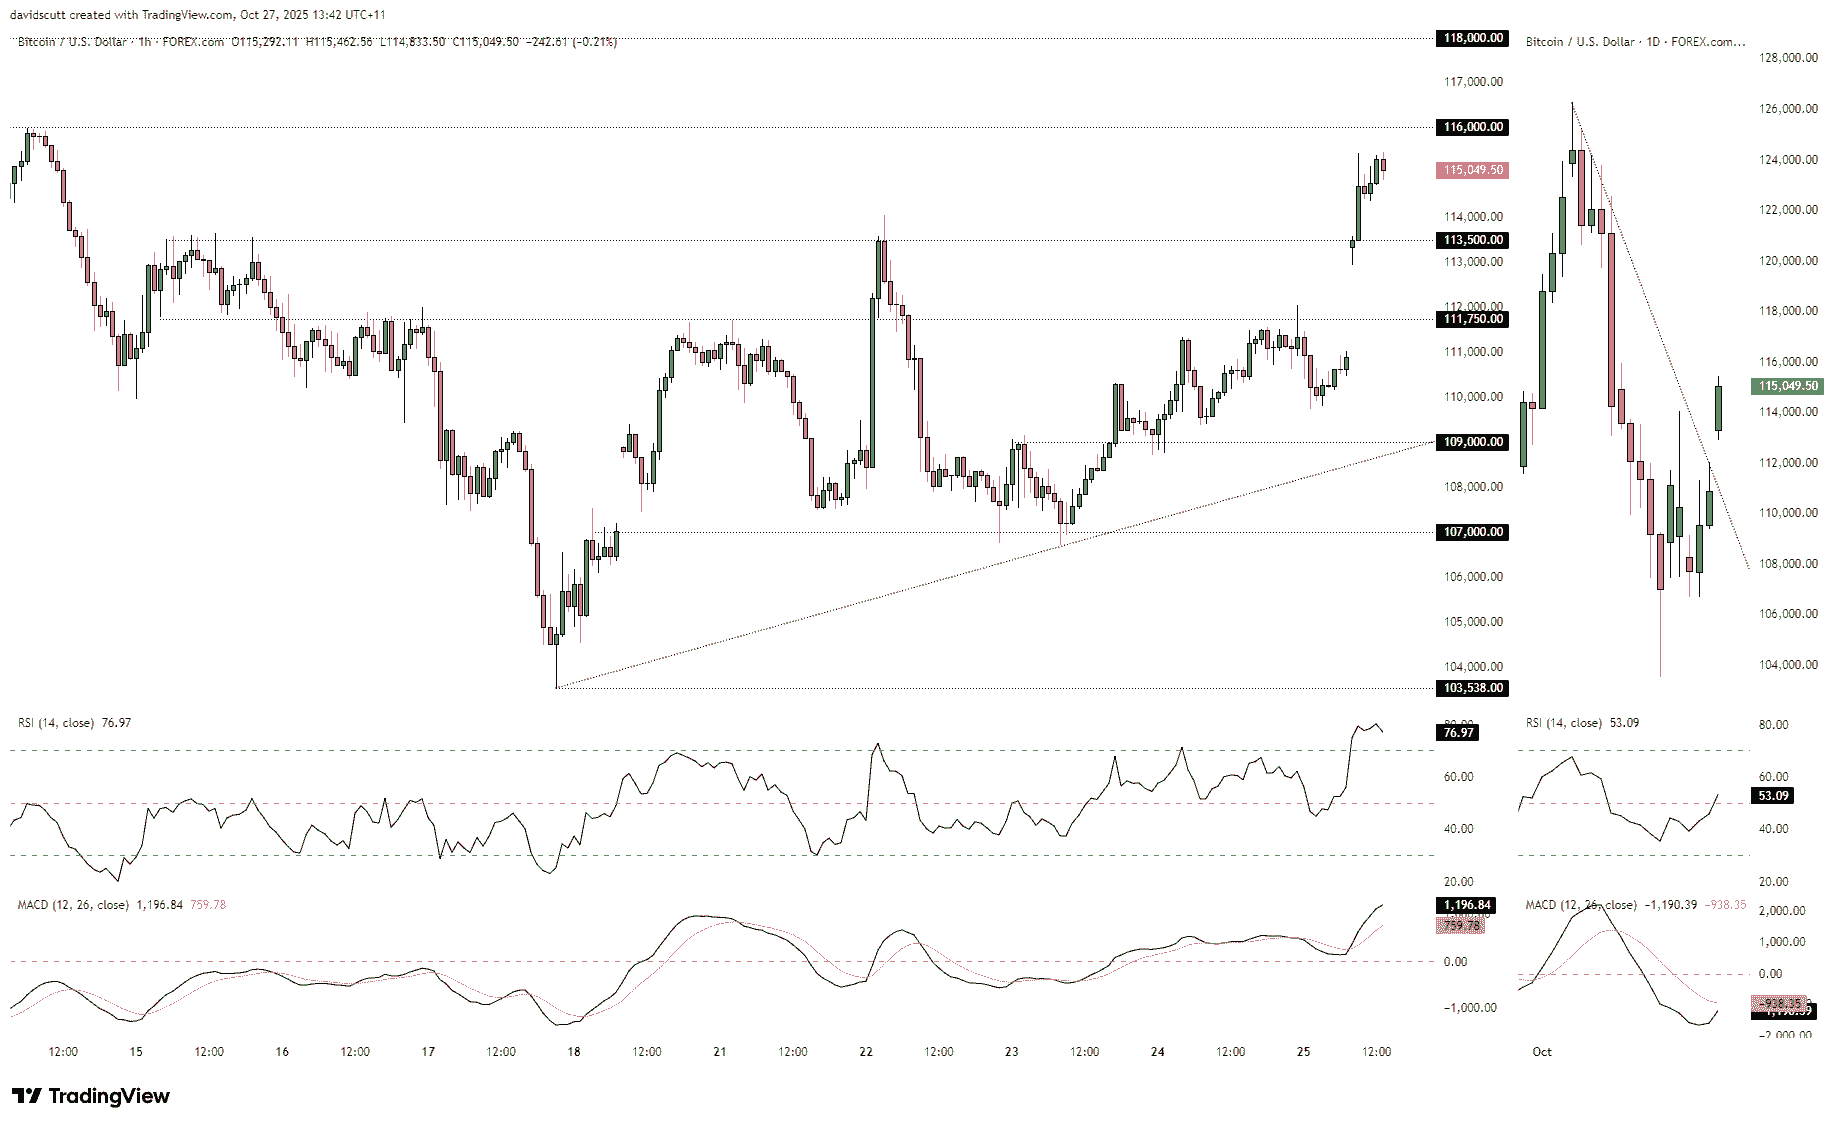
The chart below is split into two panes, with the larger one on the left looking at BTC/USD price action using an hourly tick while the smaller one on the right is the daily. This not only makes it easier to see relevant levels for shorter timeframes but also longer-term signals and trends, providing a decent indicator of where directional risks may lie. Right now, the latter suggests the bearish trend seen this month may have run its course.
Source: TradingView
Prior to the downtrend break seen earlier today, bearish moves beneath $108,000 were continuously bought over the past fortnight. The last iteration on Thursday delivered an engulfing candle, with the bullish signal proving accurate given the price action since.
The momentum picture on the daily timeframe is also shifting, with RSI (14) trending higher above 50, delivering an increasingly bullish signal. MACD has yet to confirm but is rapidly approaching the signal line from below, on track to deliver a crossover in negative territory that reinforces the view that the tide may be turning.
Turning to the hourly chart, it gives a sense of the levels to consider when assessing potential setups. Bulls made quick work of resistance above $113,500 early in the session, pushing the price to multi-week highs. Above where BTC/USD currently trades, resistance is located at $116,000, a level that capped the price over two days earlier this month.
On the downside, $113,500 may now revert to offering support, providing a potential entry level for bulls where longs could be established above with a stop beneath for protection. Given the price is struggling above $115,000 right now, a pullback is not out of the realms of possibility in the short term.
If the bullish trend seen earlier in the session resumes, $116,000 is another level that could be used to establish positions, offering both bullish and bearish setups depending on how the price interacts with it should it get there. A clean break above would allow for longs to be set with a stop beneath, targeting resistance at $118,000. But if it can’t break above the level, another option would be to set shorts below with a stop above, targeting either $114,400 where bids were noted earlier today or even $113,500.
RSI (14) sits above 70, indicating overbought conditions on the hourly that warn of near-term reversal risk. MACD continues to deliver a bullish message, crossing the signal line from below in positive territory earlier before trending higher. Unless you’re an ultra short-term scalper, the preference would be to buy dips given the macro environment.
Related tags:
Latest market news




Open an account in minutes
Experience award-winning platforms with fast and secure execution.
Economic calendar
Web Trader platform
Our sophisticated web-based platform is packed with features.
Related articles
British Pound Short-term Outlook: GBP/USD 3% Plunge Hits 12-Month Low—Key Support in Focus 11 19 2026
Sterling’s October rebound has unraveled, leaving GBP/USD bears in control—but stretched momentum raises the stakes for the weekly close

Nasdaq 100 forecast: Markets turn jittery as Anthropic debuts at 34% above IPO
Nasdaq futures were up some 2% earlier, but shortly after the Anthropic debut, the index slumped to session lows, down more than 1.5%, before bouncing back from the lows at the time of writing. Much of the selling for the Nasdaq was driven by AMD which slumped nearly 10% after a Hunterbrook Media report raised fresh questions about the company’s exposure to US export controls on China.


Australian Dollar Technical Outlook: AUD/USD 6% Plunge Tests Make-or-Break Support at Yearly Low 11 19 2026
AUD/USD’s four-week decline is testing critical support, with a decisive break below this threshold needed to fuel the next major leg lower.
StoneX Financial Ltd (trading as "FOREX.com") is an execution-only service provider. This material, whether or not it states any opinions, is for general information purposes only and it does not take into account your personal circumstances or objectives. This material has been prepared using the thoughts and opinions of the author and these may change. However, FOREX.com does not plan to provide further updates to any material once published and it is not under any obligation to keep this material up to date.
This material is short term in nature and may only relate to facts and circumstances existing at a specific time or day. Nothing in this material is (or should be considered to be) financial, investment, legal, tax or other advice and no reliance should be placed on it. No opinion given in this material constitutes a recommendation by FOREX.com or the author that any particular investment, security, transaction or investment strategy is suitable for any specific person.
The material has not been prepared in accordance with legal requirements designed to promote the independence of investment research. Although FOREX.com is not specifically prevented from dealing before providing this material, FOREX.com does not seek to take advantage of the material prior to its dissemination. This material is not intended for distribution to, or use by, any person in any country or jurisdiction where such distribution or use would be contrary to local law or regulation. For further details see our full non-independent research disclaimer and quarterly summary.