Canadian Dollar Technical Outlook: USD/CAD Short-term Trade Levels
- USD/CAD remains in a well-defined October range after extending a five-week advance from the September low
- The rally has stalled directly beneath a major resistance zone, with bearish momentum divergence warning that the advance may be vulnerable.
- A confirmed break above the range ceiling would strengthen the continuation case and expose the next major upside objectives
- The monthly range low remains the key near-term support threshold for preserving the bullish structure.
- Hotter U.S. CPI has revived near-term Fed tightening expectations, with PPI, retail sales, and additional Fed commentary next in focus.
- Resistance 1.4292 (key), 1.4375/83, 1.4496-1.4513- Support 1.4194-1.4202 (key), 1.4140, 1.4083
USD/CAD remains firm after a powerful September advance, but the latest push has run into a major technical ceiling, and momentum is beginning to show signs of strain. Price is now holding within a well-defined monthly range, leaving the immediate focus on whether buyers can force a decisive break higher or whether the current stall develops into a deeper correction. Today’s hotter-than-expected U.S. CPI has added fresh support to the dollar by reviving expectations for near-term Fed tightening, but the technical picture remains finely balanced as traders look to upcoming U.S. data and the weekly close for confirmation of the next move. Battle lines drawn on the USD/CAD short-term technical charts.
Review my latest Weekly Strategy Webinar for an in-depth breakdown of this Loonie setup and more. Join live on Monday’s at 8:30am EST.
Canadian Dollar Price Chart – USD/CAD Daily
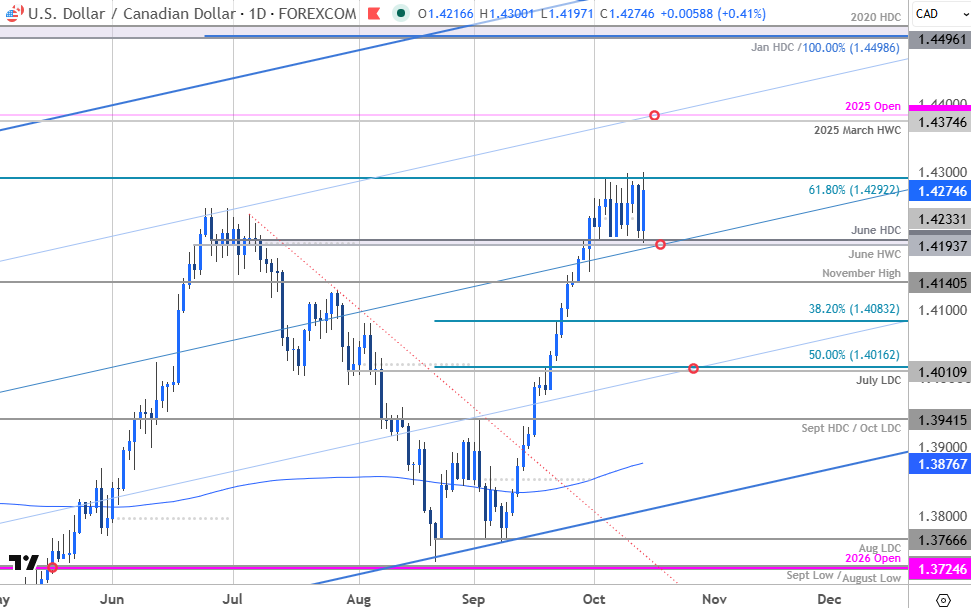
Chart Prepared by Michael Boutros, Sr. Technical Strategist; USD/CAD on TradingView
Technical Outlook: In last month’s Canadian Dollar Short-term Outlook, we noted that USD/CAD was, “testing pivotal resistance and the reaction off this mark will likely fuel the next directional move in price. From a trading standpoint, losses would need to be limited to 1.3854 IF price is heading higher on this stretch with a close above 1.3955 still needed to fuel the next major leg of the advance.” USD/CAD broke through resistance the following day with a five-week advance extending more than 3.9% off the September low.
The rally is testing major resistance at the 61.8% retracement of the 2025 decline at 1.4292 with a well-defined October opening-range taking shape just below. Note that the median line of the yearly pitchfork converges on the June high day / high week close at 1.4194-1.4202 and now defines the monthly range low. The immediate focus is on a breakout in the days ahead to confirm the next directional move in USD/CAD.
Canadian Dollar Price Chart – USD/CAD 240min
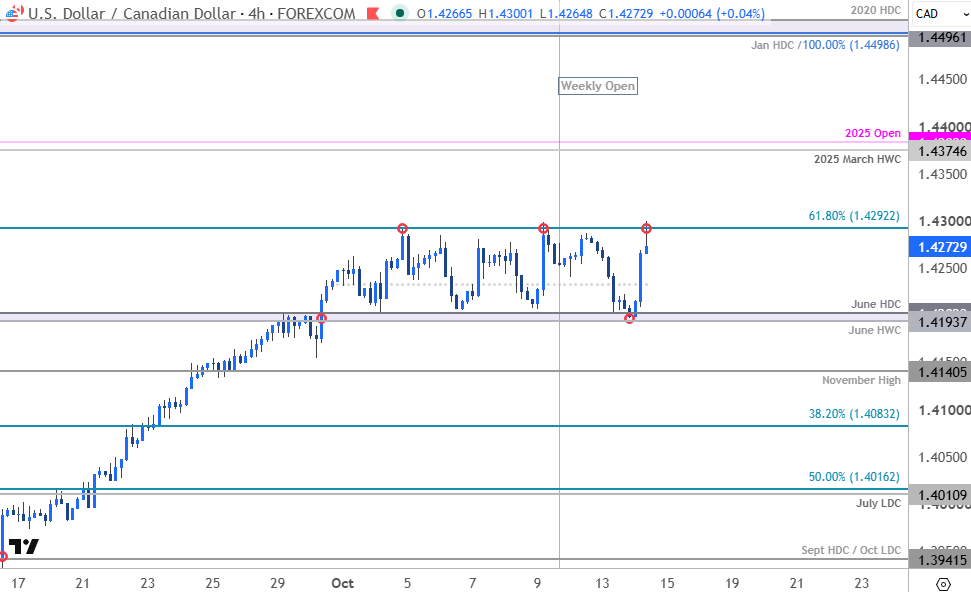
Chart Prepared by Michael Boutros, Sr. Technical Strategist; USD/CAD on TradingView
Notes: A closer look at USD/CAD price action highlights this 100 pip multi-week range between key technical levels. A topside breach / daily close above 1.4292 is needed to mark uptrend resumption with subsequent resistance objectives eyed at the 2025 March high-week reversal close (HWC) and the 2025 yearly open at 1.4375/83. The next major technical consideration is eyed at 1.4496-1.4513 – a region defined by the 2025 January high day close (HDC), the 100% extension of the yearly advance, and the 2020 HDC. Both these levels represent areas of interest for possible topside exhaustion / price inflection IF reached.
A break below the monthly low would threaten a larger correction within the yearly uptrend with subsequent support objectives eyed at the November high at 1.4140 and the 38.2% retracement of the late-August rally at 1.4083. Key support rests with the July low day close (LDC) and the 50% retracement at 1.4011/16. Note that this level converges on the 25% parallel of the yearly pitchfork (daily chart) and losses below this threshold would suggest a more significant trend reversal is underway.
Bottom line: USD/CAD is trading within a well-defined monthly range just below key resistance. Bearish momentum divergence on the daily chart warns that the rally may be vulnerable here despite today’s push post-CPI. From a trading standpoint, the focus remains on a breakout of this key zone – ultimately, losses would need to be limited to 1.4194 IF price is heading higher on this stretch with a breach / daily close above 1.4292 needed to fuel the next major leg of the advance.
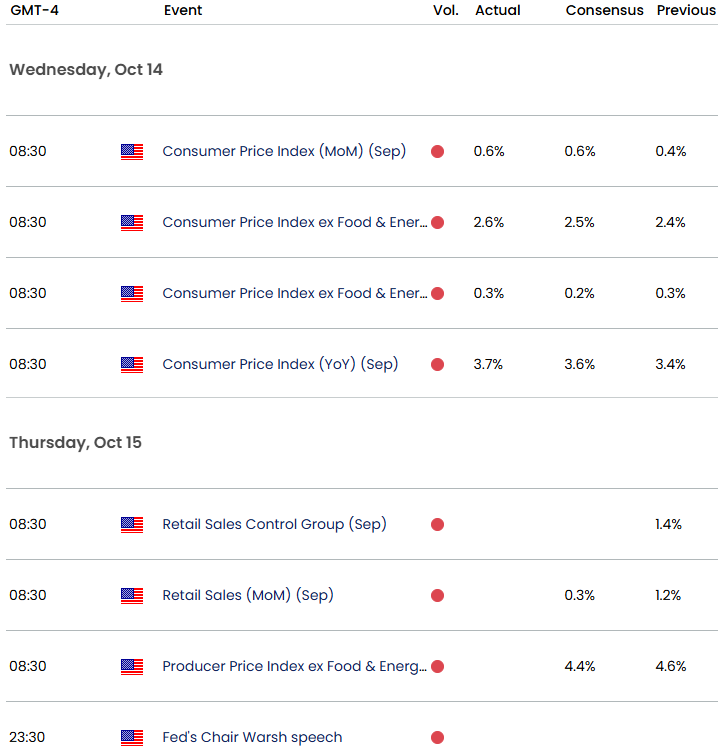
Event risk remains elevated for USD/CAD into the close of the week following today’s hotter-than-expected U.S. CPI report, which showed headline inflation accelerating to 3.7% year over year in September with core prices also climbing to 2.6%. The data has revived expectations for near-term Federal Reserve tightening and lifted Treasury yields, providing fresh support for the U.S. dollar. Attention now turns to Thursday’s U.S. PPI and retail-sales reports, followed by industrial-production data and additional Fed commentary on Friday. With Canada’s next major inflation release not due until October 19, the near-term impulse for USD/CAD remains centered on U.S. data and rate expectations. Stay nimble into the releases and watch the weekly close for guidance. Review my latest Canadian Dollar Weekly Forecast for a closer look at the longer-term USD/CAD technical trade levels.
Key USD/CAD Economic Data Releases
Economic Calendar - latest economic developments and upcoming event risk.
Active Short-term Technical Charts
- Japanese Yen Short-term Outlook: USD/JPY Breakout Risk Builds Below 200-Day Average
- Australian Dollar Short-term Outlook: AUD/USD Rebound Challenges September Downtrend
- US Dollar Short-term Outlook: USD Four-Week Rally Stalls Below Key Resistance
- Swiss Franc Short-term Outlook: USD/CHF Rebound Tests Broken Uptrend
- Euro Short-term Outlook: EUR/USD Selloff Nears Critical Yearly Support
- British Pound Short-term Outlook: GBP/USD Selloff Breaks June Uptrend
- Gold Price Short-term Outlook: XAU/USD Bulls Fight to Stabilize at Pivotal Support
Written by Michael Boutros, Senior Technical Strategist
Follow Michael on X @MBForex