EUR/USD falls to a 10-week low despite Eurozone growth picking up
EUR/USD has fallen to a 10-week low, down around 2.4% over the past month amid USD strength and despite stronger-than-expected Eurozone PMI data.
Eurozone PMI data showed that business activity grew at a faster pace in September. The service sector PMI rose to 53.0, up from 51.6 in August and ahead of expectations of 51.7. Manufacturing PMI remained unchanged at 52.7, in line with forecasts, while the composite PMI, considered a good gauge of overall business activity, rose to 53.1, defying expectations of a decline to 51.5 and hitting a 41-month high.
Even solid economic data is failing to offer support to the euro, which is coming under increasing pressure amid a growing Fed-ECB divide.
Last week, the Federal Reserve hiked interest rates by 25 basis points and signalled that another rate hike could come before the end of the year, offering further support to the greenback, which now trades at a seven-week high.
The euro has a more complicated backdrop. Inflation risks remain high owing to the jump in energy prices linked to tensions in the Middle East, increasing costs for both households and businesses. However, the ECB faces the difficult balancing act of keeping inflation under control while avoiding unnecessary pressure on a fragile economy.
ECB Vice President Vogt noted that persistent energy costs could eventually weaken consumption and economic growth. This contrasts with the more hawkish stance heard from Fed officials this week.
The Fed-ECB divergence remains a clear driver for EUR/USD. The Fed is gearing up for additional hikes, while the ECB has less room to manoeuvre. The market is now pricing in a 53% probability of another Fed rate hike at the October meeting.
EUR/USD forecast – technical analysis
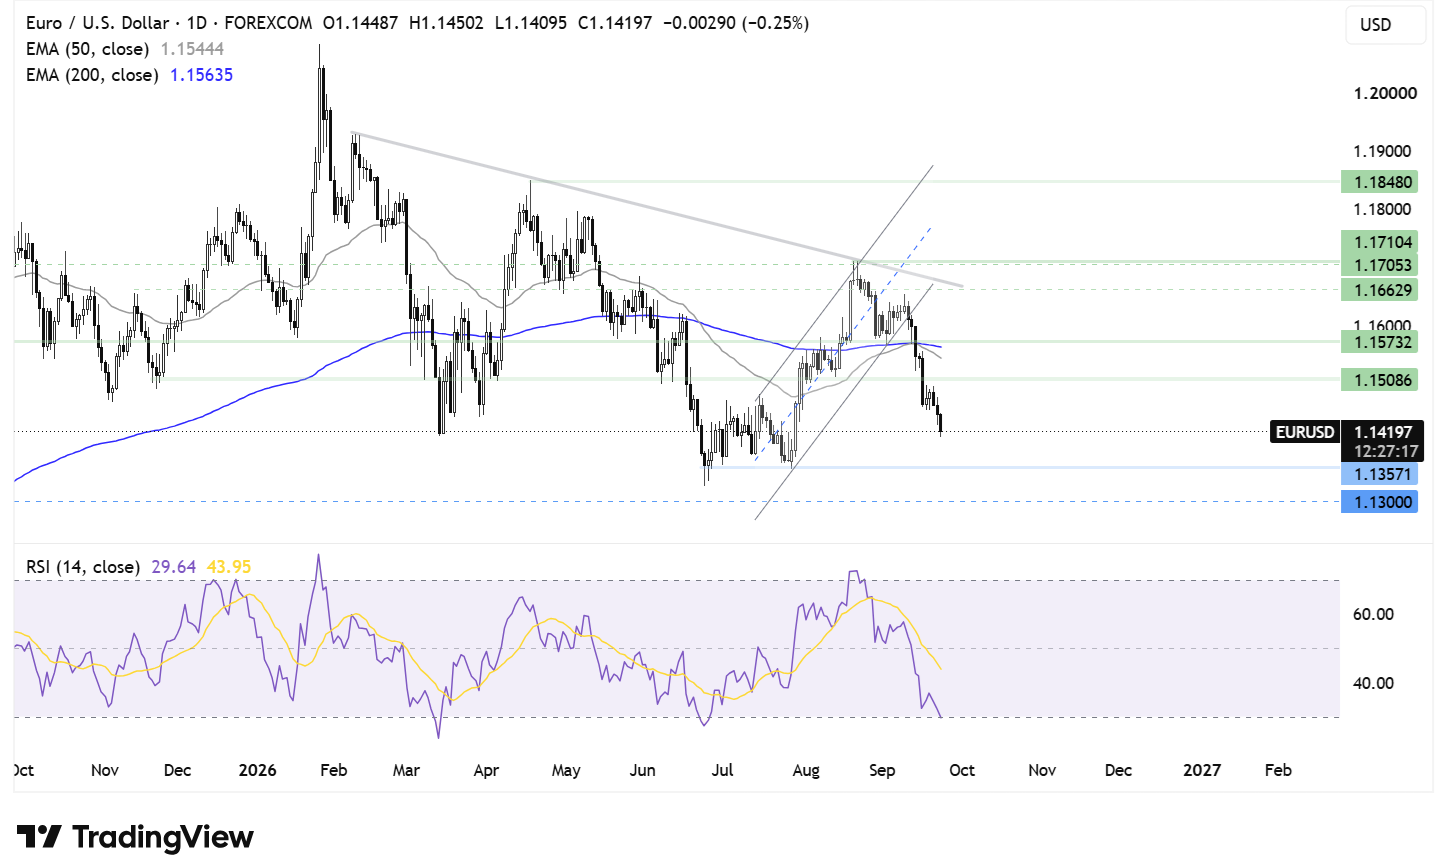
EUR/USD has broken down below its rising channel and is trading below its 50 and 200 EMAs, keeping the technical picture bearish. The price has fallen to 1.1415 at the time of writing, as sellers look towards 1.1350, the July 27 low. A break below here opens the door to a deeper sell-off towards 1.1300.
Any recovery would first need to rise above 1.1500. Above here, attention turns to 1.1570, the 200 EMA and horizontal resistance. A break above this area would put the pair on a more stable footing.
Gold under pressure as a stronger USD offsets falling oil prices
Gold has fallen towards $4,320 on Wednesday as the market weighs the latest developments surrounding the Middle East, easing inflation fears and expectations for further Fed rate hikes.
Markets have been following the latest U.S.-Iran talks, with Iran setting conditions for reopening the Strait of Hormuz, while President Trump has hailed good progress in discussions. At the same time, Saudi Arabia is working to restore oil flows through the East-West pipeline. Together, these developments have helped Brent fall below $100 a barrel as supply concerns ease.
The drop in oil prices should ease inflationary fears and reduce pressure for further Fed rate hikes, which would normally be supportive for gold.
However, at the same time, the dollar is trading at a two-month high on expectations that the Federal Reserve will keep interest rates elevated for longer in order to curb persistent inflation.
The Fed hiked rates by 25 basis points last week and pointed to further rate hikes before the end of the year. Fed speakers this week have also been supportive of further tightening. Richmond Fed President Tom Barkin warned that inflationary shocks could take time to subside, while Boston Fed President Susan Collins said she supported last week's rate hike amid concerns that future inflation could remain above target. The market is pricing in a 53% probability of a Fed rate hike in October.
This hawkish stance has helped the dollar rise to a two-month high, putting pressure on U.S.-dollar-denominated gold. While gold is seen as a hedge against inflation, its appeal fades when higher interest rates increase returns on yield-bearing investments.
Elsewhere, China's gold imports through August surpassed 1,000 tonnes, already exceeding the full-year total for 2025, amid strong investment demand.
Markets will now look to U.S. PMI data for clues about the health of the U.S. economy. Strong economic activity combined with signs of continued price pressures could boost the dollar and put further pressure on gold.
Gold forecast – technical analysis
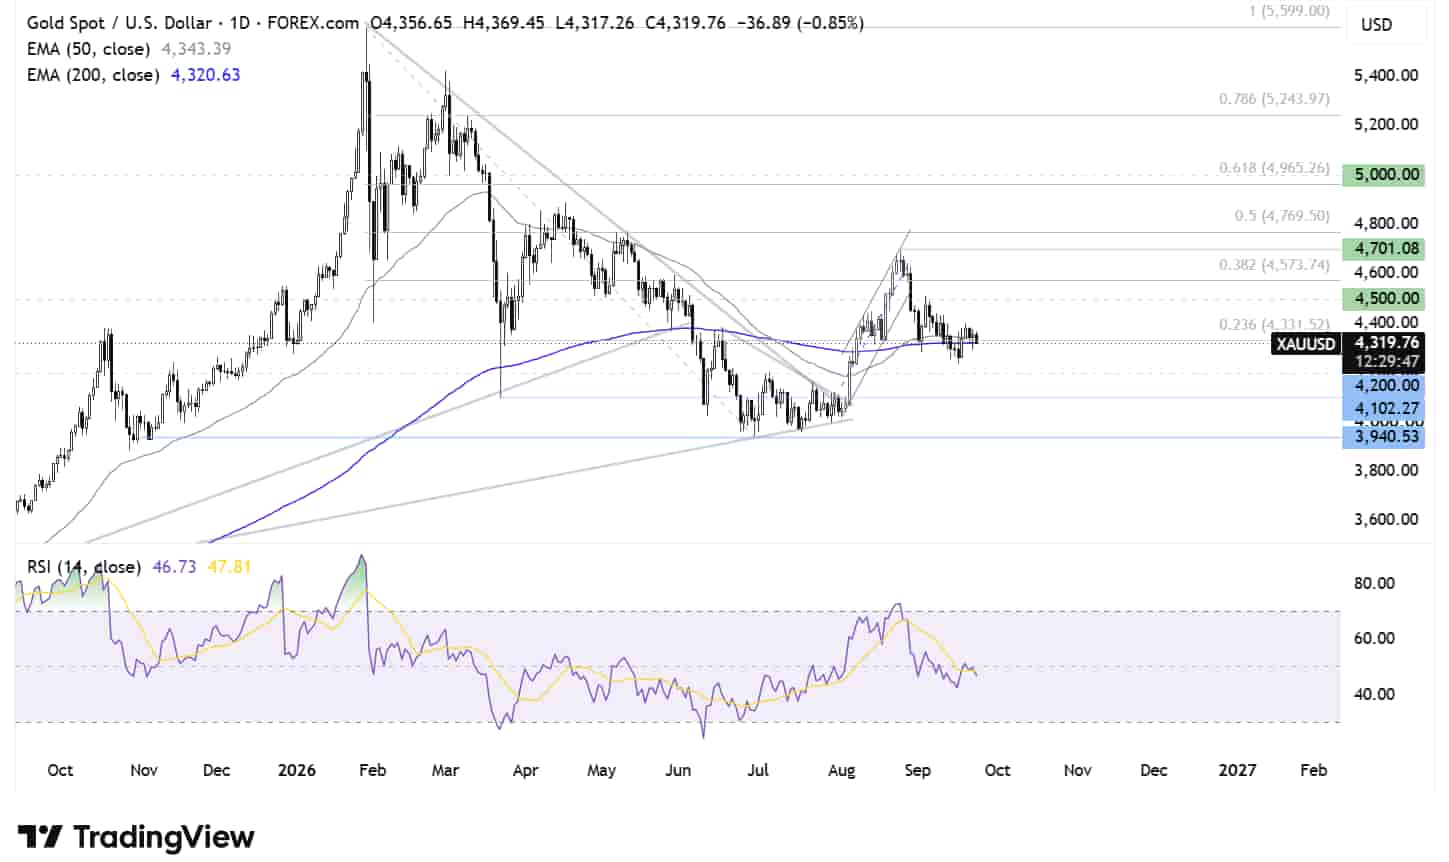
After breaking out of the symmetrical triangle pattern, gold ran into resistance around $4,700 before easing back towards $4,320, where it is consolidating around the 23.6% Fibonacci retracement of the move from the $5,998 high to the $3,940 low, as well as the 50 and 200 EMAs.
Sellers will need to break below this area to turn attention towards $4,200 and then $4,100, the March low. A break below $4,100 would shift attention towards $3,940, the 2026 low.
Should support hold, buyers will look towards $4,500 and then $4,575, the 38.2% Fibonacci retracement. A rise above $4,700 would create a higher high, with buyers then looking towards $4,770, the 50% Fibonacci retracement, before $5,000 comes into focus.