



Facebook parent Meta plunges 20% as earnings forecast miss the Mark
Facebook parent, Meta Platforms Inc, has joined the likes of Peloton, Tesla, Netflix, Paypal and Spotify to be punished by investors this reporting season for lackluster earnings and frothy valuations.
Share this:

Meta is investing heavily in the “metaverse,” a virtual world where the internet is bought to life in 3D. However, Meta relies on adverting dollars and new users to drive revenue in the meantime.
A combination of higher costs, increased competition, weaker revenue forecasts, and no growth in new users in the fourth quarter, enough to panic investors.
The share price of Meta is trading over 20% lower, near $250 in the aftermarket, indicating that over $150 billion will be wiped from the company’s market capitalization when the stock resumes full trading.
The earnings miss compounds the woes of Meta shareholders, who have seen the stock price fall from record highs in recent months as the company fights regulatory battles on several fronts. And as Chief Executive, Mark Zuckerberg leads the company into the unchartered waters of the Metaverse.
Furthermore, the tech sector has fallen out of favour in recent months as higher interest rates undermine the value of future cash flows from growth stocks. This is best illustrated by a 17% fall in the tech-heavy Nasdaq Index in the first four weeks of 2022.
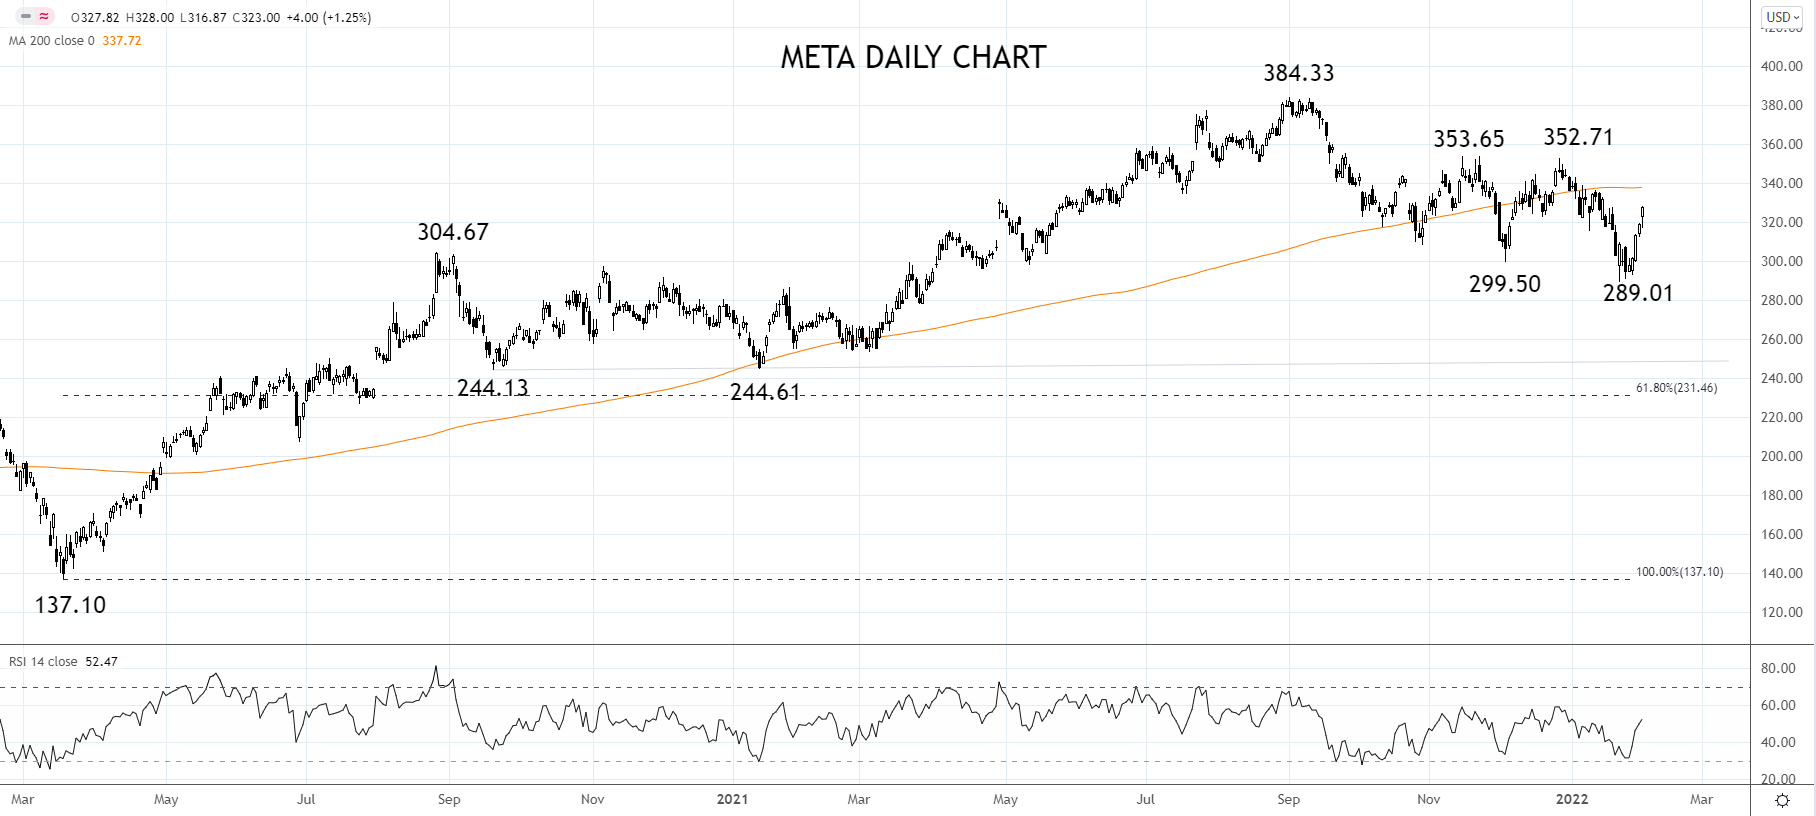
Meta Share Price Chart
Presuming the share price of Meta opens tonight near where it is trading currently (at $250), it will be trading below a layer of support now resistance at $290/300. The share price needs to rebound above this level to avoid a deeper retracement.
On the downside, support is viewed between $244/$231, which encapsulates horizontal support, and the 61.% Fibonacci retracement from the Covid $137.10 low to the September 2021, $384.33 high.
Source Tradingview. The figures stated areas of February 3rd, 2022. Past performance is not a reliable indicator of future performance. This report does not contain and is not to be taken as containing any financial product advice or financial product recommendation
How to trade with City Index
You can trade with City Index by following these four easy steps:
- Open an account, or log in if you’re already a customer
• Open an account in the UK
• Open an account in Australia
• Open an account in Singapore
- Search for the company you want to trade in our award-winning platform
- Choose your position and size, and your stop and limit levels
- Place the trade
Meta is investing heavily in the “metaverse,” a virtual world where the internet is bought to life in 3D. However, Meta relies on adverting dollars and new users to drive revenue in the meantime.
A combination of higher costs, increased competition, weaker revenue forecasts, and no growth in new users in the fourth quarter, enough to panic investors.
The share price of Meta is trading over 20% lower, near $250 in the aftermarket, indicating that over $150 billion will be wiped from the company’s market capitalization when the stock resumes full trading.
The earnings miss compounds the woes of Meta shareholders, who have seen the stock price fall from record highs in recent months as the company fights regulatory battles on several fronts. And as Chief Executive, Mark Zuckerberg leads the company into the unchartered waters of the Metaverse.
Furthermore, the tech sector has fallen out of favour in recent months as higher interest rates undermine the value of future cash flows from growth stocks. This is best illustrated by a 17% fall in the tech-heavy Nasdaq Index in the first four weeks of 2022.
Meta Share Price Chart
Presuming the share price of Meta opens tonight near where it is trading currently (at $250), it will be trading below a layer of support now resistance at $290/300. The share price needs to rebound above this level to avoid a deeper retracement.
On the downside, support is viewed between $244/$231, which encapsulates horizontal support, and the 61.% Fibonacci retracement from the Covid $137.10 low to the September 2021, $384.33 high.
Source Tradingview. The figures stated areas of February 3rd, 2022. Past performance is not a reliable indicator of future performance. This report does not contain and is not to be taken as containing any financial product advice or financial product recommendation
- Open a Forex.com account, or log in if you’re already a customer.
- Search for the pair you want to trade in our award-winning platform.
- Choose your position and size, and your stop and limit levels.
- Place the trade.
Related tags:




Open an account in minutes
Experience award-winning platforms with fast and secure execution.
Economic calendar
Web Trader platform
Our sophisticated web-based platform is packed with features.
Related articles

Nasdaq 100 Forecast: “Magnificent Seven” Q4 2025 Earnings Preview
For the Magnificent Seven, This earnings season is no longer about whether AI is real, but whether the AI boom is entering a phase where these real world constraints will weigh on growth.


Nasdaq 100 Leads Wall Street, Meta Bounce Gains Traction
Nasdaq 100 extends its rebound as weak US data lifts Fed-cut hopes. Semiconductors outperform and Meta breaks higher as dip buyers return.


Nasdaq 100 Breaks Out Into Bull Market, Tops Wall Street Rally
Nasdaq 100 futures erased a 75-day bear market in just 23 sessions. Is this the start of a new bullish cycle—or just another bear market bounce?
StoneX Financial Ltd (trading as "FOREX.com") is an execution-only service provider. This material, whether or not it states any opinions, is for general information purposes only and it does not take into account your personal circumstances or objectives. This material has been prepared using the thoughts and opinions of the author and these may change. However, FOREX.com does not plan to provide further updates to any material once published and it is not under any obligation to keep this material up to date.
This material is short term in nature and may only relate to facts and circumstances existing at a specific time or day. Nothing in this material is (or should be considered to be) financial, investment, legal, tax or other advice and no reliance should be placed on it. No opinion given in this material constitutes a recommendation by FOREX.com or the author that any particular investment, security, transaction or investment strategy is suitable for any specific person.
The material has not been prepared in accordance with legal requirements designed to promote the independence of investment research. Although FOREX.com is not specifically prevented from dealing before providing this material, FOREX.com does not seek to take advantage of the material prior to its dissemination. This material is not intended for distribution to, or use by, any person in any country or jurisdiction where such distribution or use would be contrary to local law or regulation. For further details see our full non-independent research disclaimer and quarterly summary.