



Global Indices: January ‘down’, 11-months to go
Global equity markets were mostly lower in January. But even the few that posted gains had to endure a white-knuckle ride along the way.
Share this:

January did not deliver the returns many had hoped. Red-hot inflation prints, a hawkish Fed and rising tensions between Russia and Ukraine proved too much for equity bulls and saw investors flock towards the exit. Yet the truth of the matter is that much of this selling began late December during low-volume trade, only to see economic data and headlines trigger the next round of selling mid-January.
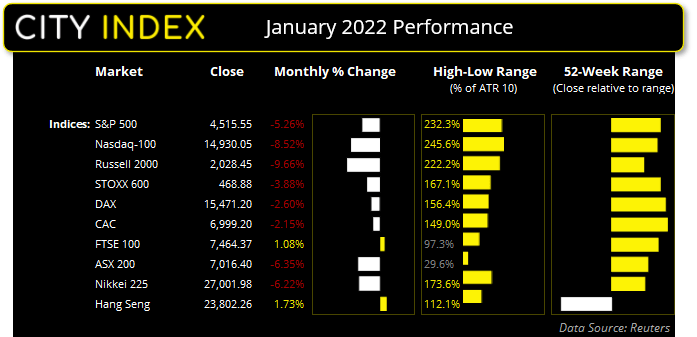

Technology stocks led the decline with the Nasdaq 100 facing its worst January since 2008. It was the first major benchmark to enter an official correction of -10%, and it has fallen over -18% from its record high in November to this month’s low. The S&P 500 fell -5.25% in January, although it initially fell -12.4% from its January high before a late-month recovery.
Europe didn’t fare so badly as their US counterparts, as prospects of the Fed tightening alongside a dovish ECB provided a less bearish narrative. It could be argued that geopolitical tensions surrounding Russia played the better part in forcing the STOXX 600 nearly -4% lower in January, compared to just -2.6% for the DAX.
And that leaves the January outperformer as the Hang Seng. A slew of weak economic data from China alongside easing measures from PBOC (People’s Bank of China) helped the Hang Seng shake off much of the bearish volatility. In fact, it is one of the few indices to have closed higher by around +1.7% in January. With that all said, it is interesting to note how Wall Street bounced on the last day of January which makes us question whether we have seen the corrective lows, or it is simply part of a dead-cat bounce.
Nasdaq 100
The Nasdaq 100 found support just above a 161.8% Fibonacci projection on January 24th. The January lows also coincide with a 38.2% Fibonacci retracement ratio and prices have since rallied out of a choppy, sideways congestion zone. RSI (14) is no longer oversold and a bullish divergence formed on the Stochastic oscillator. We therefore expect the market could trade higher from here, although we also need to see prices break above the 200-day MA (moving average) and the 15,000 level before assuming further gains.


Nikkei 225
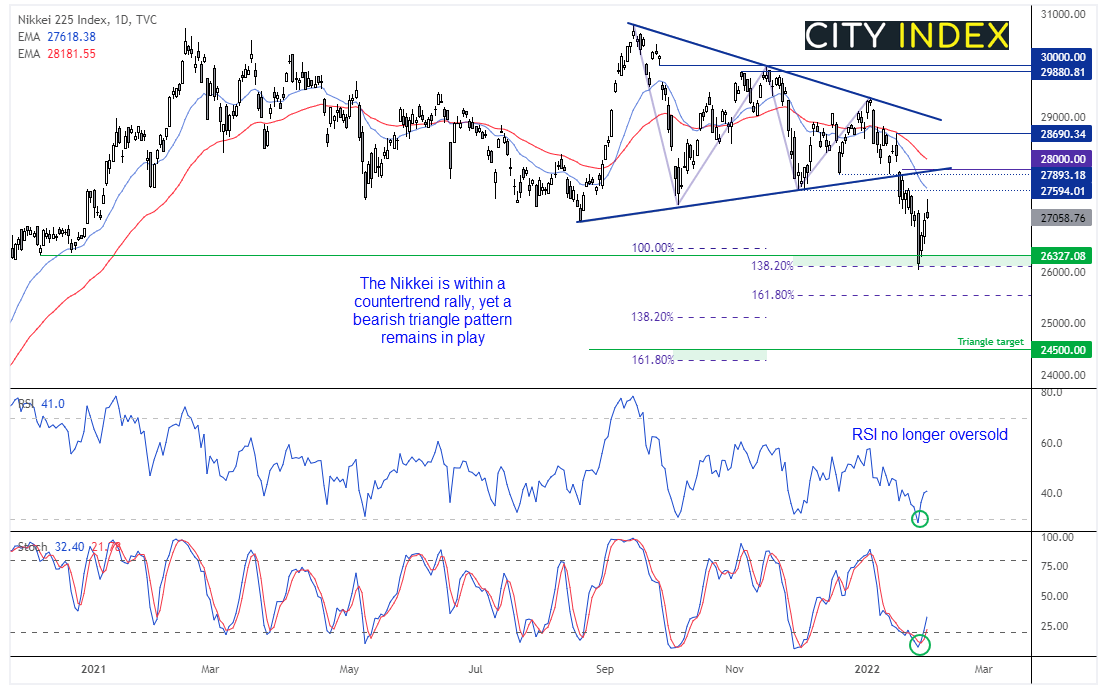
If the Nasdaq continues to bounce is could also provide further tailwinds for the Nikkei 225, due to the large proportion of technology stocks in Japan’s prime index. The RSI (14) has also rose with prices and out of the ‘oversold’ zone of 30 and the stochastic oscillator generated a buy signal. However, price action overall retains a bearish structure as it broke out of a bearish triangle on January 19th. If successful the triangle targets the area around 24,500, near a 161.8% Fibonacci level. Whilst the jury remains out as to whether the Nasdaq can trade back to its all-time highs, we continue to suspect the upside potential for the Nikkei is limited and are seeking bearish setups around key resistance levels.
Read our guide on the Nikkei 225 trading guide
Read our guide on the Nikkei 225 trading guide

How to trade with City Index
You can easily trade with City Index by using these four easy steps:
- Open an account, or log in if you’re already a customer
• Open an account in the UK
• Open an account in Australia
• Open an account in Singapore
- Search for the company you want to trade in our award-winning platform
- Choose your position and size, and your stop and limit levels
- Place the trade
How to trade with FOREX.com
Follow these easy steps to start trading with FOREX.com today:
- Open a Forex.com account, or log in if you’re already a customer.
- Search for the pair you want to trade in our award-winning platform.
- Choose your position and size, and your stop and limit levels.
- Place the trade.
Related tags:
Latest market news




Open an account in minutes
Experience award-winning platforms with fast and secure execution.
Economic calendar
Web Trader platform
Our sophisticated web-based platform is packed with features.
Related articles
NZD/USD Forecast: Kiwi faces historic breakdown as RBNZ survey looms
NZD/USD is teetering above support that held through the pandemic and Liberation Day turmoil. With RBNZ hawks repeatedly disappointed, today's inflation expectations survey could open the door to a slide towards the GFC lows.
USD/JPY, AUD/JPY: Central Bank Divergence Creates Two-Way Risk
USD/JPY eyes a breakout above 160, while AUD/JPY faces further losses as Fed, RBA and BoJ interest rate expectations diverge.
DXY, GBP/USD, AUD/USD, USD/CAD, USD/JPY, Gold Weekly Technical Outlook 11 16 2026
Sr. Technical Strategist Michael Boutros highlights the levels that matter on the USD Majors, commodities, and equity indices charts this week.

StoneX Financial Ltd (trading as "FOREX.com") is an execution-only service provider. This material, whether or not it states any opinions, is for general information purposes only and it does not take into account your personal circumstances or objectives. This material has been prepared using the thoughts and opinions of the author and these may change. However, FOREX.com does not plan to provide further updates to any material once published and it is not under any obligation to keep this material up to date.
This material is short term in nature and may only relate to facts and circumstances existing at a specific time or day. Nothing in this material is (or should be considered to be) financial, investment, legal, tax or other advice and no reliance should be placed on it. No opinion given in this material constitutes a recommendation by FOREX.com or the author that any particular investment, security, transaction or investment strategy is suitable for any specific person.
The material has not been prepared in accordance with legal requirements designed to promote the independence of investment research. Although FOREX.com is not specifically prevented from dealing before providing this material, FOREX.com does not seek to take advantage of the material prior to its dissemination. This material is not intended for distribution to, or use by, any person in any country or jurisdiction where such distribution or use would be contrary to local law or regulation. For further details see our full non-independent research disclaimer and quarterly summary.