



Index in focus: A50 bears in control as COVID spreads in China
Why the COVID outbreak across the country may well get worse before it gets better...
Share this:

Global fear toward Chinese assets is growing increasingly palpable.
As my colleague Fawad Razaqzada noted yesterday, the yuan has fallen to 17-month lows near $6.60, representing a more than 3% rise in the normally low-volatility pairing of the world’s two largest economies, but the selling has been even more dramatic in equity indices.
Looking at the FTSE China A50 Index of domestic shares, prices are down nearly -40% from their highs in Q1 2021 and more than -20% from the peak in mid-December; this is among the worst returns of all global indices so far this year. While there are multiple catalysts for the continued downtrend, including a crackdown on technology companies, a real estate slump, and general risk aversion from the ongoing Russia-Ukraine conflict, the biggest issue for traders right now is the ongoing outbreak of COVID in the country.
The manufacturing and financial hub of Shanghai has been in lockdown for nearly a month, forcing businesses to close and exacerbating the global supply chain disruption. Now, traders are concerned that the same fate may befall Beijing after city authorities announced that the virus may have been spreading in the capital for the last week, characterizing the situation as “urgent and grim.” With no imminent signs that Chinese political leaders will change the country’s “zero tolerance” policy and cases still on the rise, the outbreak across the country may well get worse before it gets better.
Technical view: FTSE China A50
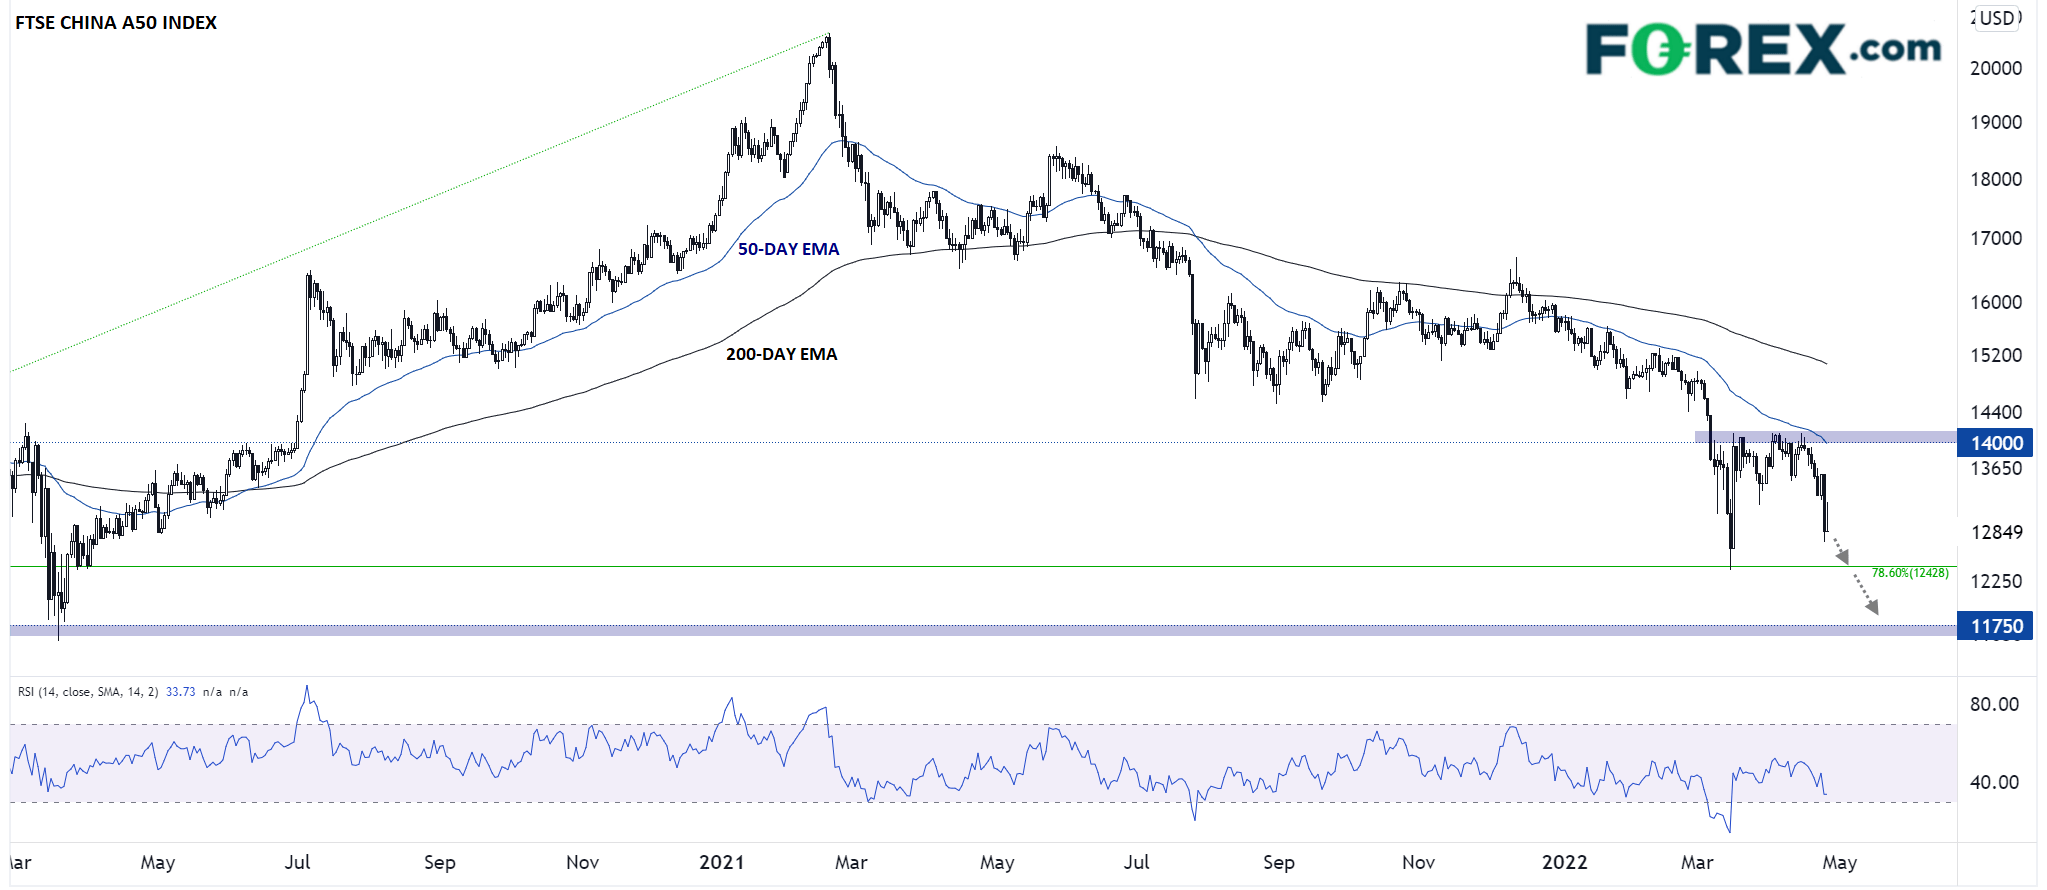
As the chart below shows, the A50 index has been trending lower since peaking above 20,000 last February, reaching a low near the 78.6% Fibonacci retracement of the 2019-2021 rally around 12,400 last month. After consolidating below the 14,000 level for the past five weeks, the index has rolled over again this week and may soon re-test the multi-year lows.
Source: TradingView, StoneX
As the RSI indicator in the lower pane shows, prices remain firmly in oversold territory but are no longer oversold, hinting at another leg lower from here. If the two-year low at 12,400 gives way, bears may look to target COVID lows at 11,750 next. Meanwhile, traders will likely be looking for a move back above the 50-day EMA and previous highs in the 14,000 area before growing more confident that the downtrend may be coming to an end.
How to trade with FOREX.com
Follow these easy steps to start trading with FOREX.com today:
- Open a Forex.com account, or log-in if you’re already a customer.
- Search for the pair you want to trade in our award-winning platform.
- Choose your position and size, and your stop and limit levels.
- Place the trade.
Global fear toward Chinese assets is growing increasingly palpable.
As my colleague Fawad Razaqzada noted yesterday, the yuan has fallen to 17-month lows near $6.60, representing a more than 3% rise in the normally low-volatility pairing of the world’s two largest economies, but the selling has been even more dramatic in equity indices.
Looking at the FTSE China A50 Index of domestic shares, prices are down nearly -40% from their highs in Q1 2021 and more than -20% from the peak in mid-December; this is among the worst returns of all global indices so far this year. While there are multiple catalysts for the continued downtrend, including a crackdown on technology companies, a real estate slump, and general risk aversion from the ongoing Russia-Ukraine conflict, the biggest issue for traders right now is the ongoing outbreak of COVID in the country.
The manufacturing and financial hub of Shanghai has been in lockdown for nearly a month, forcing businesses to close and exacerbating the global supply chain disruption. Now, traders are concerned that the same fate may befall Beijing after city authorities announced that the virus may have been spreading in the capital for the last week, characterizing the situation as “urgent and grim.” With no imminent signs that Chinese political leaders will change the country’s “zero tolerance” policy and cases still on the rise, the outbreak across the country may well get worse before it gets better.
Technical view: FTSE China A50
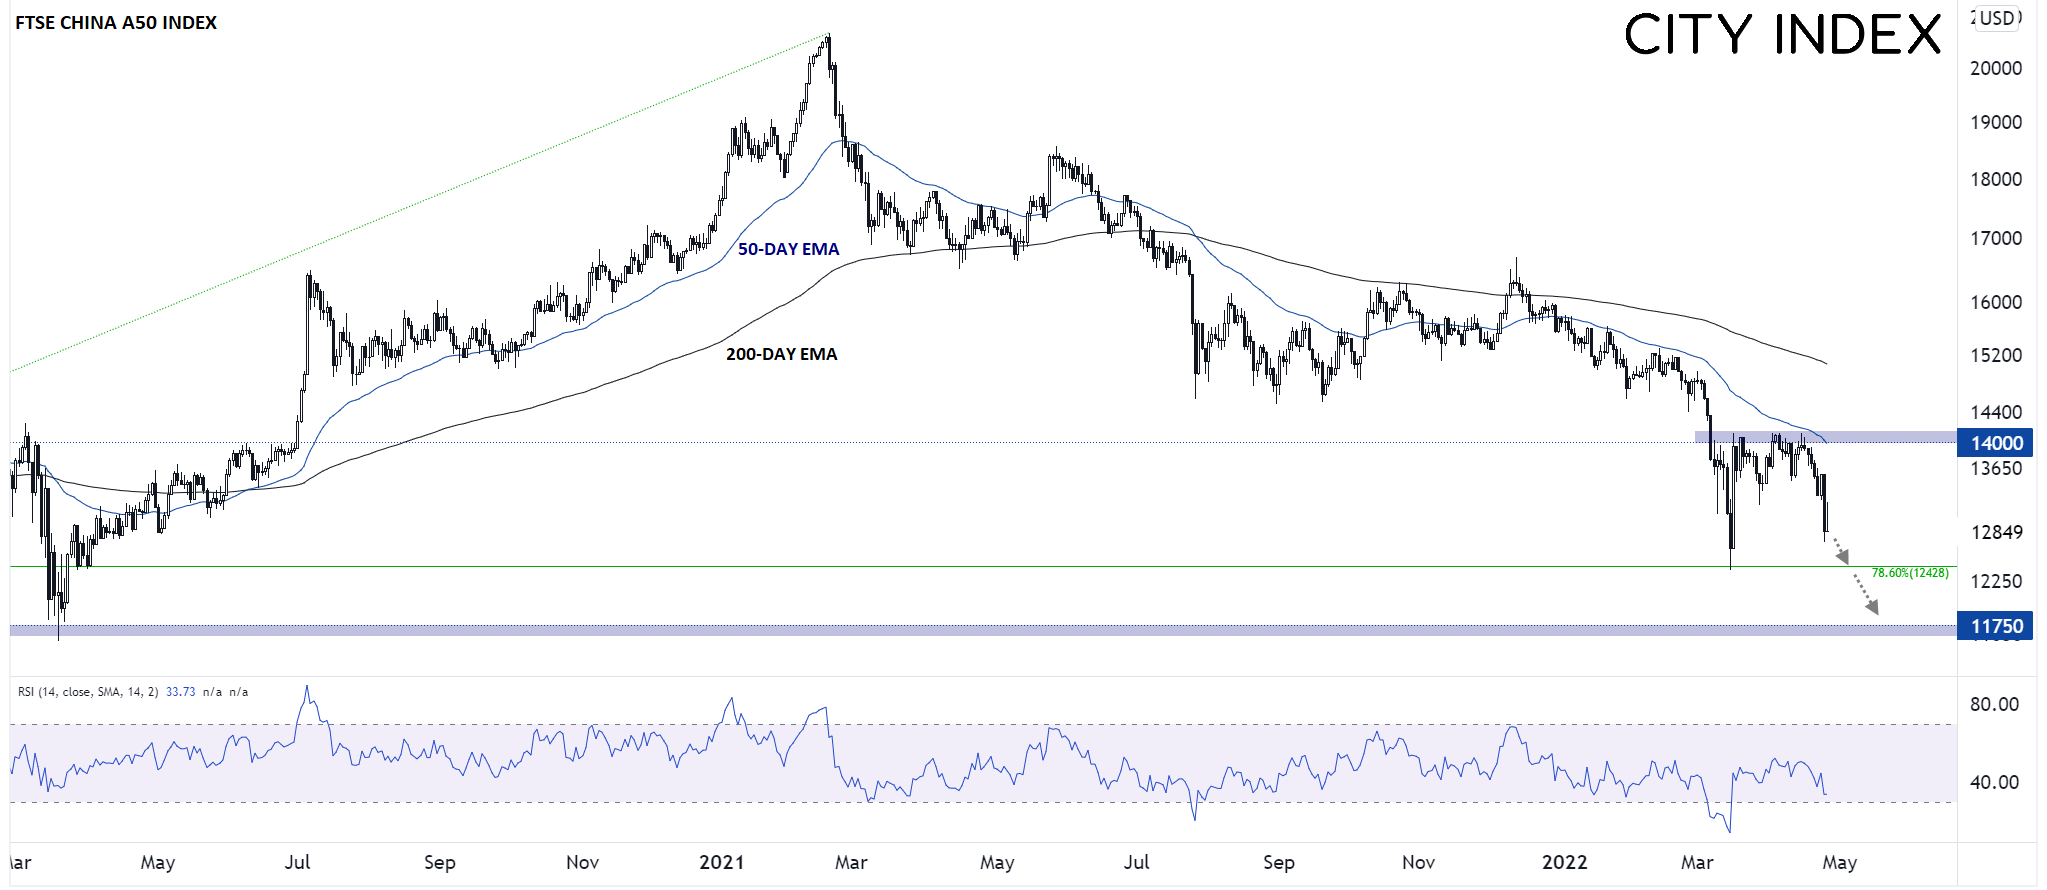
As the chart below shows, the A50 index has been trending lower since peaking above 20,000 last February, reaching a low near the 78.6% Fibonacci retracement of the 2019-2021 rally around 12,400 last month. After consolidating below the 14,000 level for the past five weeks, the index has rolled over again this week and may soon re-test the multi-year lows.
Source: TradingView, StoneX
As the RSI indicator in the lower pane shows, prices remain firmly in oversold territory but are no longer oversold, hinting at another leg lower from here. If the two-year low at 12,400 gives way, bears may look to target COVID lows at 11,750 next. Meanwhile, traders will likely be looking for a move back above the 50-day EMA and previous highs in the 14,000 area before growing more confident that the downtrend may be coming to an end.
How to trade with City Index
You can trade with City Index by following these four easy steps:
- Open an account, or log in if you’re already a customer
• Open an account in the UK
• Open an account in Australia
• Open an account in Singapore
- Search for the market you want to trade in our award-winning platform
- Choose your position and size, and your stop and limit levels
- Place the trade
Related tags:




Open an account in minutes
Experience award-winning platforms with fast and secure execution.
Economic calendar
Web Trader platform
Our sophisticated web-based platform is packed with features.
Related articles

Nikkei swings harder than Nasdaq as AI fears deepen
Nikkei 225 volatility is running well ahead of Nasdaq 100, with the index construction and Japan's heavy exposure to AI manufacturing potentially explaining the difference.

S&P 500, Nasdaq 100 Claw Back But NVDA Cloud Looms Overhead
Last week was green for both the Nasdaq and S&P 500 but given the sell-off that led into that bounce there’s still a very real question as to whether bears still have a statement to make. And the NVDA situation presents a very real threat.


Nasdaq 100 forecast: Nvidia troubles put AI recovery into question
The recovery for major indices this week has helped repair much of the technical damage inflicted by last week’s sell-off, but the latest developments with Nvidia suggest investors are not quite ready to put the underlying risks behind them. The Nasdaq 100 led other US index futures lower overnight, with falls of around 0.8%.

StoneX Financial Ltd (trading as "FOREX.com") is an execution-only service provider. This material, whether or not it states any opinions, is for general information purposes only and it does not take into account your personal circumstances or objectives. This material has been prepared using the thoughts and opinions of the author and these may change. However, FOREX.com does not plan to provide further updates to any material once published and it is not under any obligation to keep this material up to date.
This material is short term in nature and may only relate to facts and circumstances existing at a specific time or day. Nothing in this material is (or should be considered to be) financial, investment, legal, tax or other advice and no reliance should be placed on it. No opinion given in this material constitutes a recommendation by FOREX.com or the author that any particular investment, security, transaction or investment strategy is suitable for any specific person.
The material has not been prepared in accordance with legal requirements designed to promote the independence of investment research. Although FOREX.com is not specifically prevented from dealing before providing this material, FOREX.com does not seek to take advantage of the material prior to its dissemination. This material is not intended for distribution to, or use by, any person in any country or jurisdiction where such distribution or use would be contrary to local law or regulation. For further details see our full non-independent research disclaimer and quarterly summary.