



Nasdaq 100 nearing “correction” territory, 200-day MA in nearly 2 years
This is the first time since the pandemic began that the index has broken conclusively below its 100-day EMA - see what may be coming next!
Share this:

We tend to focus on shorter-term performance and trends in our articles, but sometimes it pays to take a step back and look at returns over a longer-term perspective. Going back ten years, here are the annual (price-only, no dividends included) returns of the Nasdaq 100 index (US Tech 100):
- 2012: +18.1%
- 2013: +36.6%
- 2014: +19.1%
- 2015: +9.5%
- 2016: +7.0%
- 2017: +32.7%
- 2018: -0.1%
- 2019: +39.1%
- 2020: +48.6% (!!)
- 2021: +27.2%
All told, the tech-focused Nasdaq 100 has returned an average of 22.5% annually over the last ten years, compared with “just” 14.7% for the broader S&P 500 index, which has had quite an impressive decade of its own.
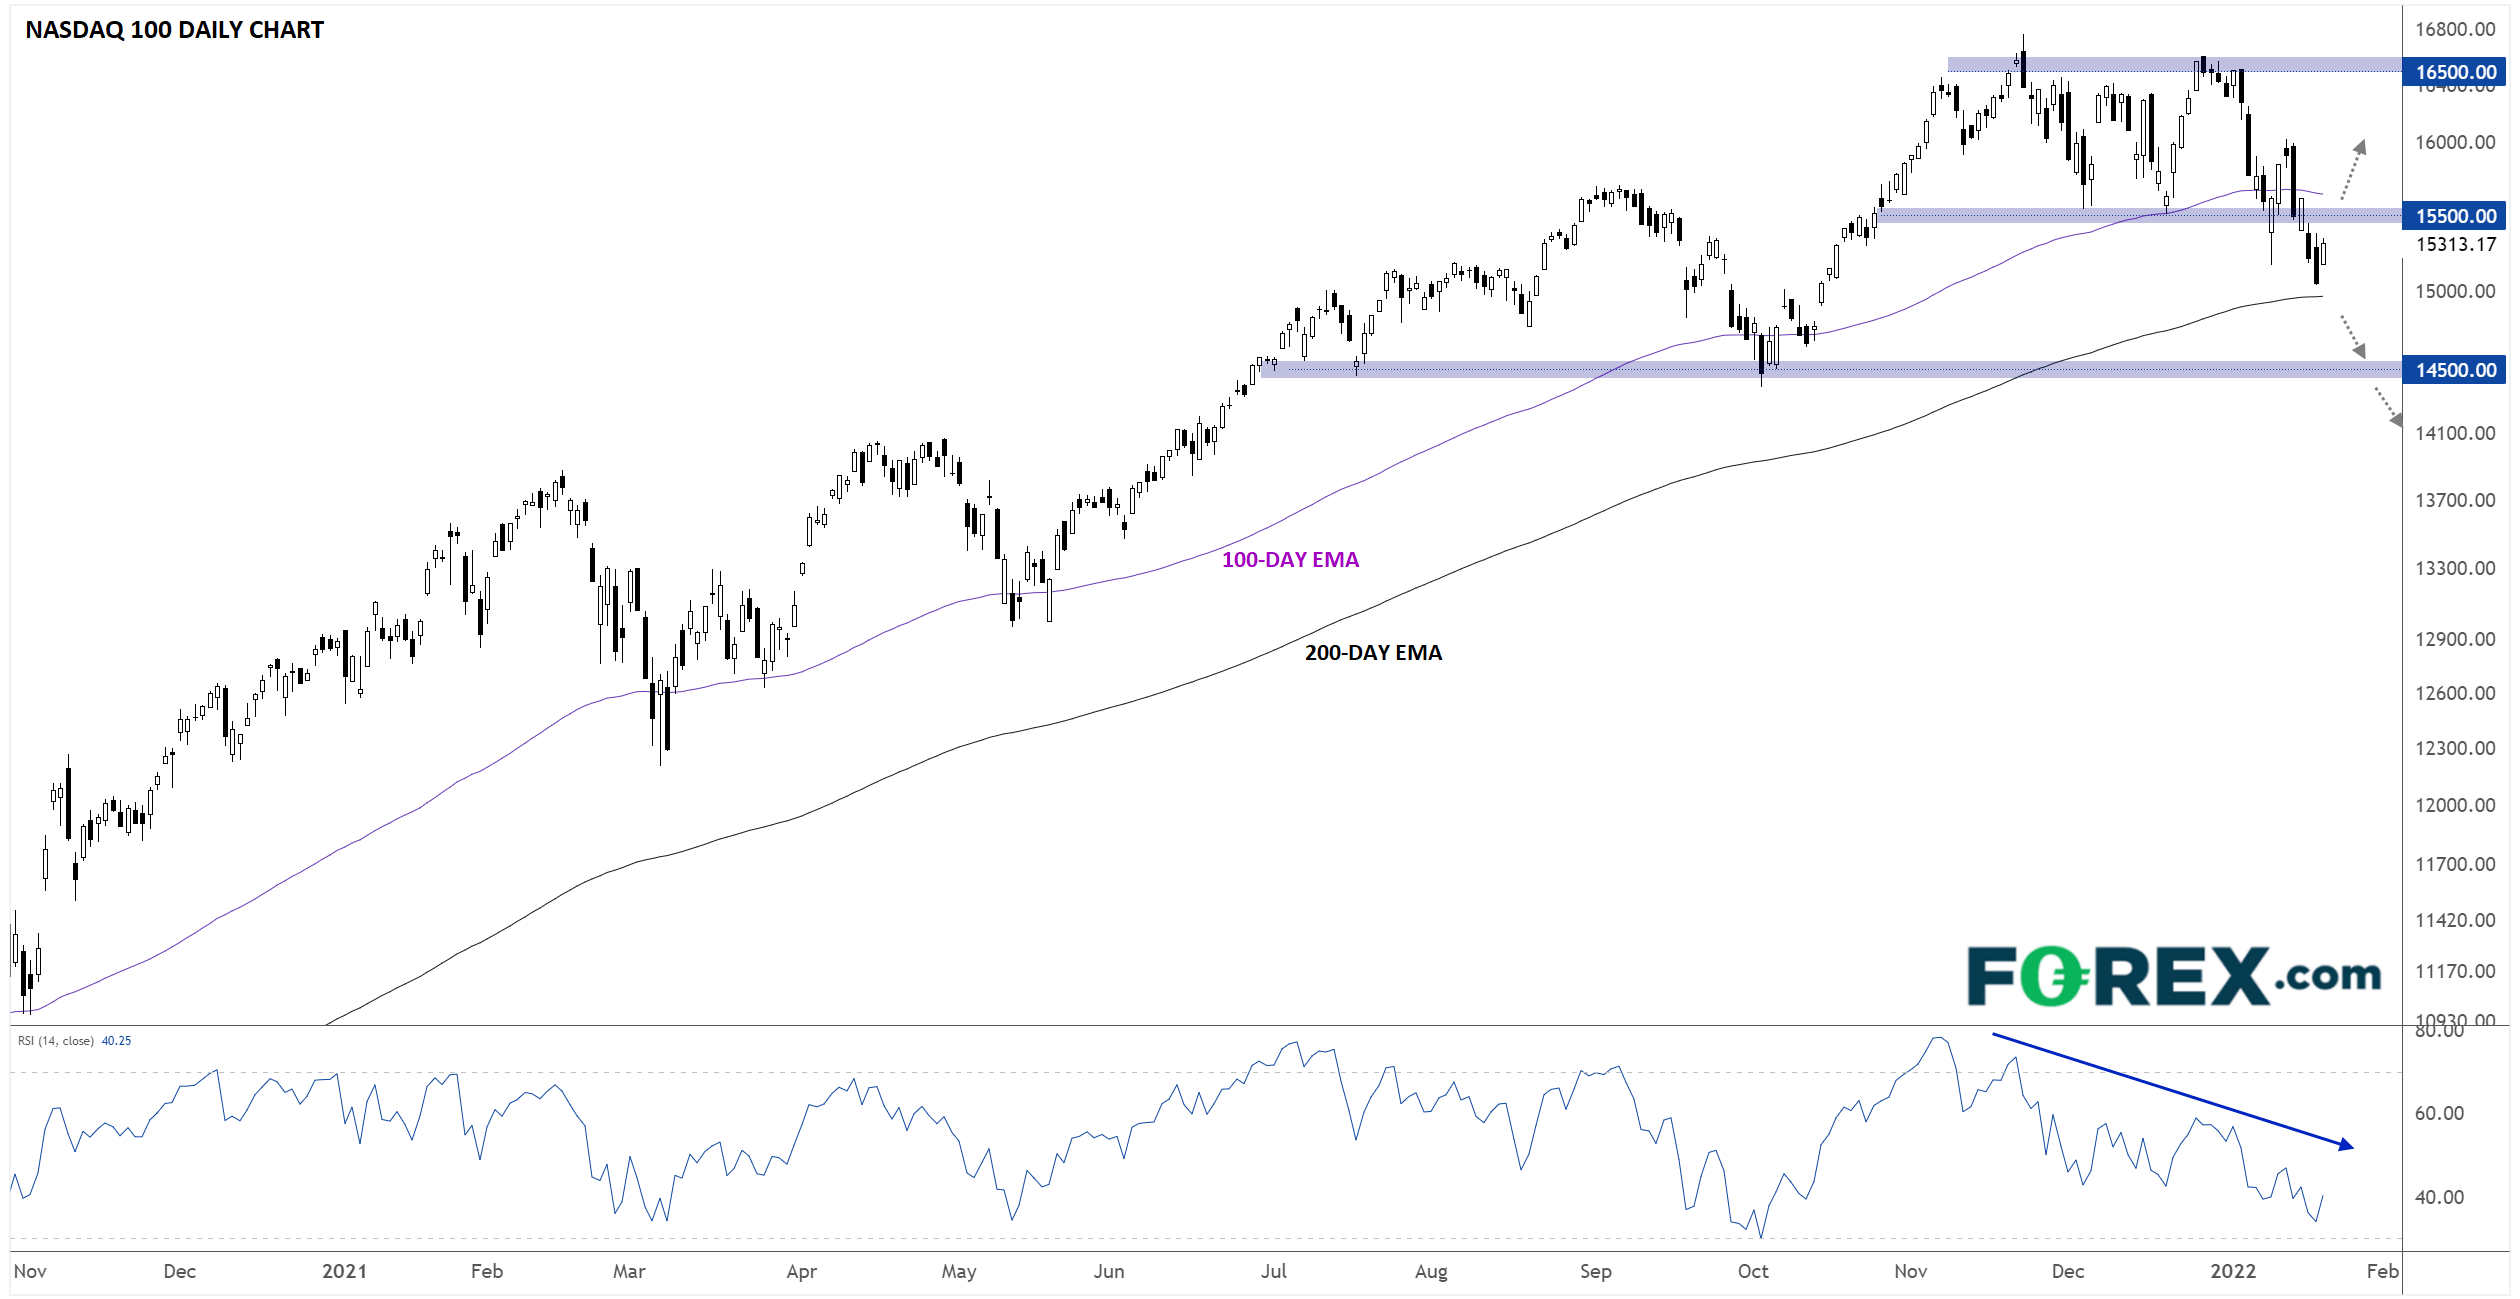
Against that backdrop of relentless gains, it’s not surprising that Nasdaq 100 bulls may have grown somewhat complacent. Perhaps that’s why the ugly -7% drop to start 2022 has bulls feeling so uneasy. As the chart below shows, this is the first time since the pandemic began that the index has broken conclusively below its 100-day EMA, and the widely-watched 200-day EMA near 15,000 has now come under pressure:
Source: TradingView, StoneX
See my colleague Josh Warner’s report on Big Tech stocks as part of 2022 Market Outlook!
From a technical perspective, the index remains in a long-term uptrend, and any trader who’s tried to bet against that trend over the last decade has quickly been proven wrong. That said, this dip in the Nasdaq 100 comes at a particularly precarious time; after all, the massive technology stocks that make up a full 45% of its market cap report earnings in the next two weeks:
- January 25: Microsoft (9.9%)
- January 26: Tesla (4.3% weight)
- January 27: Apple (11.8%)
- February 1(?): Amazon.com (6.9%)
- February 1: Alphabet / Google (7.2%)
- February 2: Meta Platforms / Facebook (4.9%)
One way or another, the outlook for the Nasdaq 100 will be much clearer in two weeks. If investors react positively to these behemoths’ earnings and the Nasdaq 100 holds above its 200-day EMA in the 15,000 area, the longer-term uptrend will likely reassert itself. Alternatively, soft earnings reports and/or guidance, confirmed by a break below 15,000, would see the index get off to one of its worst starts in over a decade.
We tend to focus on shorter-term performance and trends in our articles, but sometimes it pays to take a step back and look at returns over a longer-term perspective. Going back ten years, here are the annual (price-only, no dividends included) returns of the Nasdaq 100 index (US Tech 100):
- 2012: +18.1%
- 2013: +36.6%
- 2014: +19.1%
- 2015: +9.5%
- 2016: +7.0%
- 2017: +32.7%
- 2018: -0.1%
- 2019: +39.1%
- 2020: +48.6% (!!)
- 2021: +27.2%
All told, the tech-focused Nasdaq 100 has returned an average of 22.5% annually over the last ten years, compared with “just” 14.7% for the broader S&P 500 index, which has had quite an impressive decade of its own.
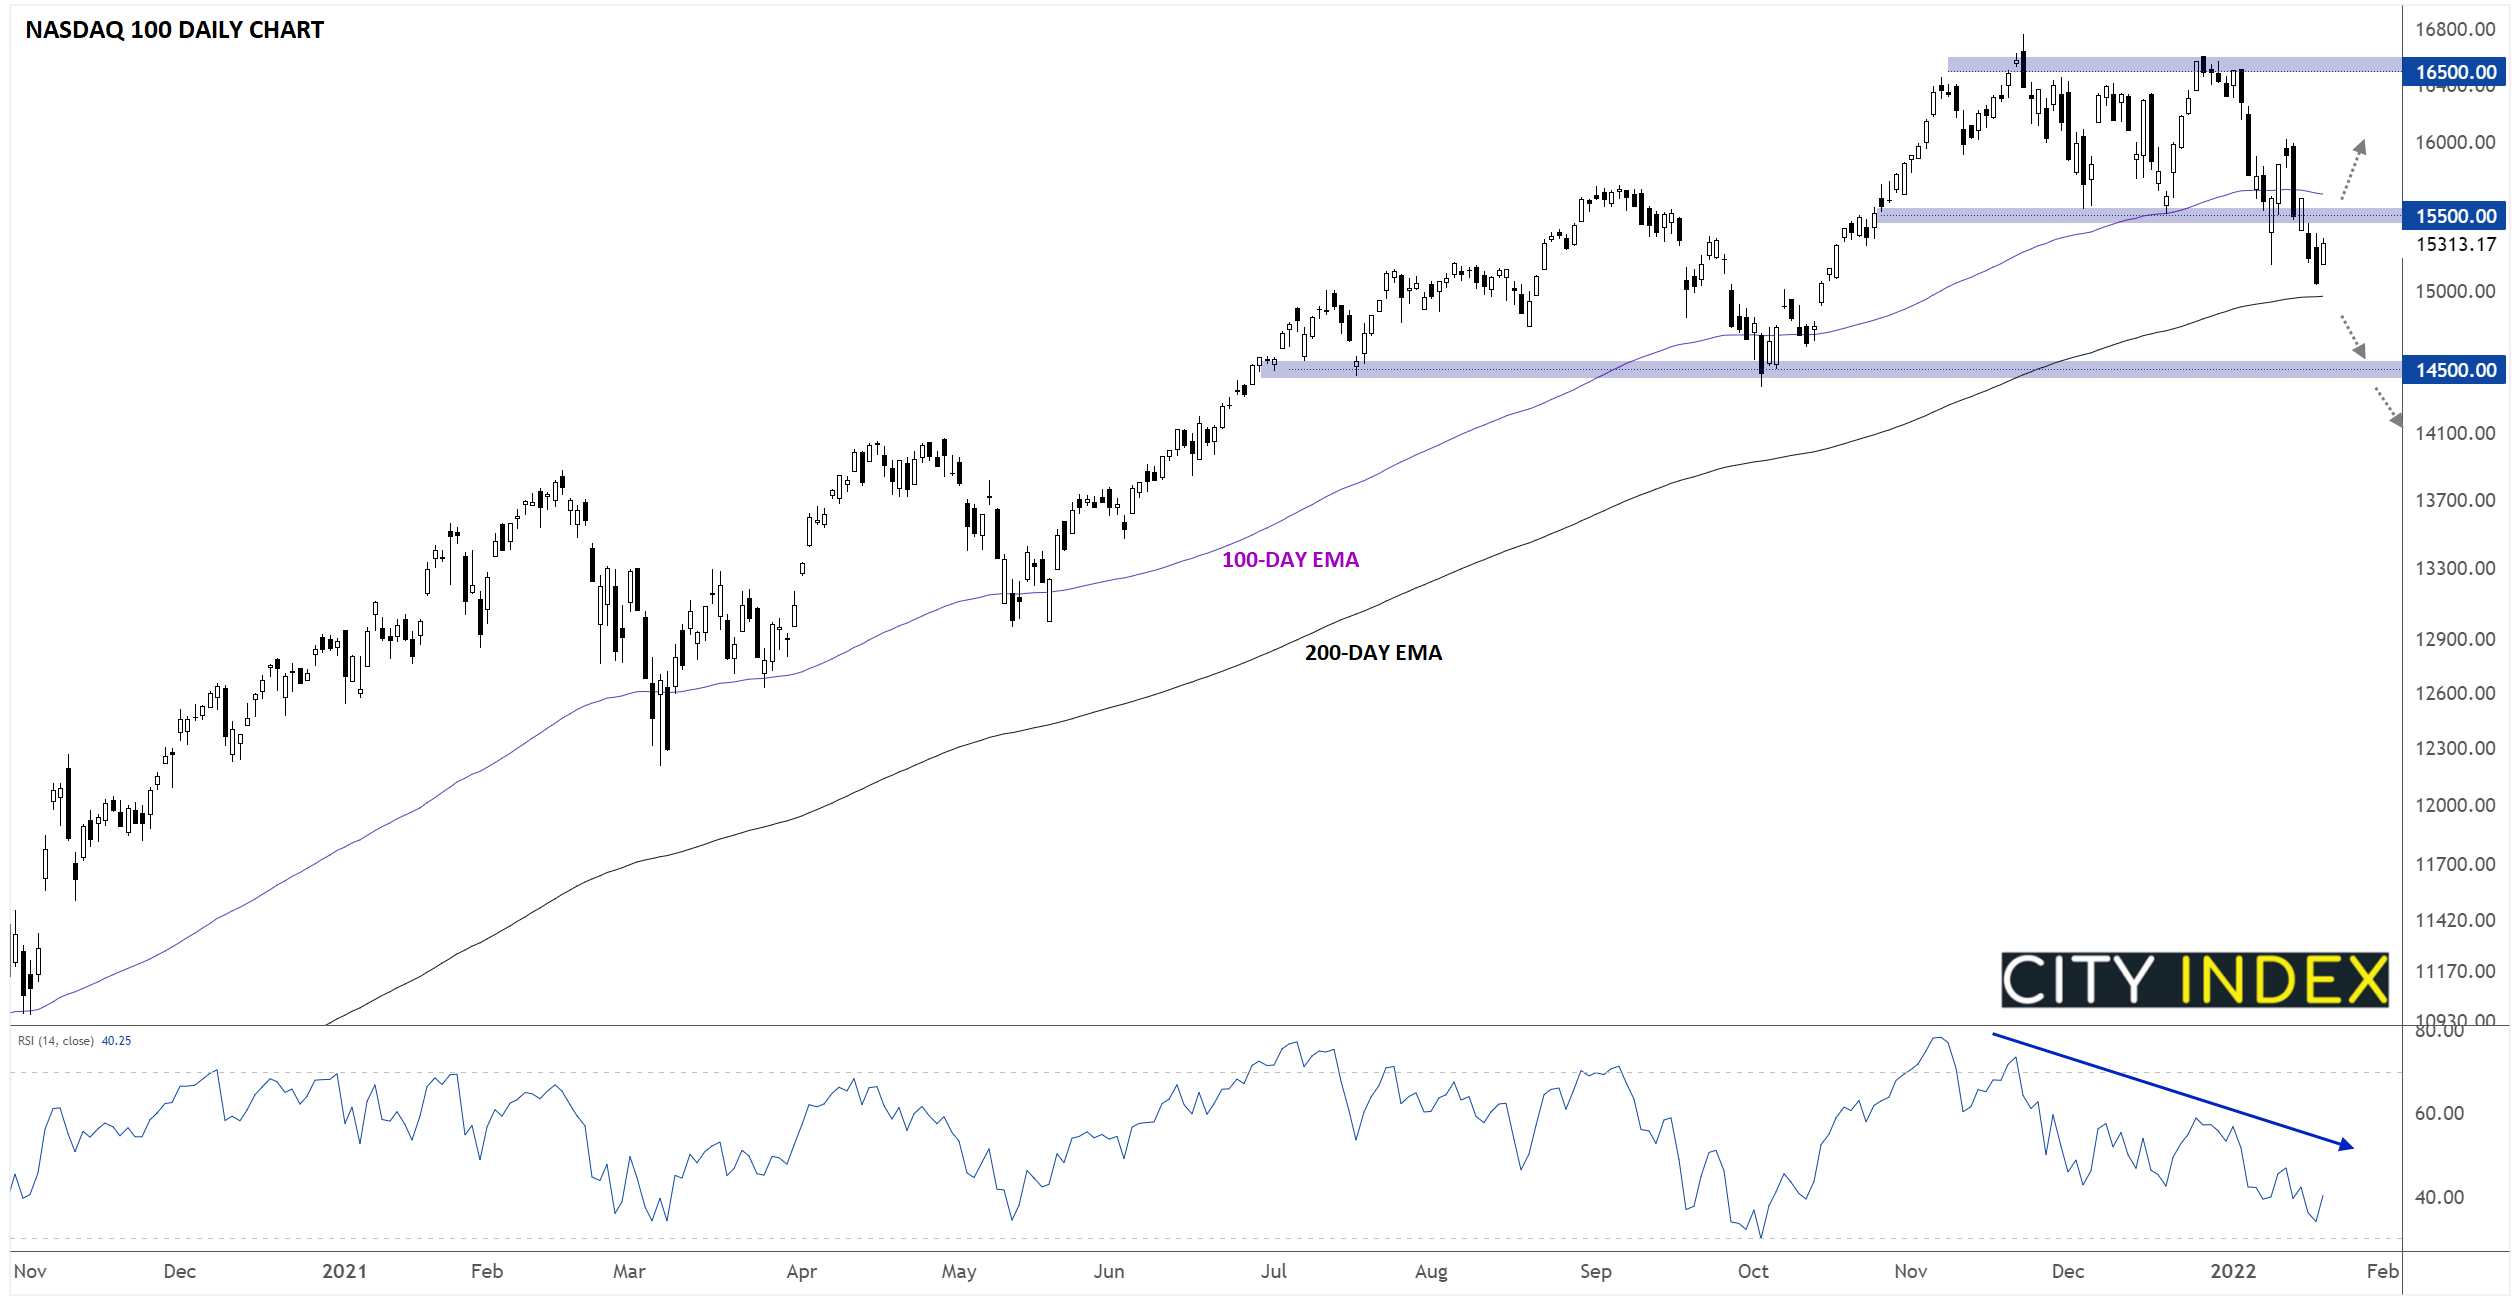
Against that backdrop of relentless gains, it’s not surprising that Nasdaq 100 bulls may have grown somewhat complacent. Perhaps that’s why the ugly -7% drop to start 2022 has bulls feeling so uneasy. As the chart below shows, this is the first time since the pandemic began that the index has broken conclusively below its 100-day EMA, and the widely-watched 200-day EMA near 15,000 has now come under pressure:
Source: TradingView, StoneX
See my colleague Josh Warner’s report on Big Tech stocks as part of 2022 Market Outlook!
From a technical perspective, the index remains in a long-term uptrend, and any trader who’s tried to bet against that trend over the last decade has quickly been proven wrong. That said, this dip in the Nasdaq 100 comes at a particularly precarious time; after all, the massive technology stocks that make up a full 45% of its market cap report earnings in the next two weeks:
- January 25: Microsoft (9.9%)
- January 26: Tesla (4.3% weight)
- January 27: Apple (11.8%)
- February 1(?): Amazon.com (6.9%)
- February 1: Alphabet / Google (7.2%)
- February 2: Meta Platforms / Facebook (4.9%)
One way or another, the outlook for the Nasdaq 100 will be much clearer in two weeks. If investors react positively to these behemoths’ earnings and the Nasdaq 100 holds above its 200-day EMA in the 15,000 area, the longer-term uptrend will likely reassert itself. Alternatively, soft earnings reports and/or guidance, confirmed by a break below 15,000, would see the index get off to one of its worst starts in over a decade.
How to trade with City Index
You can trade with City Index by following these four easy steps:
- Open an account, or log in if you’re already a customer
• Open an account in the UK
• Open an account in Australia
• Open an account in Singapore
- Search for the company you want to trade in our award-winning platform
- Choose your position and size, and your stop and limit levels
- Place the trade
Related tags:



Open an account in minutes
Experience award-winning platforms with fast and secure execution.
Economic calendar
Web Trader platform
Our sophisticated web-based platform is packed with features.
Related articles

S&P, Nasdaq Slide as NVDA, AI Worries Continue to Build
It was a busy weekend in the headlines as a campaign to bring back Jensen Huang atop NVDA gained steam, even with accusations of possible treason and a circular funding model that has started to raise questions.


Nasdaq 100 Forecast: NDX falls ahead of Nvidia’s earnings & Anthropic’s debut this week
U.S. stocks are heading for a weaker open amid a challenging macro backdrop and with AI-linked stocks once again under pressure ahead of Nvidia's results later this week. Attention is also turning to Anthropic's highly anticipated IPO.


Nikkei swings harder than Nasdaq as AI fears deepen
Nikkei 225 volatility is running well ahead of Nasdaq 100, with the index construction and Japan's heavy exposure to AI manufacturing potentially explaining the difference.
StoneX Financial Ltd (trading as "FOREX.com") is an execution-only service provider. This material, whether or not it states any opinions, is for general information purposes only and it does not take into account your personal circumstances or objectives. This material has been prepared using the thoughts and opinions of the author and these may change. However, FOREX.com does not plan to provide further updates to any material once published and it is not under any obligation to keep this material up to date.
This material is short term in nature and may only relate to facts and circumstances existing at a specific time or day. Nothing in this material is (or should be considered to be) financial, investment, legal, tax or other advice and no reliance should be placed on it. No opinion given in this material constitutes a recommendation by FOREX.com or the author that any particular investment, security, transaction or investment strategy is suitable for any specific person.
The material has not been prepared in accordance with legal requirements designed to promote the independence of investment research. Although FOREX.com is not specifically prevented from dealing before providing this material, FOREX.com does not seek to take advantage of the material prior to its dissemination. This material is not intended for distribution to, or use by, any person in any country or jurisdiction where such distribution or use would be contrary to local law or regulation. For further details see our full non-independent research disclaimer and quarterly summary.