
NFP Key Points
- NFP report expectations: +65K jobs, +0.3% m/m earnings, unemployment at 4.3%.
- NFP leading indicators point to a potentially above-expected reading in this month’s jobs report, with headline job growth potentially coming in somewhere in the 110-150K range.
- EUR/USD is showing signs of turning higher over the last couple of weeks after pulling back in the latter half of April.
When is the April NFP Report?
The April NFP report will be released on Friday, May 7, at 8:30 ET.
NFP Report Expectations
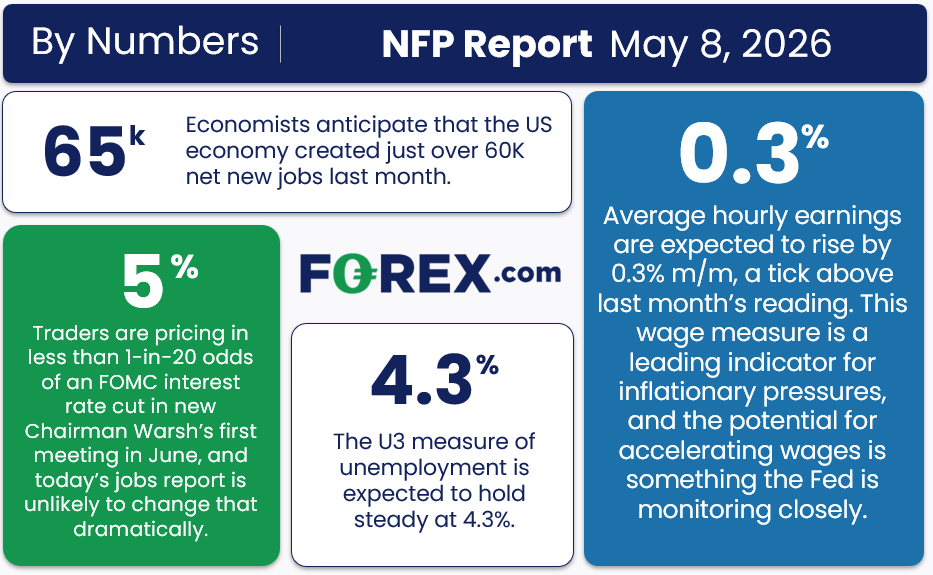
Traders and economists expect the NFP report to show that the US created 65K net new jobs, with average hourly earnings rising 0.3% m/m (3.8% y/y) and the U3 unemployment rate at 4.3%.
NFP Overview
If you had told traders at the start of the year that, in addition to the ongoing concerns about AI job displacement, the US would go to war with Iran and energy prices would surge 100%+, they would justifiably assume job growth would collapse and the US economy could tip into recession.
Despite these ongoing concerns, the US labor market has remained relatively hale, adding an average of about 70K jobs per month so far this year, enough to keep the unemployment rate unchanged since the start of the year at the historically low level of 4.3%. Now the jobs market faces its latest test, the April NFP report, with traders expecting an extension of the “low hire, low fire” regime that has characterized the past year or so:
Source: StoneX
As the graphic above shows, traders are essentially anticipating another steady jobs report, with modest job growth, stable unemployment, and continued gradual wage increases.
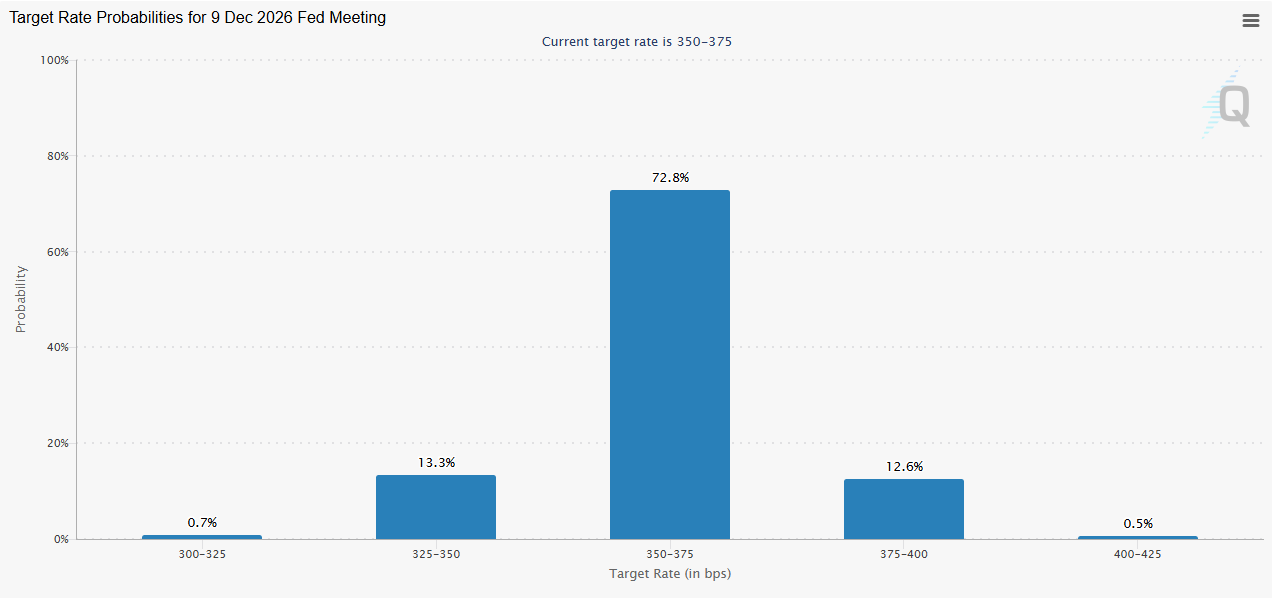
Combined with accelerating inflation above the Federal Reserve’s 2% target amidst the ongoing closure of the Strait of Hormuz, traders have essentially erased the expectation of another interest rate cut from the Federal Reserve this year, with the CME’s FedWatch tool showing a 70%+ probability of no changes to interest rates at all this year:
Source: CME FedWatch
Clearly, traders are coming to the conclusion that even when Kevin Warsh, Trump’s nominee for the next Federal Reserve Chairman, comes aboard, the case for additional interest rate cuts will be an uphill battle any time soon.
NFP Forecast
As regular readers know, we focus on four historically reliable leading indicators to help handicap each NFP report:
- The ISM Manufacturing Employment subindex slipped to 46.4 from 48.7 last month.
- The ISM Services Employment subindex held steady at 53.6 vs. 54.0 last month.
- The ADP Employment report came in at 109K jobs, up from last month’s 61K reading.
- The 4-week moving average of initial unemployment claims fell to 203K, down from 208K last month to historically low levels.
Weighing the data and our internal models, the leading indicators point to a potentially above-expected reading in this month’s jobs report, with headline job growth potentially coming in somewhere in the 110-150K range, albeit with a big band of uncertainty given the limited response rates.
Regardless, the month-to-month fluctuations in this report are notoriously difficult to predict, so we wouldn’t put too much stock into any forecasts (including ours). As always, the other aspects of the release, including the closely-watched average hourly earnings figure and unemployment rate will also impact how markets react to the release.
Potential NFP Market Reaction
|
|
Wages < 0.2% m/m |
Wages 0.2-0.4% m/m |
Wages > 0.4% m/m |
|
< 20K jobs |
Slightly Bearish USD |
Slightly Bearish USD |
Neutral USD |
|
20-110K jobs |
Neutral USD |
Neutral USD |
Slightly Bullish USD |
|
> 110K jobs |
Neutral USD |
Slightly Bullish USD |
Bullish USD |
Technically speaking, the US dollar is trading near the bottom of its 3-month range against its major rivals as the Iran-driven safe haven demand fades slightly. Further de-escalation could weigh on the greenback regardless of what this month’s jobs report shows.

US Dollar Index Technical Analysis – EUR/USD 4-Hour Chart
Source: TradingView, StoneX
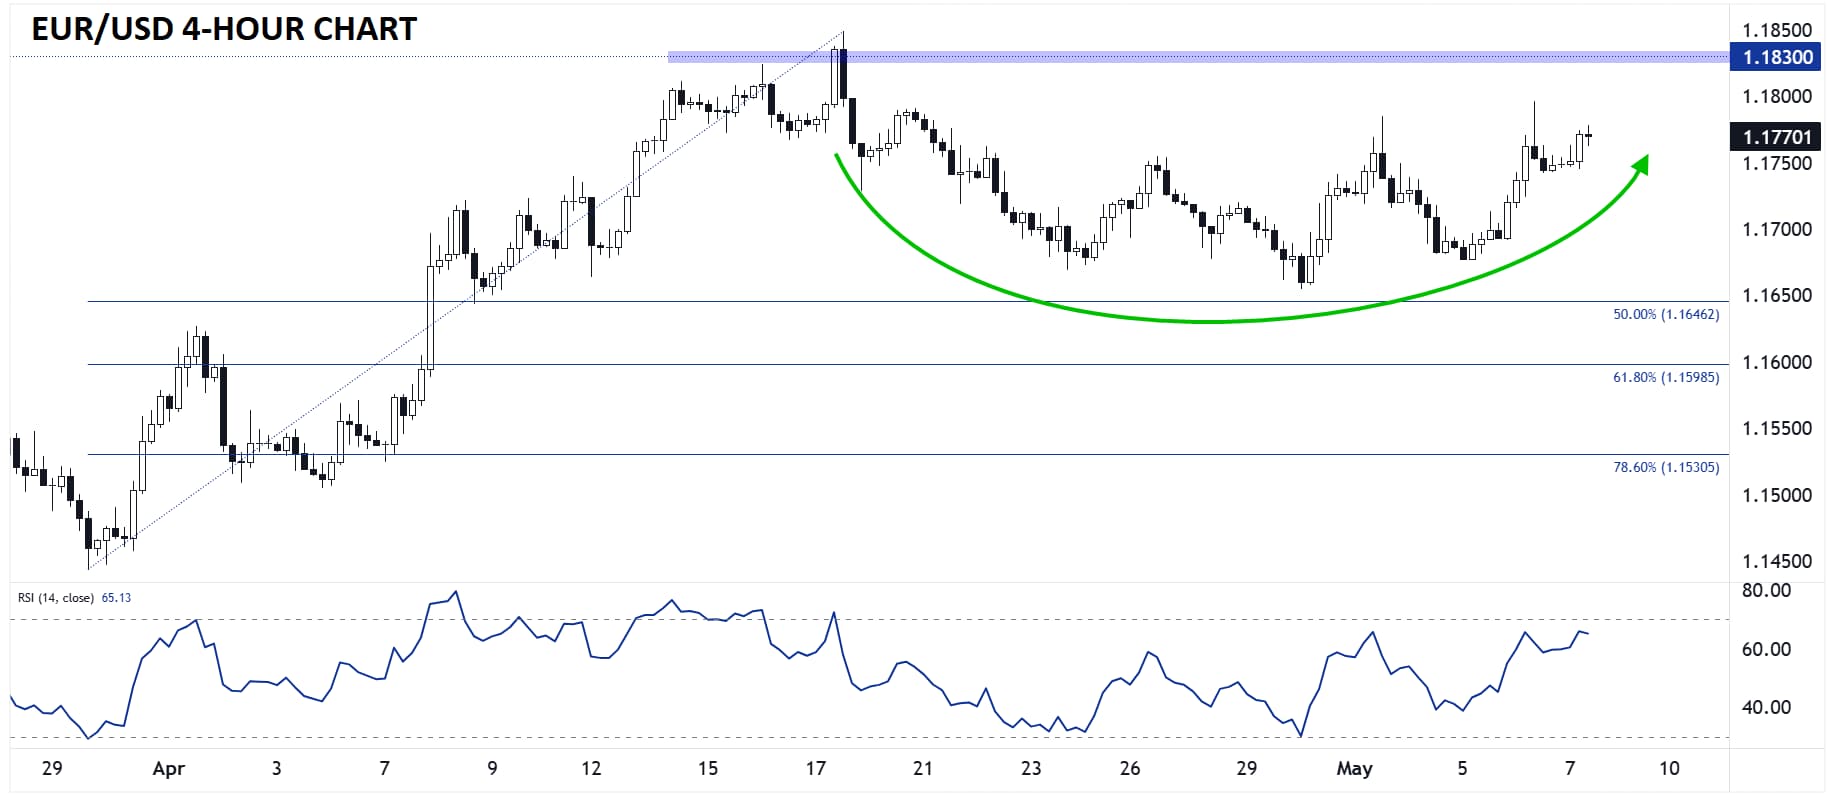
As the chart above shows, the world’s most widely-traded currency pair is showing signs of turning higher over the last couple of weeks after pulling back in the latter half of April.
EUR/USD has transitioned from putting in gradual lower lows and lower highs to higher lows and higher highs over the last week, potentially setting the stage for a retest of the 10-week highs near 1.1830, with a weaker-than-anticipated jobs report or reopening of the Strait of Hormuz as possible bullish fundamental catalysts. A clean break above the 1.1830 level could expose the 1.1900 round handle or longer-term Fibonacci retracement at 1.1940 as future targets for bulls.
Meanwhile, a strong jobs report or resumption of the “hot war” in Iran would likely weigh on EUR/USD and prompt a re-test of the near-term 50% Fibonacci retracement near 1.1650 as we head into next week.
-- Written by Matt Weller, Global Head of Research
Follow Matt on Twitter: @MWellerFX