
Rate Cut Bets Lift Precious Metals to Key Resistance Levels
Despite December rate cut bets surging over 80%, the DXY is still holding its bullish grounds and precious metals gold and silver only lifted towards key resistance zones.
Key Events
· Consolidation risks persist across major markets despite the latest surge in rate cut bets.
· Gold advanced toward its $4,150 resistance, while Silver climbed above the $51 mark.
CME Fed Watch Tool: December Rate Expectations
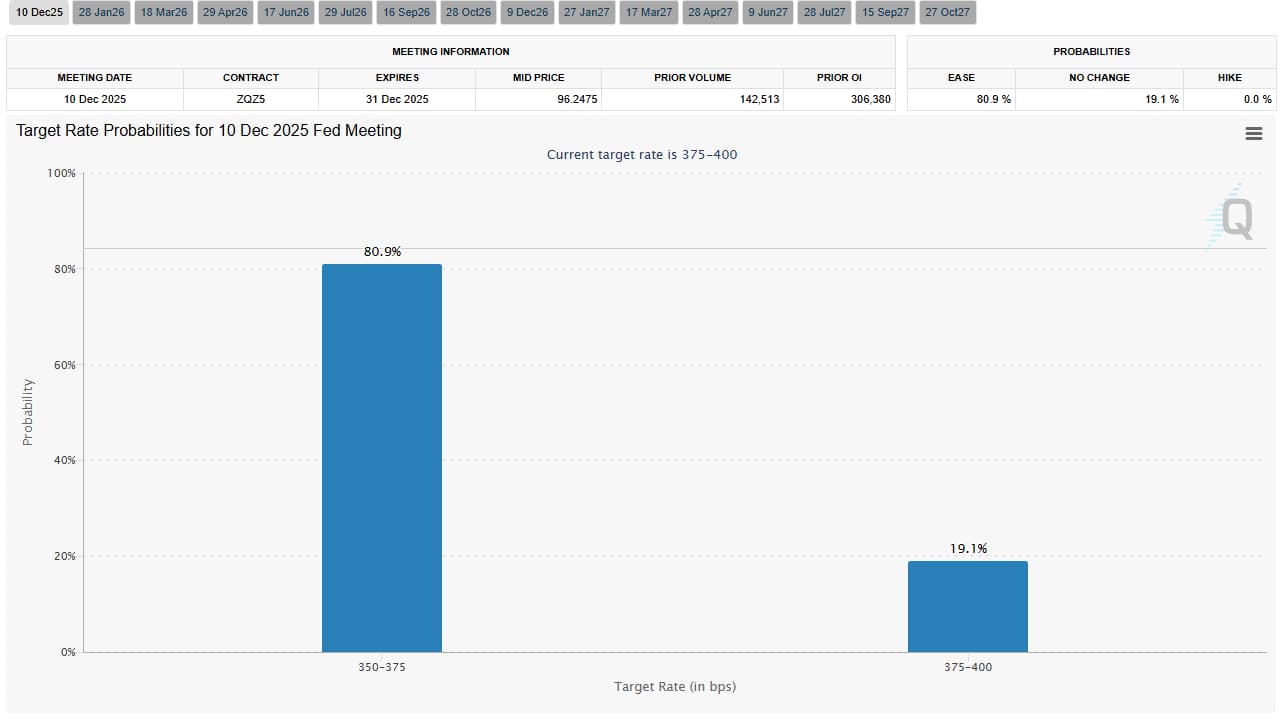
Rate cut bets climbed sharply from 50% to 80% within a week, following dovish remarks from Fed Governor Christopher Waller, New York Fed President John Williams, and San Francisco Fed President Mary Daly. Their comments helped reverse recent losses across U.S. indices, cryptocurrencies, and precious metals.
However, with the dollar hovering near the 100 level, lagging U.S. economic data, and risk assets still trading below their bullish bias zones, a cautious outlook remains warranted despite the surge in rate cut expectations.
From a technical standpoint, the recent highs on both gold and silver charts represent key long-term resistance levels, accompanied by exhausted momentum. This setup supports a consolidation scenario, with gold trading between the $4,200–$3,900 range and silver fluctuating between $52–$45.
Although these ranges are wide, they continue to define the sideways structure seen across both metals since their latest peaks, until clear breakouts or directional biases emerge.
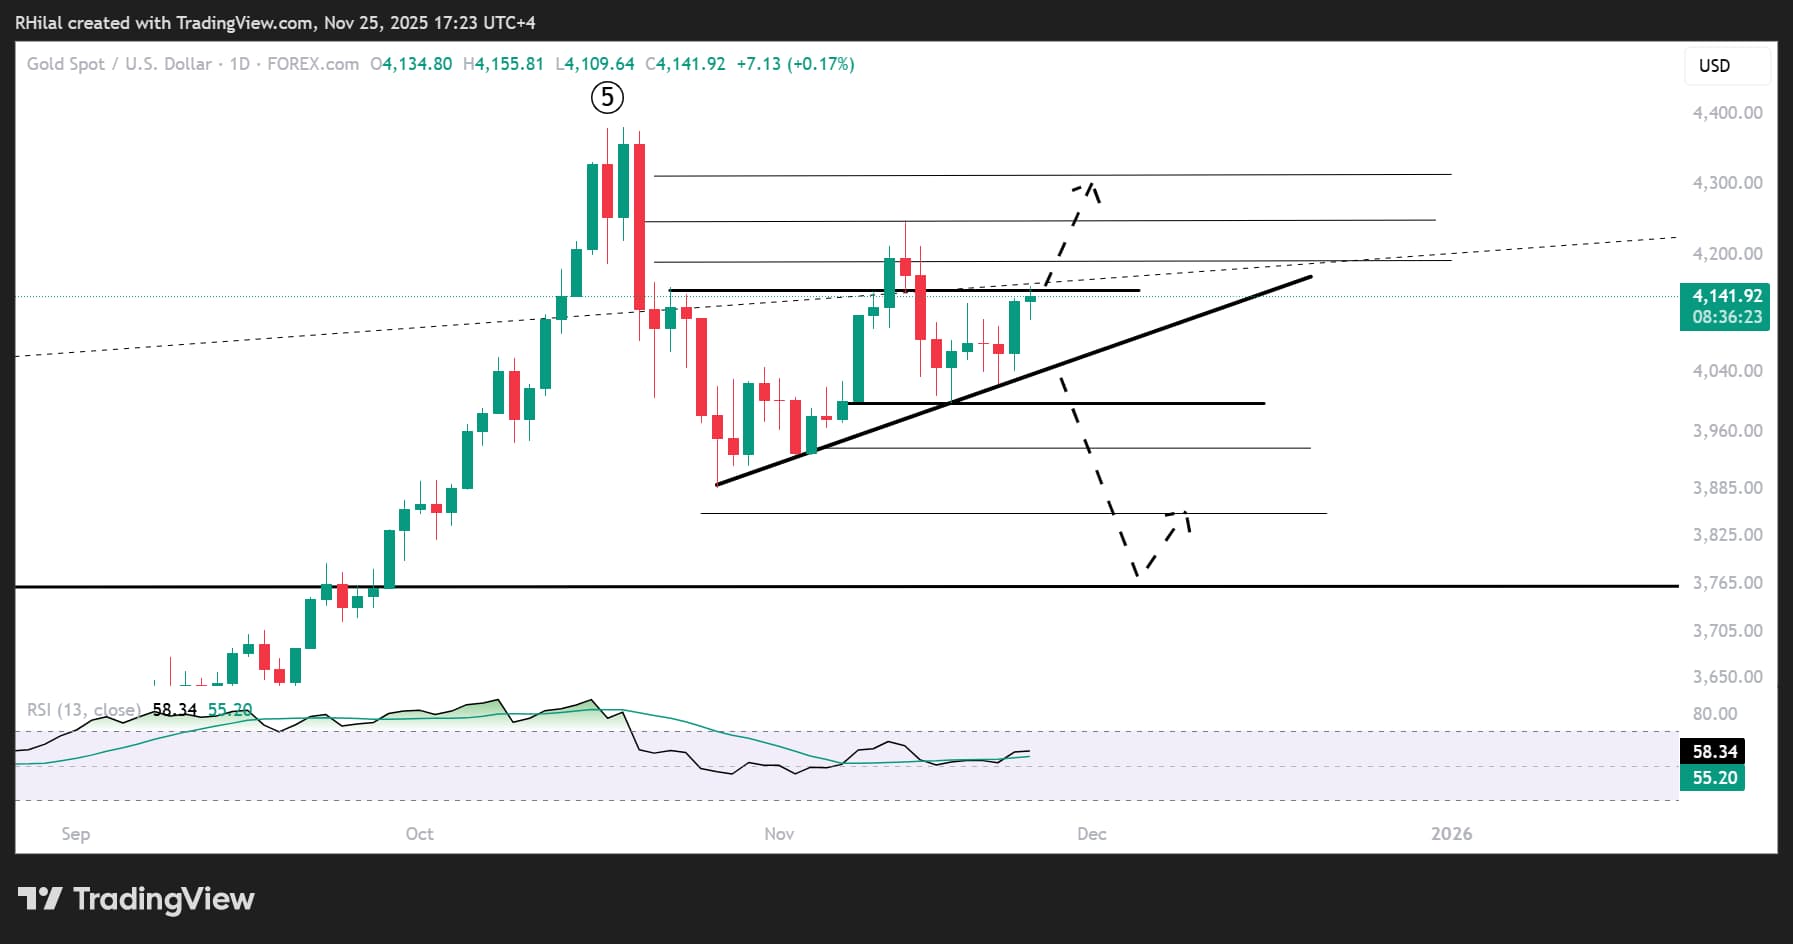
Gold Outlook: Daily Time Frame – Log Scale
Source: Trading view
From a daily perspective, gold is consolidating below the $4,200 resistance and above the $3,900 support — two defining levels that continue to shape the longer-term directional bias.
- On the upside, a confirmed hold above $4,150 and $4,280 could extend gains toward the $4,380 record, before either another retracement from this resistance or a potential continuation toward the $5,000 level.
- On the downside, a sustained move below $4,100, $4,000, and further below $3,900, could deepen the retracement toward $3,750 and $3,500. This area represents a key support zone, aligning with a trendline connecting consecutive higher highs between 2016 and 2020, and could serve as a continuation base for the broader uptrend — as shown in the monthly chart below.
- A short-term bullish bias remains intact above the trendline of higher lows formed since October 2025, defining the current market sentiment.
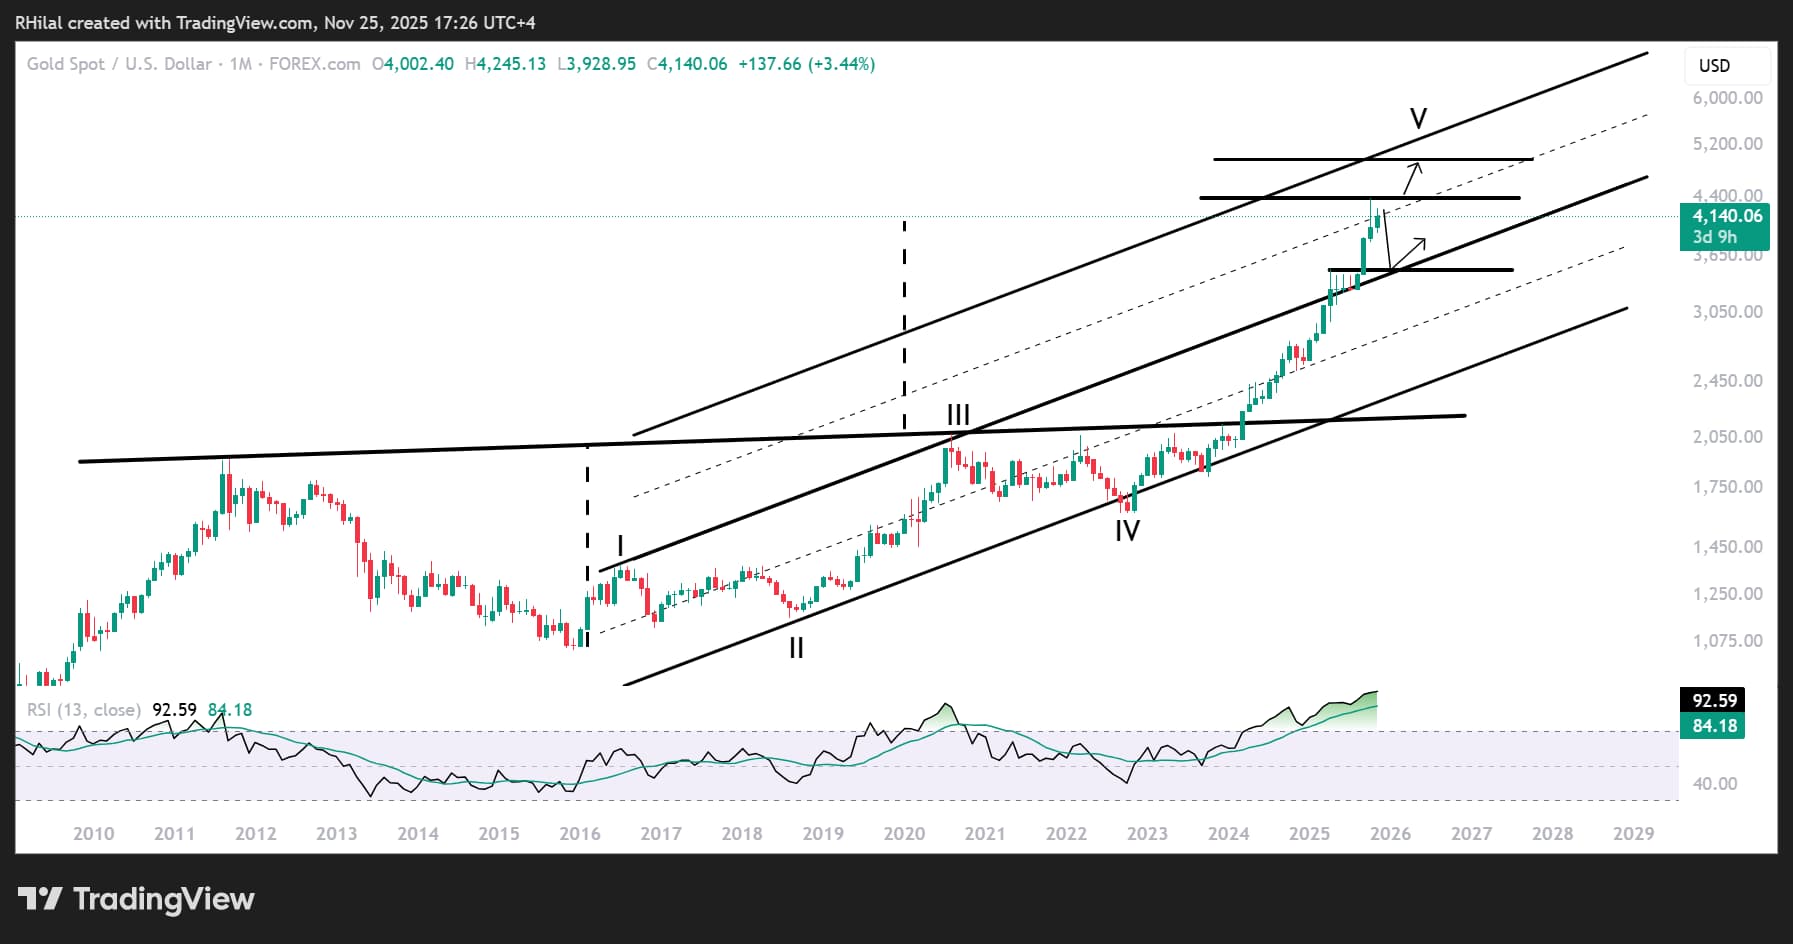
Gold Outlook: Monthly Time Frame – Log Scale
Source: Trading view
Given gold’s safe-haven status, there remains room for an acceleration toward the $5,000 psychological barrier, corresponding with the upper boundary of the duplicated 2016–2025 channel, should a clean hold above $4,400 emerge.
However, on the monthly chart, the $4,380 resistance aligns with the completion of a 10-year cup-and-handle formation extending from 2011, validating this area as a major retracement zone within the broader historical structure, in line with historical overbought momentum, eyeing a key support zone between $3,500–$3,750, aligned with the upper boundary of the 2016–2025 channel, should a close below the 3900 mark occur.
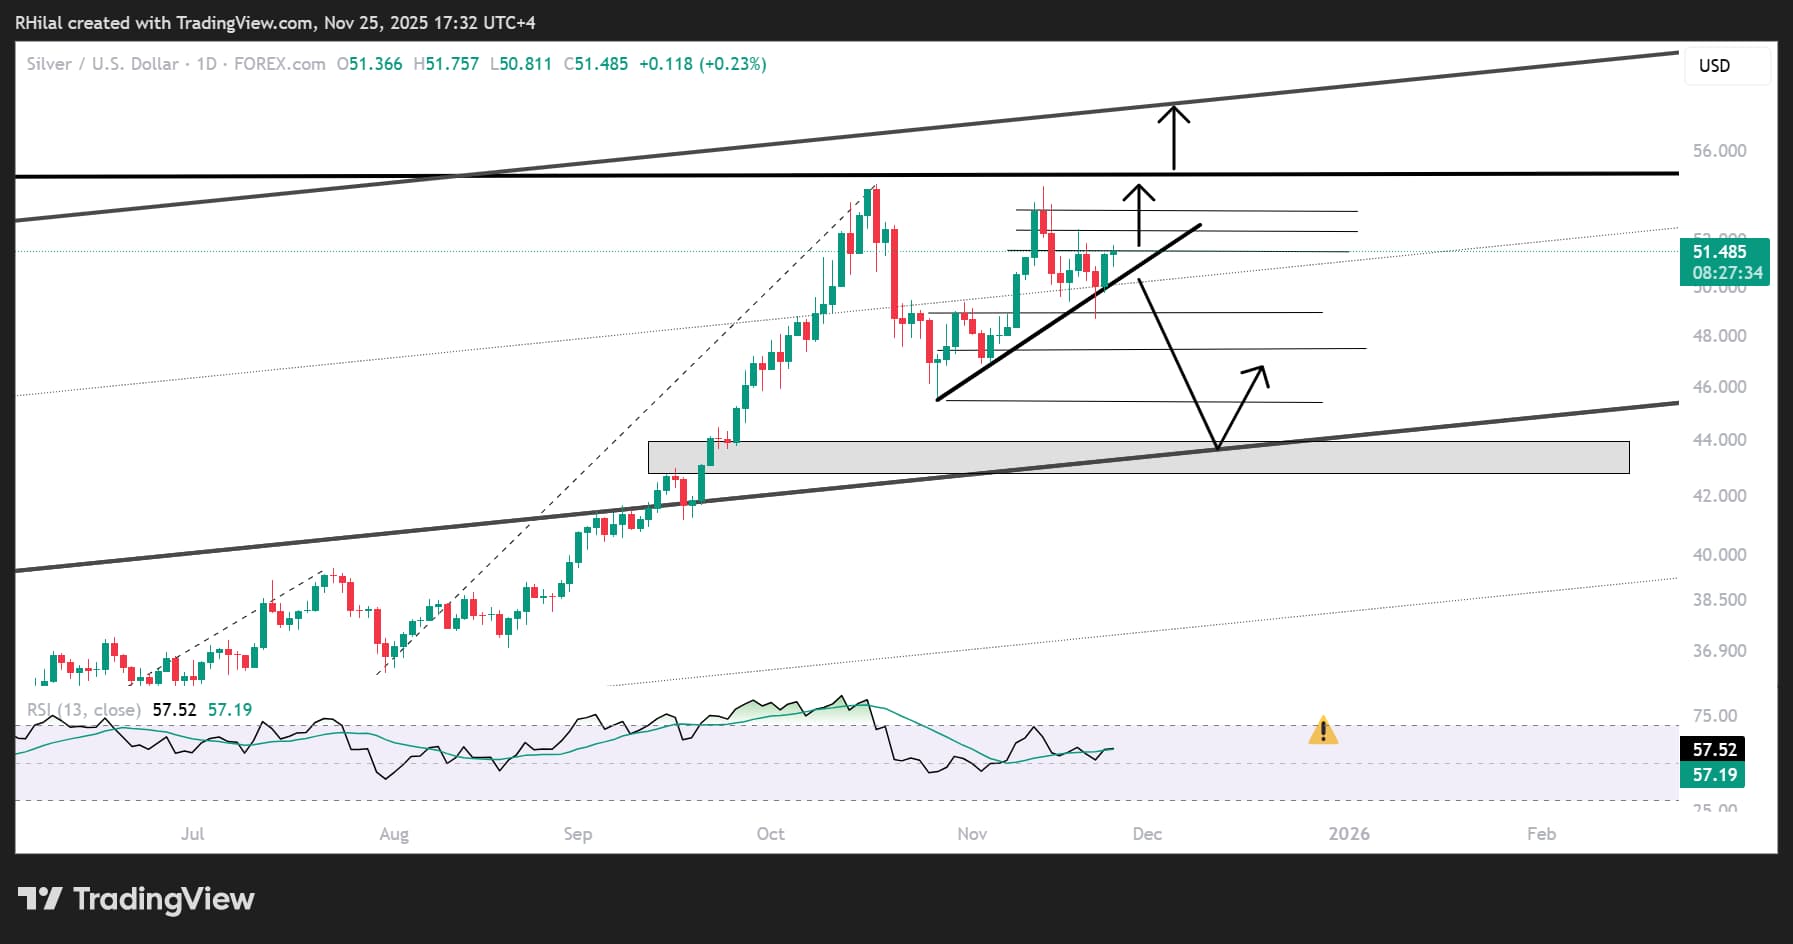
Silver Outlook: Daily Time Frame – Log Scale
Source: Trading view
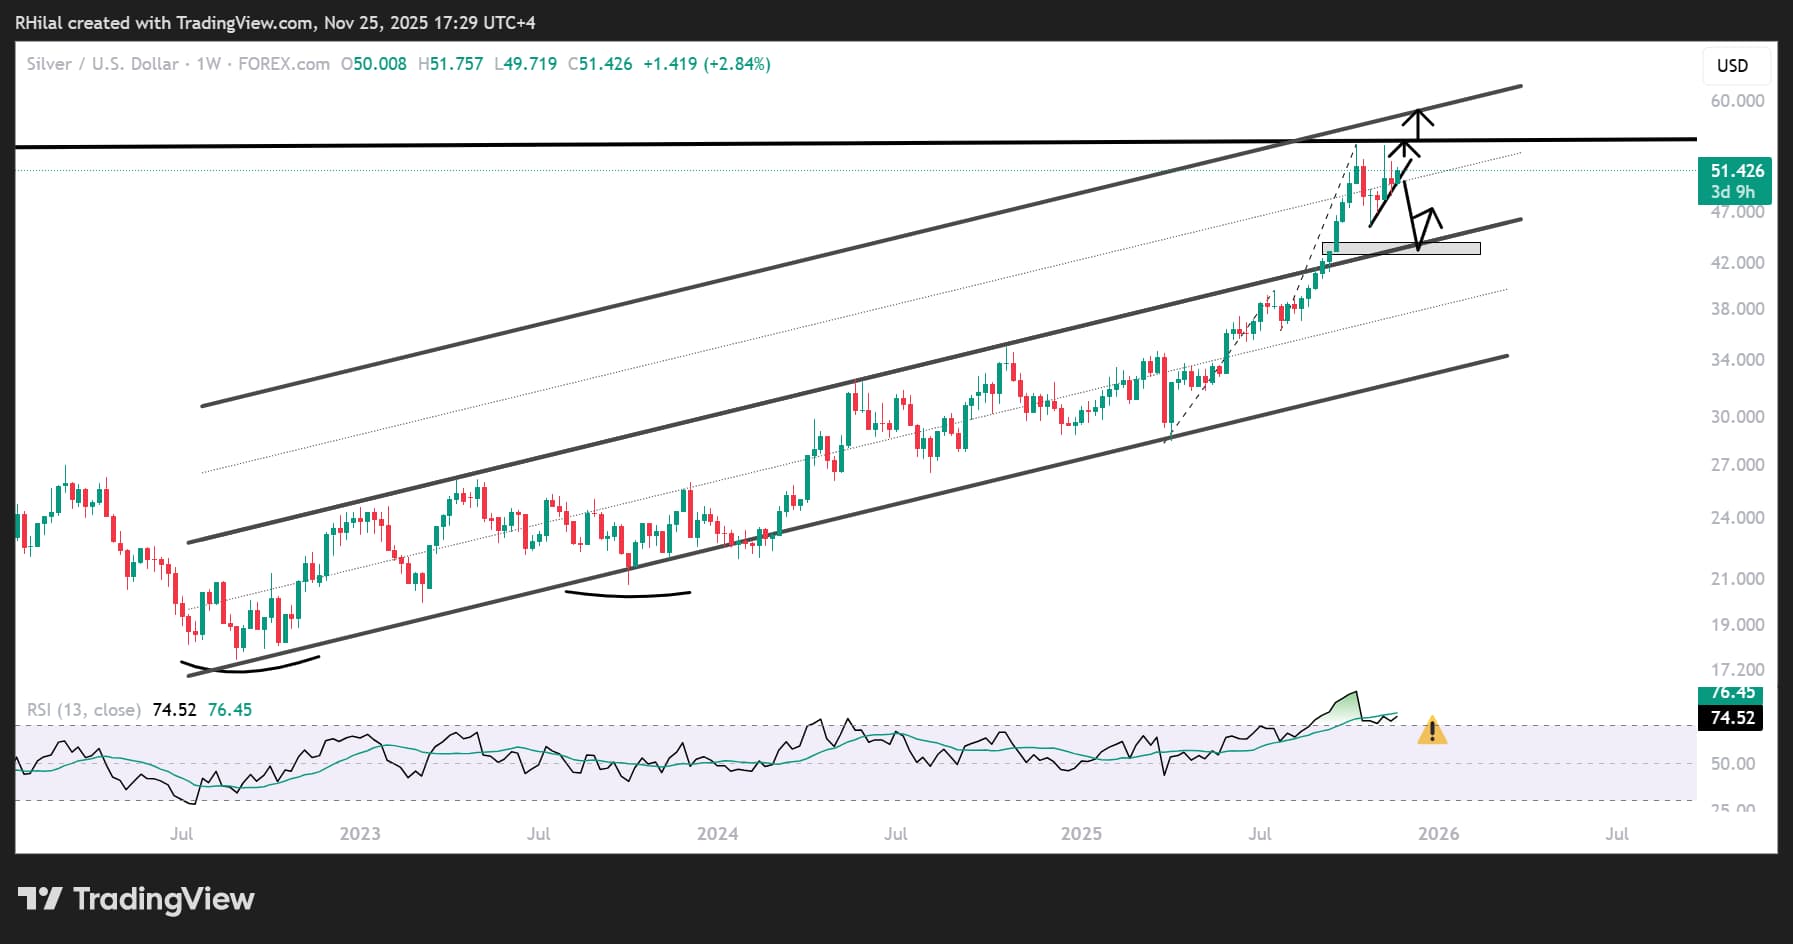
On the silver chart, the $54.80 record aligns with a 45-year resistance level, setting a clear dividing line between range-bound trading and the potential start of a new bullish phase that could place silver on a trajectory toward triple digits, should prices close above $54.
While silver’s industrial demand, particularly from the tech sector, continues to provide support for the long-term outlook, double-top risks remain present given the repeated pullbacks from the $54.30 high.
- A confirmed move above $52.50 and $54 could extend toward $57 and $60, the upper bound of the duplicated 2022-2025 channel
- Conversely, a break below $49, $46.80, and $45.00 could extend the retracement to the $43.90–$42.90 support zone, which aligns with the upper boundary of a channel extending from 2022 to 2025. This area could serve as a technical base before confirming whether the broader trend resumes. The channel boundary can be seen and analyzed on the weekly chart below.
Silver Outlook: Weekly Time Frame – Log Scale
Source: Trading view
Written by Razan Hilal, CMT
Follow on X: @Rh_waves