



S&P 500 Analysis: SPX moves away from 7,000 points under pressure from Nvidia
The session continues with a consistent decline in the SPX index, down more than 1.00% in the short term, with price moving further away from the 7,000-point level. Selling pressure remains in place, partly due to the lack of a solid recovery in overall market demand and also because of weakness in key components such as Nvidia.
Share this:

The session continues with a consistent decline in the SPX index, down more than 1.00% in the short term, with price moving further away from the 7,000-point level. Selling pressure remains in place, partly due to the lack of a solid recovery in overall market demand and also because of weakness in key components such as Nvidia, which has begun weighing on the index’s short-term price action. If this generalized lack of confidence persists, selling pressure on SPX could gain further relevance in the coming trading sessions.


Nvidia weighs on the market
The outlook for the SPX has turned negative as the top five components of the index post notable declines, led by Nvidia with a drop of approximately -4.43%, followed by Apple (-0.7%), Microsoft (-0.12%), Amazon (-1.38%), and Google (-2.04%). These companies account for more than 25% of the index’s weight, meaning their movements have a significant impact on SPX’s overall performance. This reflects a consistent lack of confidence in the index’s largest constituents in the short term.
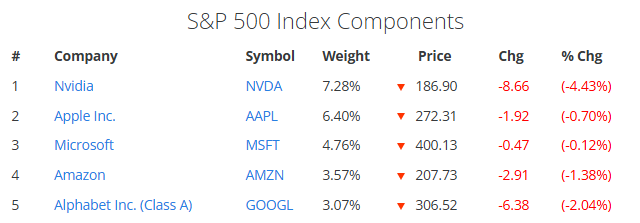
Source: Slickcharts
Part of this weakness is linked to Nvidia’s quarterly earnings released in the previous session. The company exceeded revenue expectations, reporting approximately $68 billion versus the projected $66 billion, representing growth of nearly 73% year-over-year. Earnings per share came in at $1.62, also beating expectations. In theory, these figures reflect strong performance driven by continued demand for artificial intelligence chips.
However, following the earnings release, the stock failed to sustain market confidence and began showing weakness not seen since November 2025. This may be because market expectations were already very elevated and part of the positive results had been priced in. There are also concerns related to stretched valuations and Nvidia’s dependence on capital spending by large technology companies investing in AI infrastructure. If the pace of AI investment moderates due to cost optimization efforts, it could indirectly affect Nvidia’s growth outlook.
In this context, Nvidia’s recent weakness may be contributing to broader selling pressure on the SPX. If concerns about potential overvaluation in the AI sector persist, selling pressure could remain relevant in the coming sessions.
Long-term confidence remains indecisive
Looking at broader equity market sentiment, the latest AAII Investor Sentiment Survey shows that 33.2% of participants remain bullish, 27.0% neutral, and 39.8% bearish. These figures suggest that confidence is not fully aligned to support a clearly optimistic outlook for indices such as the SPX in the coming months.
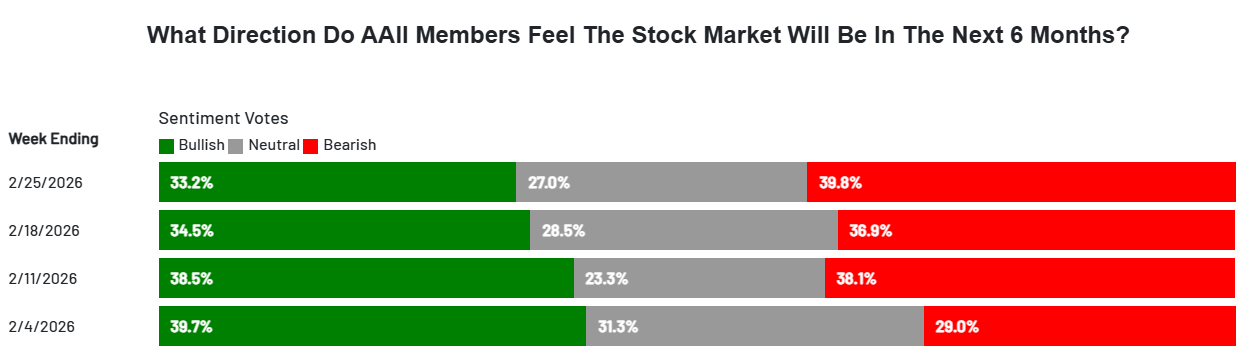
Source: AAII
If sentiment fails to improve consistently, the environment may remain unfavorable for sustaining stable demand for the SPX in the short term, potentially prolonging the current sense of weakness in the index.
Technical outlook for the S&P 500

Source: StoneX, Tradingview
- Dominant sideways range: Over recent months, the SPX has maintained a neutral bias within a range defined by resistance near 7,000 points and support around 6,700 points. This lateral channel remains the most relevant technical structure. As long as these levels hold, it will be difficult to consolidate a clear directional trend, maintaining an indecisive environment that could even favor episodes of further short-term weakness.
- RSI: The RSI is fluctuating around the neutral 50 level, indicating balance between buying and selling momentum. As long as this dynamic persists, neutrality is likely to remain dominant in the SPX.
- MACD: The MACD histogram is hovering near the zero line, reflecting equilibrium in short-term moving average strength. This condition reinforces the indecisive outlook and makes the formation of a clear trend more difficult.
Key levels:
- 7,000 points – Key resistance: Level aligned with the index’s historical highs and representing a crucial psychological barrier within the current structure. Sustained moves above this area could reactivate a more dominant buying bias and open the door to a potential short-term bullish extension.
- 6,881 points – Near-term barrier: Relevant neutrality zone aligned with the 50-period simple moving average. As long as price continues fluctuating around this level without breaking decisively away, the current sideways range could remain intact, reinforcing an indecisive scenario and limiting the development of clearer directional moves.
- 6,728 points – Key support: Level corresponding to recent significant lows and defining the lower boundary of the sideways channel. Sustained declines below this area could activate a more consistent selling dominance in the coming weeks.
Written by Julian Pineda, CFA, CMT – Market Analyst
Follow him on: @julianpineda25
Related tags:



Open an account in minutes
Experience award-winning platforms with fast and secure execution.
Economic calendar
Web Trader platform
Our sophisticated web-based platform is packed with features.
Related articles

S&P, Nasdaq Slide as NVDA, AI Worries Continue to Build
It was a busy weekend in the headlines as a campaign to bring back Jensen Huang atop NVDA gained steam, even with accusations of possible treason and a circular funding model that has started to raise questions.


Nikkei swings harder than Nasdaq as AI fears deepen
Nikkei 225 volatility is running well ahead of Nasdaq 100, with the index construction and Japan's heavy exposure to AI manufacturing potentially explaining the difference.

S&P 500, Nasdaq 100 Claw Back But NVDA Cloud Looms Overhead
Last week was green for both the Nasdaq and S&P 500 but given the sell-off that led into that bounce there’s still a very real question as to whether bears still have a statement to make. And the NVDA situation presents a very real threat.
StoneX Financial Ltd (trading as "FOREX.com") is an execution-only service provider. This material, whether or not it states any opinions, is for general information purposes only and it does not take into account your personal circumstances or objectives. This material has been prepared using the thoughts and opinions of the author and these may change. However, FOREX.com does not plan to provide further updates to any material once published and it is not under any obligation to keep this material up to date.
This material is short term in nature and may only relate to facts and circumstances existing at a specific time or day. Nothing in this material is (or should be considered to be) financial, investment, legal, tax or other advice and no reliance should be placed on it. No opinion given in this material constitutes a recommendation by FOREX.com or the author that any particular investment, security, transaction or investment strategy is suitable for any specific person.
The material has not been prepared in accordance with legal requirements designed to promote the independence of investment research. Although FOREX.com is not specifically prevented from dealing before providing this material, FOREX.com does not seek to take advantage of the material prior to its dissemination. This material is not intended for distribution to, or use by, any person in any country or jurisdiction where such distribution or use would be contrary to local law or regulation. For further details see our full non-independent research disclaimer and quarterly summary.