



The CRB Index Paints A Bleak Picture For Commodities Silver Natural Gas
Trade wars are clearly taking their toll on markets. Yet the bigger picture for the CRB index (and therefor its components) suggests it may have seen a cyclical top.
Share this:

Trade wars are clearly taking their toll on markets. Yet the bigger picture for the CRB index (and therefor its components) suggests it may have seen a cyclical top.
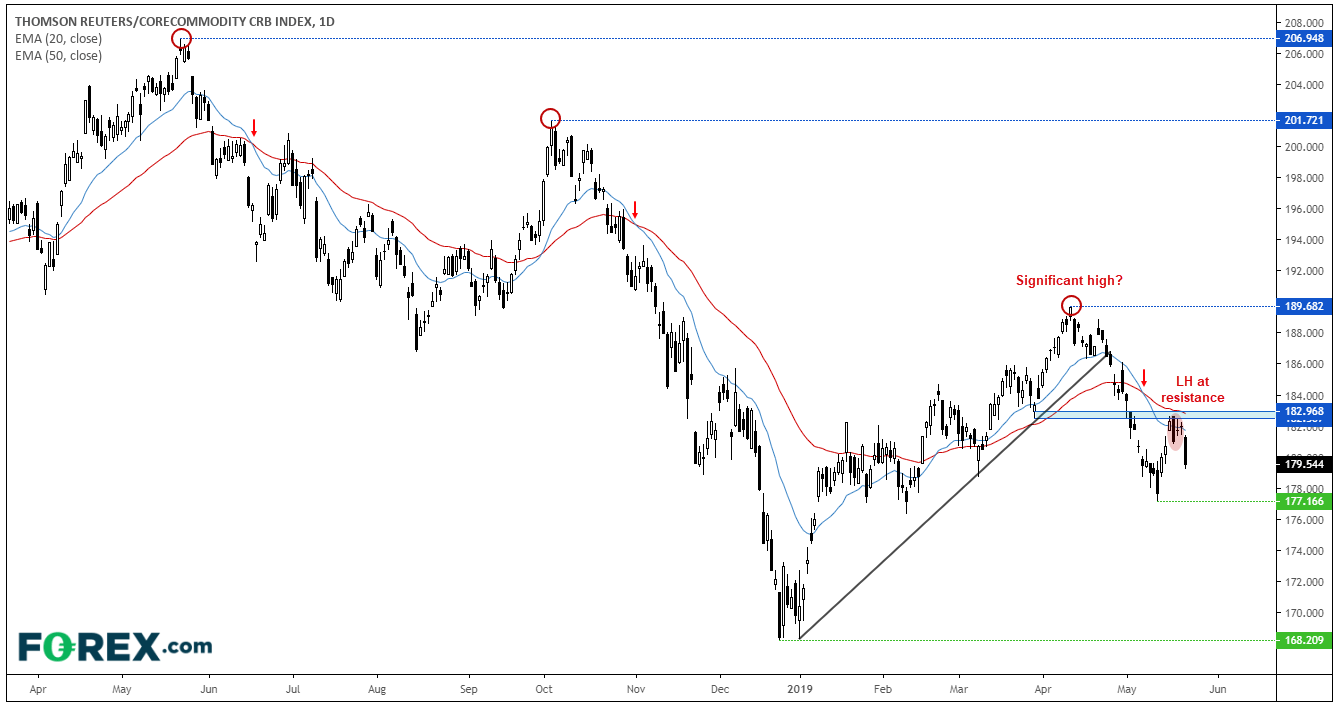
Whilst the bleeding on equities has slowed to a degree, the weakness among commodities overall cannot go unnoticed. For this we can take a broad look at a commodity basket called the Thomson Reuters CoreCommodity CRB, which is made up of 19 components and essentially the Dow Jones Industrial Average for commodities. Whilst energy accounts for the largest sector within the index at 39%, agriculture is close behind at 34% and metals is just 20%. However, whilst the ongoing trade war between US and China persists, agriculture and metals are arguably going to face the most pressure within the index.
On the daily chart we can see the CRB index has broken a bullish trendline, plummeted -6.6% and printed a lower since its 189.68 high. Since finding resistance at the 20 and 50-day eMA’s and 183 lows, price action has been reminiscent of a swing trade. Furthermore, the longer-term picture suggests the 189.68 swing could be significant and comparable to the 201.72 and 206.95 highs, all of which have been followed by a death cross from the moving averages. If so, it suggests some commodities could break to new lows.
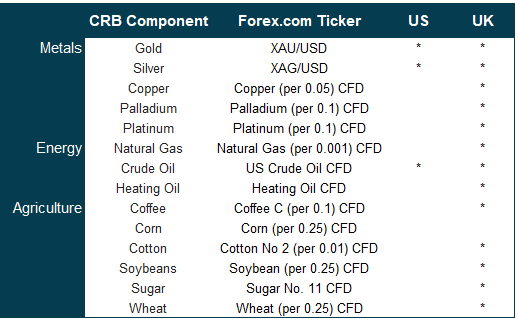
Of the 19 CRB components, here are the available markets via forex.com (dependant on region). Below are two markets which we have a bearish bias on over the near-term, until key levels of resistance break.
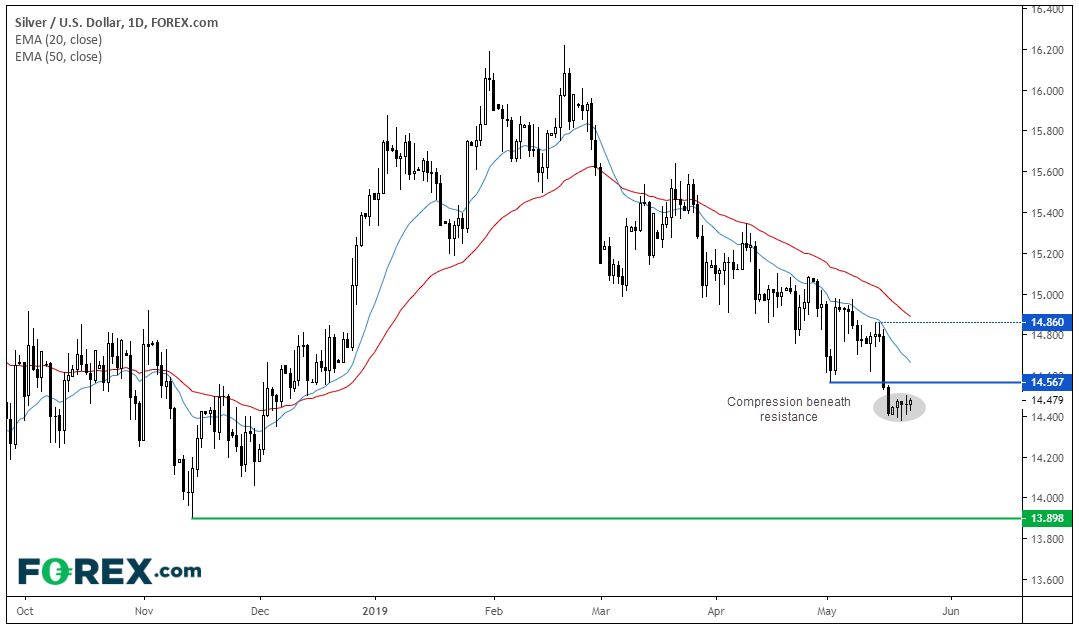
Silver: The daily chart has been grinding lower since mid-February, yet last week prices saw a clear break of key support at $14.56. With prices now consolidating beneath this key level, we’re looking for bearish momentum to return and break it out of compression. A clear break above $14.56 places it on the backburner, although the trend remains technically bearish below. Gold could also be looking to break lower, so check out yesterday's gold post by by colleague Fawad Razaqzada: Gold on the brink.
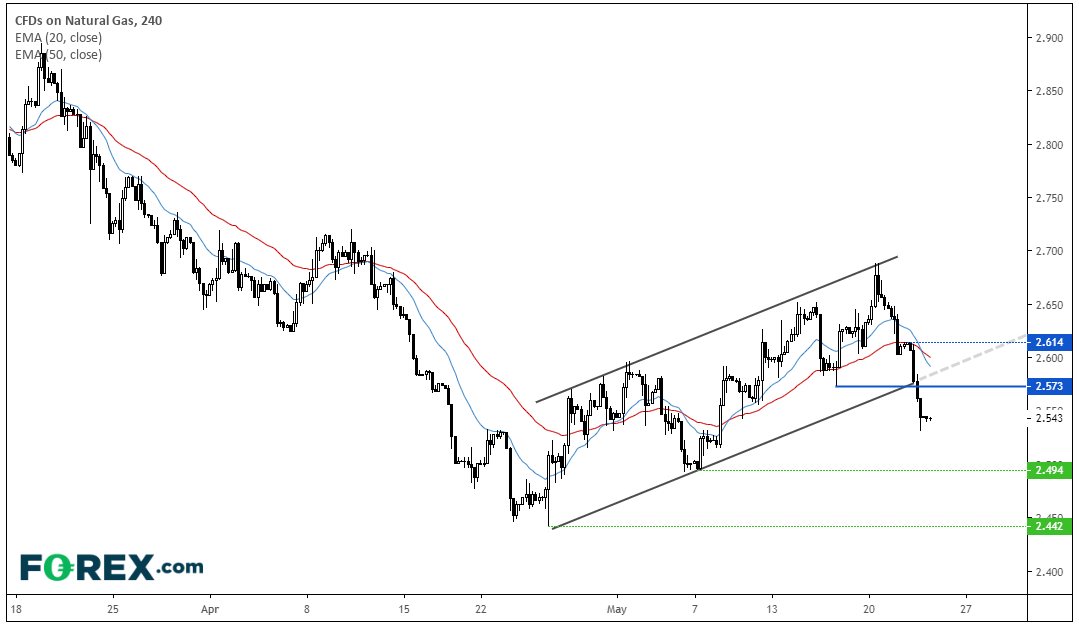
Natural gas: The four-hour chart has seen a breakout of its bearish channel. Prices appear over-extended to the downside over the near-term, but bears could look to fade into rallies. Ideally any rebound will remain beneath the 2.57 low, however we could also use the broken channel as a rising resistance line to fade into if necessary (or await bearish momentum to return after respecting a key level).
Related tags:




Open an account in minutes
Experience award-winning platforms with fast and secure execution.
Economic calendar
Web Trader platform
Our sophisticated web-based platform is packed with features.
Related articles

Nasdaq 100 Forecast: NDX falls ahead of Nvidia’s earnings & Anthropic’s debut this week
U.S. stocks are heading for a weaker open amid a challenging macro backdrop and with AI-linked stocks once again under pressure ahead of Nvidia's results later this week. Attention is also turning to Anthropic's highly anticipated IPO.


Crude Oil Weekly Outlook: Geopolitics vs Oversupply Risks
Crude Oil Weekly Outlook: The IEA has flagged the risk of an oil supply surplus since the Iran war began. Yet WTI and Brent have held onto bullish rebounds from key support near 84 and 89, respectively, as geopolitical risks persist.

S&P 500 forecast: SPX struggles for direction ahead of PPI data
U.S. stocks are struggling for direction on Friday as investors continue to weigh up the fallout from Nvidia’s leadership change, rising Treasury yields and the upcoming U.S. producer price inflation data.
StoneX Financial Ltd (trading as "FOREX.com") is an execution-only service provider. This material, whether or not it states any opinions, is for general information purposes only and it does not take into account your personal circumstances or objectives. This material has been prepared using the thoughts and opinions of the author and these may change. However, FOREX.com does not plan to provide further updates to any material once published and it is not under any obligation to keep this material up to date.
This material is short term in nature and may only relate to facts and circumstances existing at a specific time or day. Nothing in this material is (or should be considered to be) financial, investment, legal, tax or other advice and no reliance should be placed on it. No opinion given in this material constitutes a recommendation by FOREX.com or the author that any particular investment, security, transaction or investment strategy is suitable for any specific person.
The material has not been prepared in accordance with legal requirements designed to promote the independence of investment research. Although FOREX.com is not specifically prevented from dealing before providing this material, FOREX.com does not seek to take advantage of the material prior to its dissemination. This material is not intended for distribution to, or use by, any person in any country or jurisdiction where such distribution or use would be contrary to local law or regulation. For further details see our full non-independent research disclaimer and quarterly summary.