

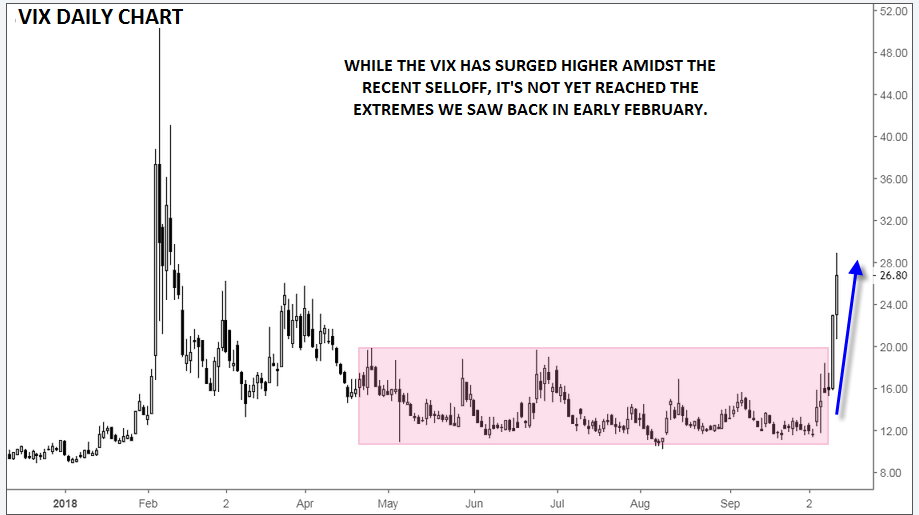


VIX Shows Elevated Fear Among SP 500 Traders But Not Yet at PostGFC Peaks
After pausing briefly on this morning’s slightly softer-than-anticipated inflation data (see my colleague Fawad Razaqzada’s post, “Dollar extends but CPI miss not a game changer” for more), US stocks have resumed yesterday’s selling rout. As of writing, the Dow Jones Industrial Average is trading off by another 500+ points, with the S&P 500 falling by more than 2% as well.
Share this:

After pausing briefly on this morning’s slightly softer-than-anticipated inflation data (see my colleague Fawad Razaqzada’s post, “Dollar extends but CPI miss not a game changer” for more), US stocks have resumed yesterday’s selling rout. As of writing, the Dow Jones Industrial Average is trading off by another 500+ points, with the S&P 500 falling by more than 2% as well.
Interestingly, the tech-heavy Nasdaq index (-1.2% as we go to press) is outperforming the more traditional large-cap indices after seeing the worst performance yesterday, but when it comes to US stocks, there’s nowhere to hide. All 11 sector SPDR ETFs are falling on the day, with Energy leading the way lower at -3% as WTI sheds 3.5% on the day.
That said, we are seeing some differentiated performance among other asset classes, unlike yesterday. High-quality bonds are on the rise, with yields on the benchmark 10-year Treasury falling 4bps to 3.13%. Perhaps most impressively, the long-maligned “useless yellow rock” has quietly broken out of its two-month range to trade up near $1225, its highest level since late July.
Not surprisingly, this week’s market disruption has led to a big surge in the CBOE’s Volatility Index, Wall Street’s so-called “fear index.” The VIX measures the market’s expectation for volatility over the next 30 days, using the implied volatility of the front two months’ put and call options on the S&P 500.
While the calculation itself would put most readers to sleep, the current VIX chart is worth watching. After hitting historic lows under 9 through last year’s consistent rally, the VIX exploded to a peak above 50 amidst the last major interest-rate-driven market disruption in early February. After settling back down into the low teens throughout Q2 and Q3, the index has surged to peak near 29 so far today.
What does that tell us? For one, traders are not (yet) pricing as much volatility as they were in early February; colloquially, you could say that traders are not as “scared” as they were back in February. It would likely take another day or two of strong selling pressure to reach a peak in the 48+ range that has marked significant bottoms on four occasions (May 2010, August/September 2011, August 2015, and February of this year). That said, we’ve seen plenty of near-term market lows form with VIX readings in the 25-30 range, so we may well see a bottom form in the coming days.
While its notoriously difficult to trade, the VIX can provide a real-time gauge of the amount of panic in the US stock market; based on the current reading, traders are clearly wary, but fear has not yet reached the post-GFC peaks that marked major longer-term bottoms.
Source: TradingView, FOREX.com
Related tags:



Open an account in minutes
Experience award-winning platforms with fast and secure execution.
Economic calendar
Web Trader platform
Our sophisticated web-based platform is packed with features.
Related articles

S&P, Nasdaq Slide as NVDA, AI Worries Continue to Build
It was a busy weekend in the headlines as a campaign to bring back Jensen Huang atop NVDA gained steam, even with accusations of possible treason and a circular funding model that has started to raise questions.


S&P 500, Nasdaq 100 Claw Back But NVDA Cloud Looms Overhead
Last week was green for both the Nasdaq and S&P 500 but given the sell-off that led into that bounce there’s still a very real question as to whether bears still have a statement to make. And the NVDA situation presents a very real threat.

S&P 500 forecast: SPX struggles for direction ahead of PPI data
U.S. stocks are struggling for direction on Friday as investors continue to weigh up the fallout from Nvidia’s leadership change, rising Treasury yields and the upcoming U.S. producer price inflation data.

StoneX Financial Ltd (trading as "FOREX.com") is an execution-only service provider. This material, whether or not it states any opinions, is for general information purposes only and it does not take into account your personal circumstances or objectives. This material has been prepared using the thoughts and opinions of the author and these may change. However, FOREX.com does not plan to provide further updates to any material once published and it is not under any obligation to keep this material up to date.
This material is short term in nature and may only relate to facts and circumstances existing at a specific time or day. Nothing in this material is (or should be considered to be) financial, investment, legal, tax or other advice and no reliance should be placed on it. No opinion given in this material constitutes a recommendation by FOREX.com or the author that any particular investment, security, transaction or investment strategy is suitable for any specific person.
The material has not been prepared in accordance with legal requirements designed to promote the independence of investment research. Although FOREX.com is not specifically prevented from dealing before providing this material, FOREX.com does not seek to take advantage of the material prior to its dissemination. This material is not intended for distribution to, or use by, any person in any country or jurisdiction where such distribution or use would be contrary to local law or regulation. For further details see our full non-independent research disclaimer and quarterly summary.