



WTI crude oil prices finely balanced
Oil prices managed to recover from sharp losses yesterday, but still remain in the red on the week.
Share this:

Oil prices managed to recover from sharp losses yesterday, but still remain in the red on the week. At the start of today’s session, prices were a little weaker as speculators made a more sober assessment of yesterday’s oil report. At first sight, the EIA’s weekly crude stocks data appeared bullish. After all, the headline drawdown in US oil inventories of 4.6 million barrels was much better than 1.4 million expected. What’s more, stocks of gasoline also fell while crude oil processing rose more robustly than expected. However, stocks of crude oil at Cushing rose by a sharp 3.7 million barrels. On top of this, distillate stocks rose, as too did US oil production. However, the market chose to focus on the good aspects of the oil report and price responded positively as a result. Market participants probably chose to ignore the latest rise in US oil production because of the fact that OPEC’s own production appears to be falling at the same time. According to a Reuters survey, OPEC’s production fell by 90,000 barrels per day in March compared to the previous month. This is unlikely to last – we expect the OPEC to ramp up its output back towards its agreed production levels. Overall, the oil market remains amply supplied and we don’t expect prices to move up in a meaningful way over the course of the year. We think that the upside is limited and that the risks are skewed to the downside.
However, for the time being, the technical outlook remains modestly bullish and prices may continue pushing higher a little further before we potentially see the top. In fact, WTI formed a long-legged doji candle on its daily chart yesterday. This pattern is typically bullish when it occurs after a pullback. This particular one has actually happened at support between $62.20 and $62.55, and above the 50-day moving average at $62.78. So far however there hasn’t been any follow-through on the upside as resistance between $63.75 and $64.20 has held firm. If and when this resistance range breaks only then may we see some follow-up technical buying pressure. If this bullish scenario plays out, then we wouldn’t be surprised if WTI were to climb back towards the top of its range and this year’s earlier high at $66.60/5 area over the coming days.
However, if the abovementioned doji candle turns out to be a false signal and price breaks below it in the coming days then this would be a bearish development. In this potential scenario, WTI will most likely head below the recent range low at $60. And if there is acceptance below $60 then who knows how much further it may drop.
But that is the alternative scenario; our base case is that it will push higher given the formation of the bullish-looking candle yesterday. In any case, conservative traders may wish to wait for price to make up its mind before deciding on the direction. And given the recent choppy price action, traders may wish to remain nimble and trade from one level to the next, rather than looking for swing/position setups.
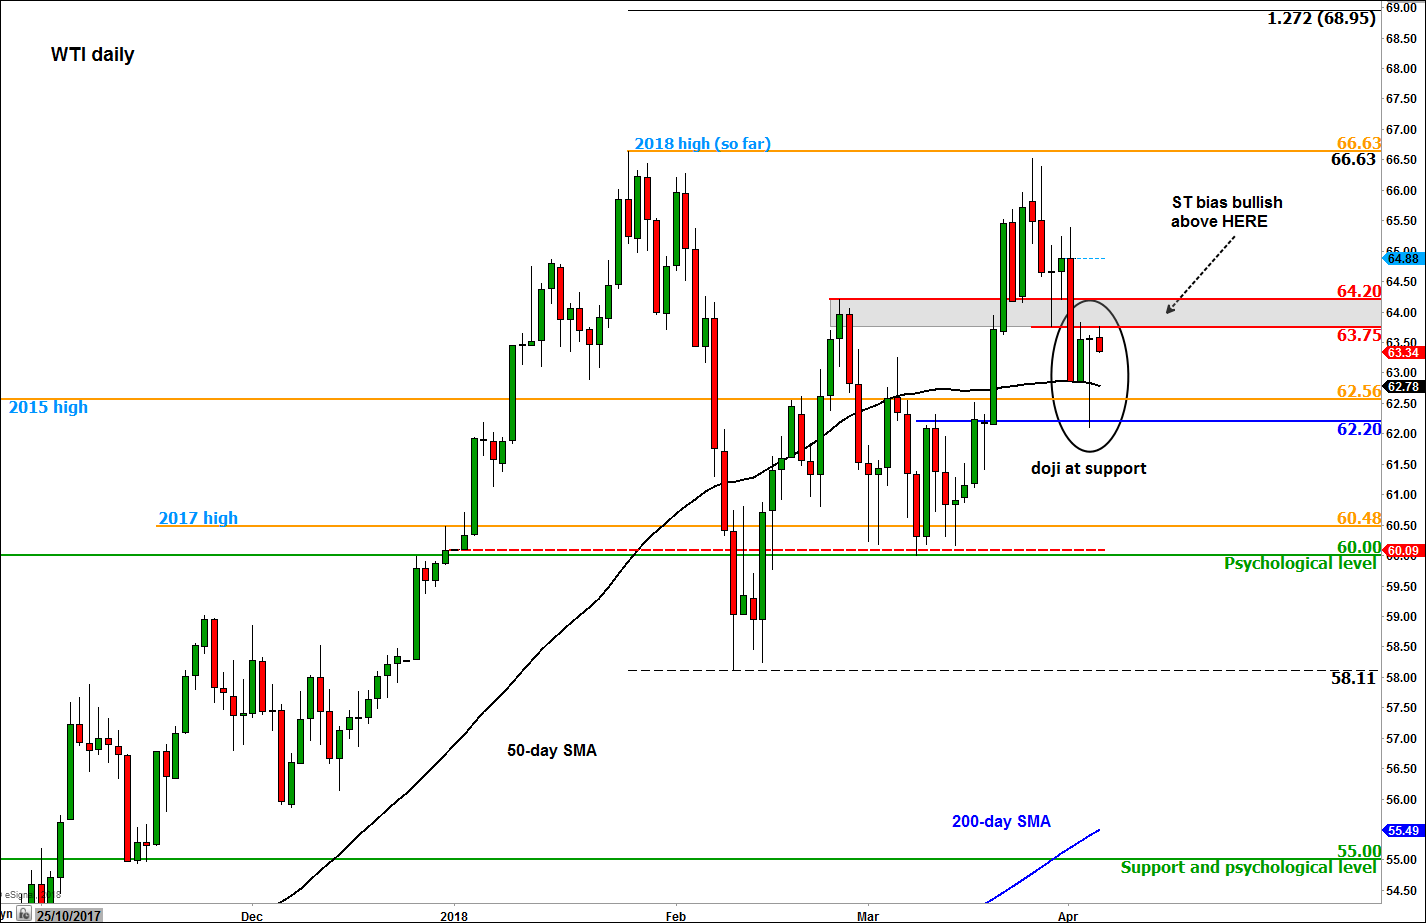
Source: eSignal and FOREX.com. Please note, this product is not available to US clients




Open an account in minutes
Experience award-winning platforms with fast and secure execution.
Economic calendar
Web Trader platform
Our sophisticated web-based platform is packed with features.
Related articles

Nasdaq 100 Forecast: NDX falls ahead of Nvidia’s earnings & Anthropic’s debut this week
U.S. stocks are heading for a weaker open amid a challenging macro backdrop and with AI-linked stocks once again under pressure ahead of Nvidia's results later this week. Attention is also turning to Anthropic's highly anticipated IPO.


Crude Oil Weekly Outlook: Geopolitics vs Oversupply Risks
Crude Oil Weekly Outlook: The IEA has flagged the risk of an oil supply surplus since the Iran war began. Yet WTI and Brent have held onto bullish rebounds from key support near 84 and 89, respectively, as geopolitical risks persist.

S&P 500 forecast: SPX struggles for direction ahead of PPI data
U.S. stocks are struggling for direction on Friday as investors continue to weigh up the fallout from Nvidia’s leadership change, rising Treasury yields and the upcoming U.S. producer price inflation data.
StoneX Financial Ltd (trading as "FOREX.com") is an execution-only service provider. This material, whether or not it states any opinions, is for general information purposes only and it does not take into account your personal circumstances or objectives. This material has been prepared using the thoughts and opinions of the author and these may change. However, FOREX.com does not plan to provide further updates to any material once published and it is not under any obligation to keep this material up to date.
This material is short term in nature and may only relate to facts and circumstances existing at a specific time or day. Nothing in this material is (or should be considered to be) financial, investment, legal, tax or other advice and no reliance should be placed on it. No opinion given in this material constitutes a recommendation by FOREX.com or the author that any particular investment, security, transaction or investment strategy is suitable for any specific person.
The material has not been prepared in accordance with legal requirements designed to promote the independence of investment research. Although FOREX.com is not specifically prevented from dealing before providing this material, FOREX.com does not seek to take advantage of the material prior to its dissemination. This material is not intended for distribution to, or use by, any person in any country or jurisdiction where such distribution or use would be contrary to local law or regulation. For further details see our full non-independent research disclaimer and quarterly summary.