



WTI hits resistance ahead of crude oil inventories data
Crude oil prices have not gone anywhere fast over the past couple of weeks. The decision by the OPEC+ group to extend production cuts for nine months failed to trigger a rally in prices, as investors remained concerned about the prospects of slower demand growth and rising output from non-OPEC producers.
Share this:

Crude oil prices have not gone anywhere fast over the past couple of weeks. The decision by the OPEC+ group to extend production cuts for nine months failed to trigger a rally in prices, as investors remained concerned about the prospects of slower demand growth and rising output from non-OPEC producers. So, prices are finely balanced right now as investors await fresh stimulus. The stimulus could come in the form of a sharp change in US crude oil inventories. Over the past few weeks, the Energy Information Administration (EIA) has reported falling inventory levels, which has helped to limit the downside for prices. According to the EIA, oil inventories have fallen by 3.1, 12.8 and 1.1 million barrels over the past three weeks, respectively. Another sharp reduction could see WTI prices stage a rally, while if inventories show a surprisingly large build then that could weigh on prices. Anything else will probably not have too much of an impact, although prices could still spike in knee-jerk reaction. The official EIA data will be published tomorrow afternoon, while the unofficial figures from the American Petroleum Institute (API), an industry group, will come out this evening. The API data does sometimes overshadow the EIA’s figures, although it is not always reliable as we have seen large discrepancies between the two estimates.
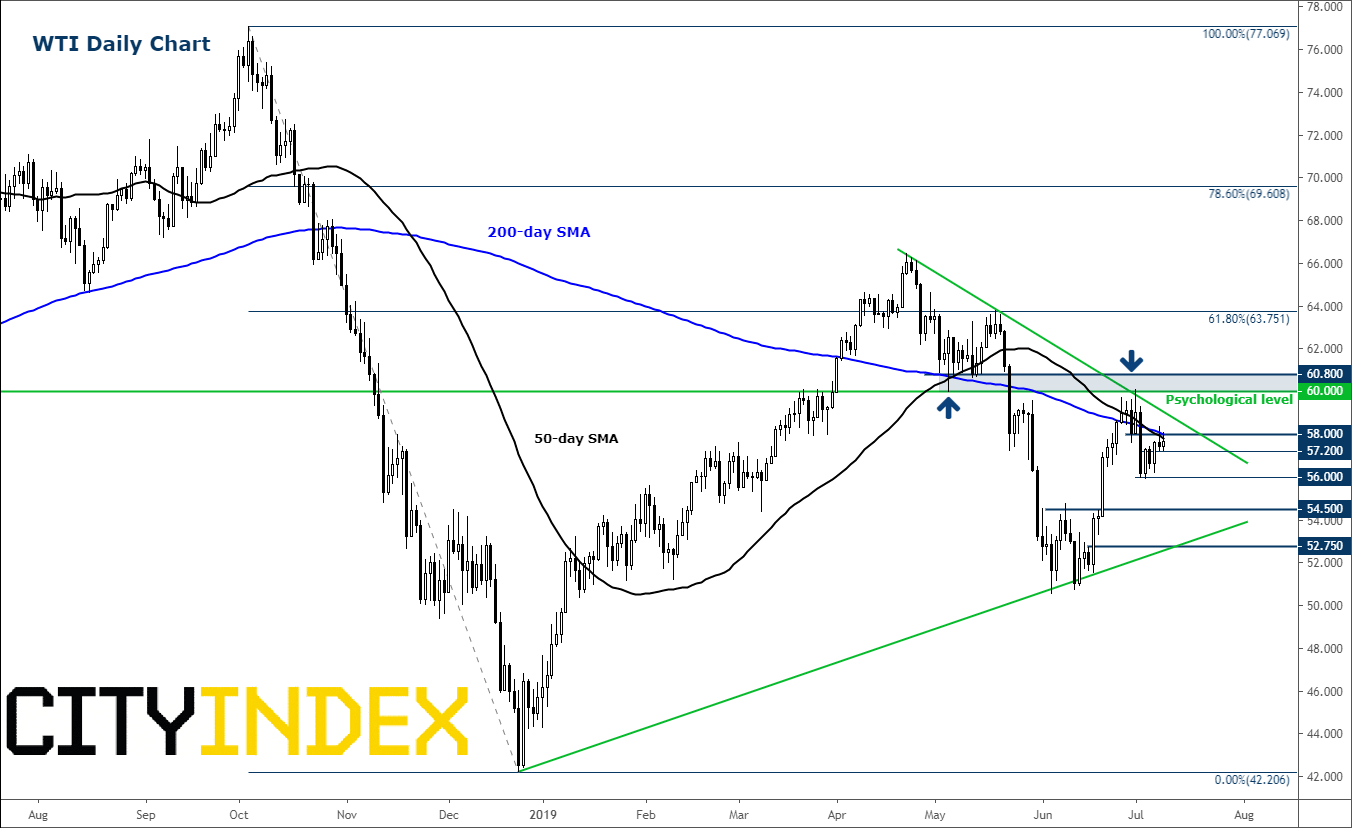
Ahead of the publication of the latest inventories data, WTI crude oil continues to trade inside narrowing ranges, with the upside capped by a bearish trend line and the downside supported by a bullish trend line. Within these converging trend lines, oil prices have hit a key resistance level around $58.00, where an old support meets both the 50- and 200-day moving averages. Given the negative slope of these moving averages, and proximity of WTI from the resistance trend line, we would not be surprised if prices turned lower from here. However, for the bears to step in, we need short-term support at $57.20 to give way first. If so, WTI could fall and take out liquidity below the most recent low at $56.00 next. Key supports thereafter come in at $54.50, which was previously resistance, followed by $52.75 – the base of the recent breakout, where the bullish trend line also comes into play. Meanwhile, if the bulls reclaim $58.00 then a subsequent rally towards the next resistance circa $60.80 would become likely.
Source: Trading View and City Index.
Crude oil prices have not gone anywhere fast over the past couple of weeks. The decision by the OPEC+ group to extend production cuts for nine months failed to trigger a rally in prices, as investors remained concerned about the prospects of slower demand growth and rising output from non-OPEC producers. So, prices are finely balanced right now as investors await fresh stimulus. The stimulus could come in the form of a sharp change in US crude oil inventories. Over the past few weeks, the Energy Information Administration (EIA) has reported falling inventory levels, which has helped to limit the downside for prices. According to the EIA, oil inventories have fallen by 3.1, 12.8 and 1.1 million barrels over the past three weeks, respectively. Another sharp reduction could see WTI prices stage a rally, while if inventories show a surprisingly large build then that could weigh on prices. Anything else will probably not have too much of an impact, although prices could still spike in knee-jerk reaction. The official EIA data will be published tomorrow afternoon, while the unofficial figures from the American Petroleum Institute (API), an industry group, will come out this evening. The API data does sometimes overshadow the EIA’s figures, although it is not always reliable as we have seen large discrepancies between the two estimates.
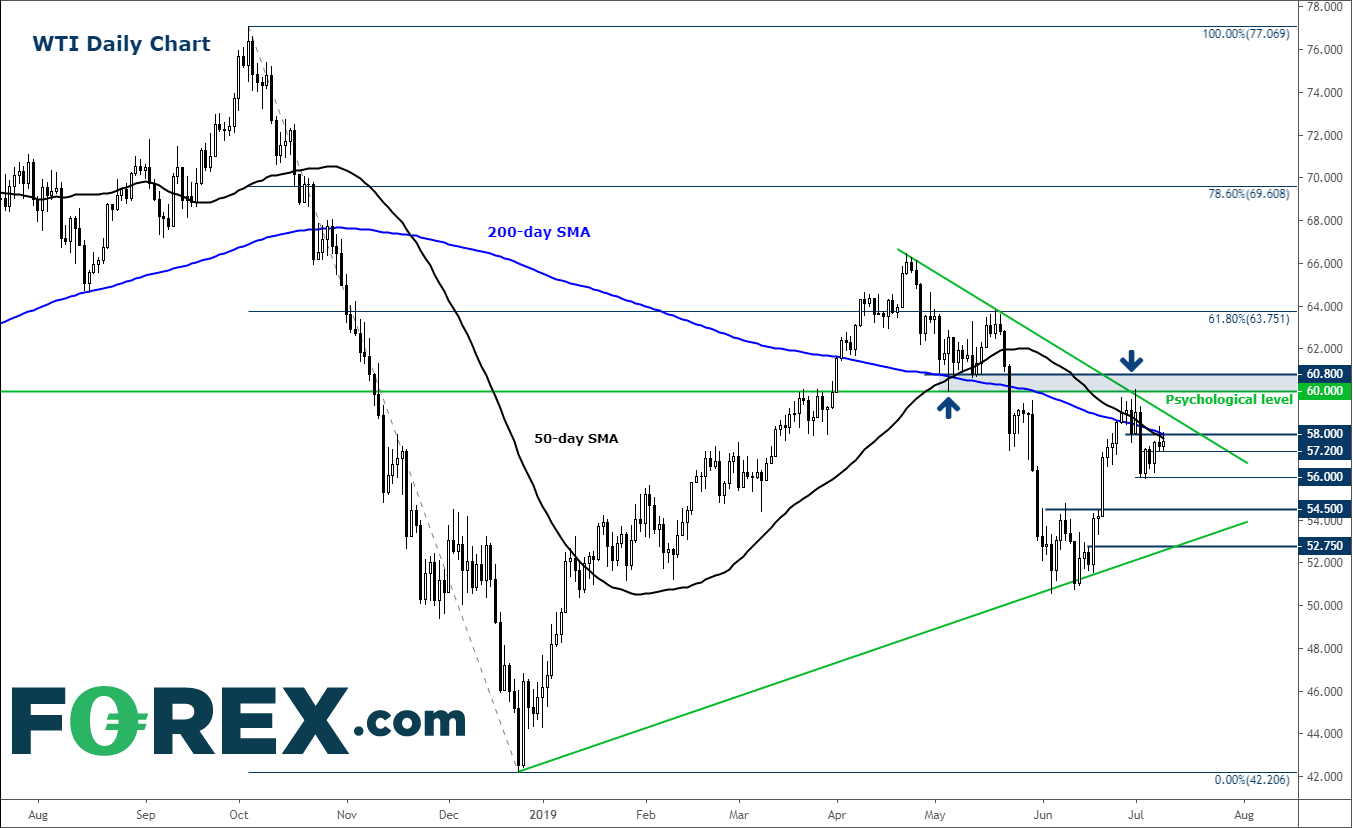
Ahead of the publication of the latest inventories data, WTI crude oil continues to trade inside narrowing ranges, with the upside capped by a bearish trend line and the downside supported by a bullish trend line. Within these converging trend lines, oil prices have hit a key resistance level around $58.00, where an old support meets both the 50- and 200-day moving averages. Given the negative slope of these moving averages, and proximity of WTI from the resistance trend line, we would not be surprised if prices turned lower from here. However, for the bears to step in, we need short-term support at $57.20 to give way first. If so, WTI could fall and take out liquidity below the most recent low at $56.00 next. Key supports thereafter come in at $54.50, which was previously resistance, followed by $52.75 – the base of the recent breakout, where the bullish trend line also comes into play. Meanwhile, if the bulls reclaim $58.00 then a subsequent rally towards the next resistance circa $60.80 would become likely.
Source: Trading View and FOREX.com.
Related tags:




Open an account in minutes
Experience award-winning platforms with fast and secure execution.
Economic calendar
Web Trader platform
Our sophisticated web-based platform is packed with features.
Related articles

Nasdaq 100 Forecast: NDX rises ahead of Nvidia earnings
U.S. stocks are pointing to a mixed open, with Nasdaq futures inching higher as recently battered tech stocks steady ahead of Nvidia's earnings after the close and Anthropic's highly anticipated IPO tomorrow. Investors are also digesting slower retail sales growth, while Fed speakers will be watched closely.

Nasdaq 100 Forecast: NDX falls ahead of Nvidia’s earnings & Anthropic’s debut this week
U.S. stocks are heading for a weaker open amid a challenging macro backdrop and with AI-linked stocks once again under pressure ahead of Nvidia's results later this week. Attention is also turning to Anthropic's highly anticipated IPO.

Crude Oil Weekly Outlook: Geopolitics vs Oversupply Risks
Crude Oil Weekly Outlook: The IEA has flagged the risk of an oil supply surplus since the Iran war began. Yet WTI and Brent have held onto bullish rebounds from key support near 84 and 89, respectively, as geopolitical risks persist.

StoneX Financial Ltd (trading as "FOREX.com") is an execution-only service provider. This material, whether or not it states any opinions, is for general information purposes only and it does not take into account your personal circumstances or objectives. This material has been prepared using the thoughts and opinions of the author and these may change. However, FOREX.com does not plan to provide further updates to any material once published and it is not under any obligation to keep this material up to date.
This material is short term in nature and may only relate to facts and circumstances existing at a specific time or day. Nothing in this material is (or should be considered to be) financial, investment, legal, tax or other advice and no reliance should be placed on it. No opinion given in this material constitutes a recommendation by FOREX.com or the author that any particular investment, security, transaction or investment strategy is suitable for any specific person.
The material has not been prepared in accordance with legal requirements designed to promote the independence of investment research. Although FOREX.com is not specifically prevented from dealing before providing this material, FOREX.com does not seek to take advantage of the material prior to its dissemination. This material is not intended for distribution to, or use by, any person in any country or jurisdiction where such distribution or use would be contrary to local law or regulation. For further details see our full non-independent research disclaimer and quarterly summary.