- AUD/USD coils beneath 0.7000 ahead of US CPI
- Five-session correlation with US two-year yields reaches +0.81
- Just 6.1bp of tightening priced for October Fed meeting
- Historical CPI-day bullish bias fades in post-pandemic inflation environment
AUD/USD is coiling in a compressed structure ahead of tonight's US CPI report, with the underlying details providing a clear catalyst for a potential breakout.
The Aussie's strengthening relationship with US front-end yields over the past week underlines the importance of tonight's inflation report, not only for the currency but also for broader commodity markets, which have been moving closely in line with AUD/USD.
US inflation and Fed pricing in focus
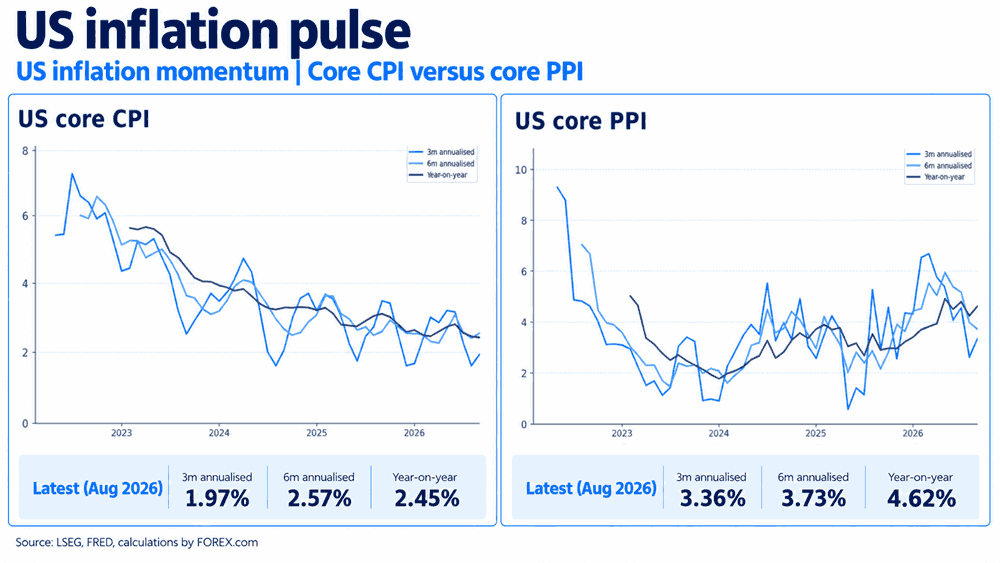
Core US CPI is expected to increase 0.2% in September, down from 0.3% in August, a relatively subdued outcome given the inflationary pressures we've seen building elsewhere, particularly in energy and producer prices.
As the graphic below shows, the recent moderation in core consumer inflation contrasts with far stronger price pressures further upstream, raising questions over just how long this trend can last before hitting the consumer level.
Source: LSEG, FRED
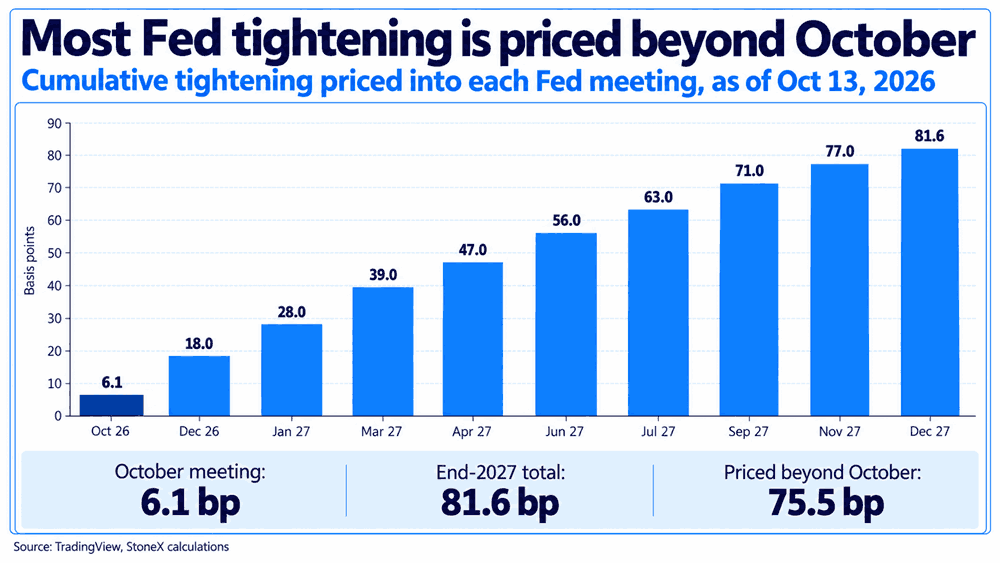
For traders, the question around the latest CPI report is whether it will be hot enough to meaningfully revive expectations for a rate hike from the Fed later this month, or sufficiently soft to spark a further unwind in hawkish pricing looking out to the end of next year, which has been declining over recent weeks.
Only 6.1 basis points of tightening is priced for the October meeting, while cumulative hikes through the December meeting next year stand at around 82 basis points, down from more than 100 basis points.
Source: TradingView
Given the influence front-end pricing has had on the broader US dollar recently, how these expectations shift could go a long way towards determining how the dollar behaves later Wednesday.
What's driving the Aussie ahead of CPI?
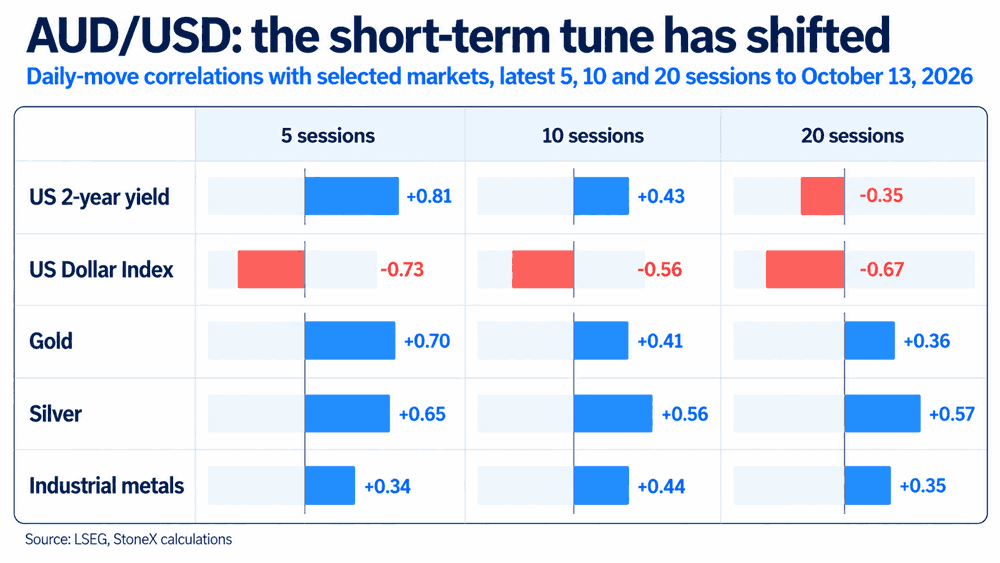
Looking at the relationship between daily movements in AUD/USD and other major markets, there's been a noticeable shift in what the Aussie has been responding to recently.
Source: LSEG
Over the past five sessions, the correlation between AUD/USD and US two-year Treasury yields has strengthened to +0.81, compared with +0.43 over 10 sessions and -0.35 over 20 sessions.
While five sessions is a small sample, the strengthening relationship heading into CPI is noticeable, suggesting the earlier disconnect may have been driven by temporary factors, including quarter end.
The graphic also shows the Aussie has maintained a consistently strong inverse relationship with daily movements in the US Dollar Index, while moving closely with daily gyrations in precious metals and, to a lesser degree, industrial metals, indicating its standing as a high-beta commodity currency remains firmly in place.
History offers little directional guidance on CPI days
In the interest of completeness, I also decided to look at how the Aussie has performed on US CPI days in the past. And it's obvious from the results that there's been no firm directional steer in recent years.
That wasn't always the case, mind you, with the Aussie rising on nearly 69% of CPI release days between 2016 and 2019, an era of subdued inflationary pressures that may have benefited risk appetite.
But that bullish skew has weakened considerably in the more inflationary environment since the pandemic, with the positive hit rate falling to around 56% since 2023.
With outcomes increasingly resembling a coin toss, traders should be prepared to assess opportunities in both directions depending on how tonight's report prints.
A breakout approaching?
Source: TradingView
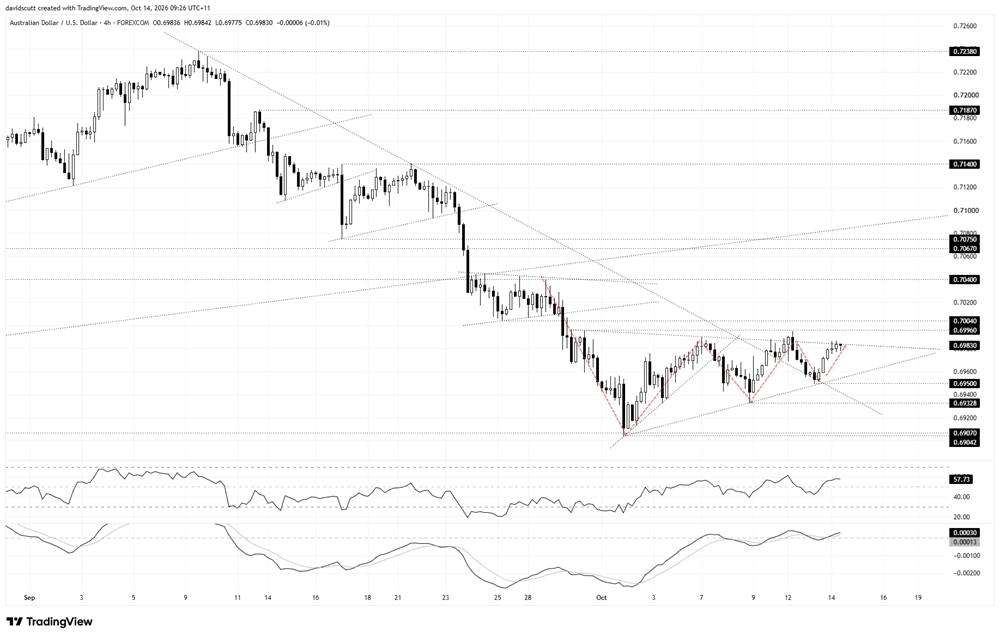
On the four-hourly timeframe, AUD/USD has been trading in a contracting range since bottoming in early October, with a series of higher lows meeting resistance just beneath 0.7000.
While the structure has characteristics of both a symmetrical and ascending triangle, what's clear is that there's something akin to a resistance zone immediately overhead. The price is now testing a shallow downtrend dating back to late September, although a previous break above this level failed at 0.6996, where rallies also stalled on several occasions in late September.
That makes the area between the downtrend resistance and 0.7004, the low set on September 25, the zone to watch immediately overhead. A sustained break above the top could open the door to 0.7040, a level that has acted as both support and resistance in the past and where the 100 and 200-day moving averages are on the cusp of intersecting.
Above that, 0.7057 and 0.7067 are the next levels of note.
If the Aussie were to reverse lower yet again, 0.6950 and 0.6938 are the initial levels to watch, followed by a support zone between 0.6907 and 0.69042, where earlier breakdown attempts stalled.
As for momentum, RSI (14) has moved back above the neutral 50 level, although at around 57 it hardly suggests upside pressure is building rapidly. MACD has confirmed the signal by staging a bullish crossover, reinforcing the modest improvement in upside momentum.
Combined, the oscillators marginally favour long strategies over short, although the message is far from definitive, particularly ahead of tonight's inflation report, which screens as a binary risk event.