Recent trading sessions have not been particularly supportive of Bitcoin's short-term momentum. Instead, the market has begun to display an increasingly evident neutral dynamic, with price action struggling to establish a clear direction. This can be seen in the performance of the last two trading sessions, where price fluctuations have barely managed to exceed 1.0%, highlighting a loss of momentum and an increasingly visible lack of directional conviction.
Part of this behavior appears to be linked to weaker demand activity in an environment where bond market yields remain elevated and continue competing for investor attention. As long as this dynamic persists and a more meaningful recovery in market activity fails to emerge, neutrality could remain a defining characteristic of Bitcoin price action in the sessions ahead.

Is Demand Failing to Recover?
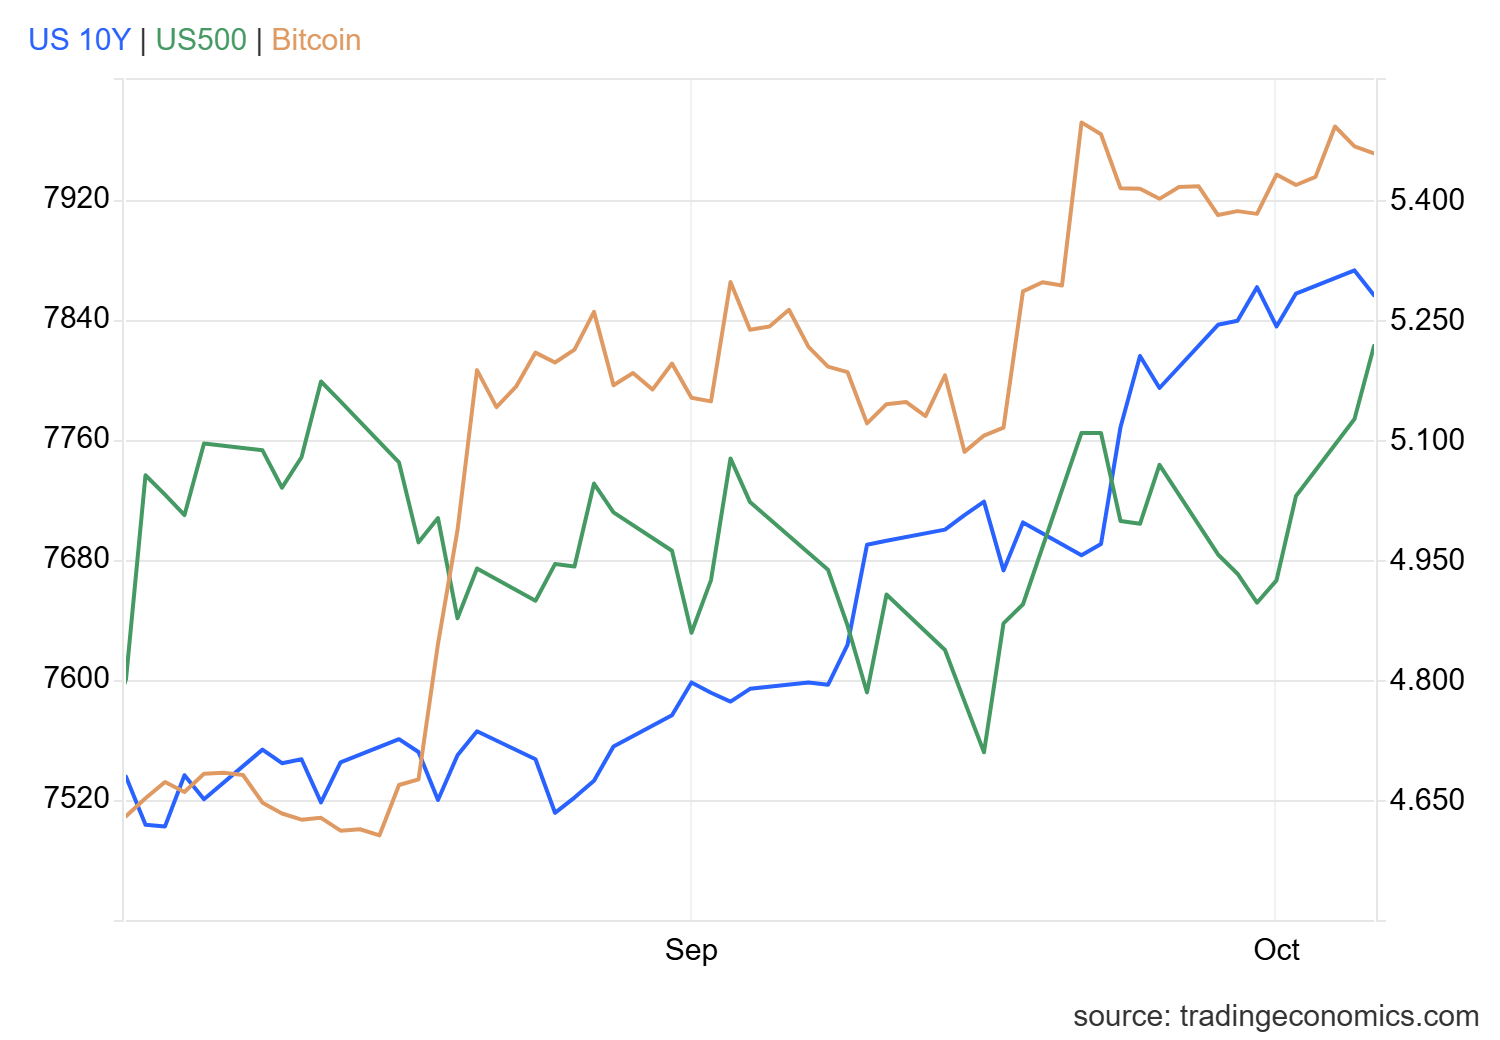
Bitcoin's ability to attract capital has become increasingly constrained in the short term as other markets continue to display stronger demand and remain attractive alternatives for investors.
This can be observed first in the U.S. bond market, where 10-year Treasury yields continue to trade near the 5.3% area, highlighting the strong appeal of fixed-income assets. At the same time, part of the U.S. equity market continues to show a favorable performance. Indices such as the US 500 remain near important highs, supported by confidence surrounding the artificial intelligence industry and its potential impact on some of the market's largest companies.
Meanwhile, Bitcoin continues to trade within a much flatter environment. This lack of a consistent recovery contrasts with the behavior seen in both safe-haven assets and some risk-oriented markets, suggesting that part of the market's attention and capital flows remain concentrated elsewhere.
Source: TradingEconomics
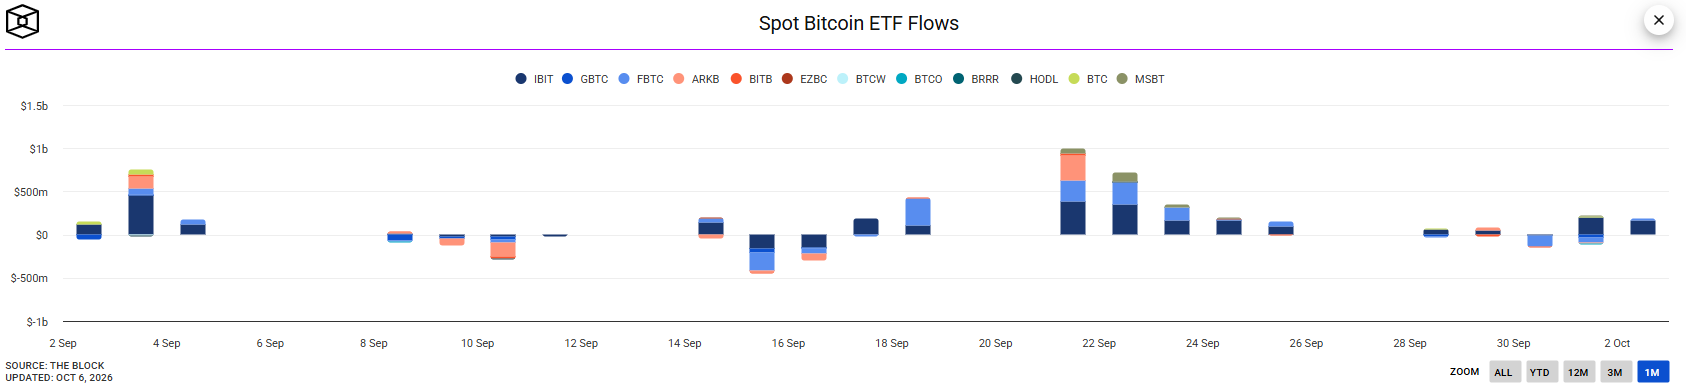
This loss of momentum can also be seen in institutional demand. By the end of last week, net inflows into Bitcoin ETFs reached only $189 million, a figure considerably lower than the inflows of more than $700 million recorded during previous weeks.
This decline in flows can be interpreted as a sign of weaker institutional activity and reinforces the idea that demand has not yet managed to recover in a meaningful way.
Source: theblock
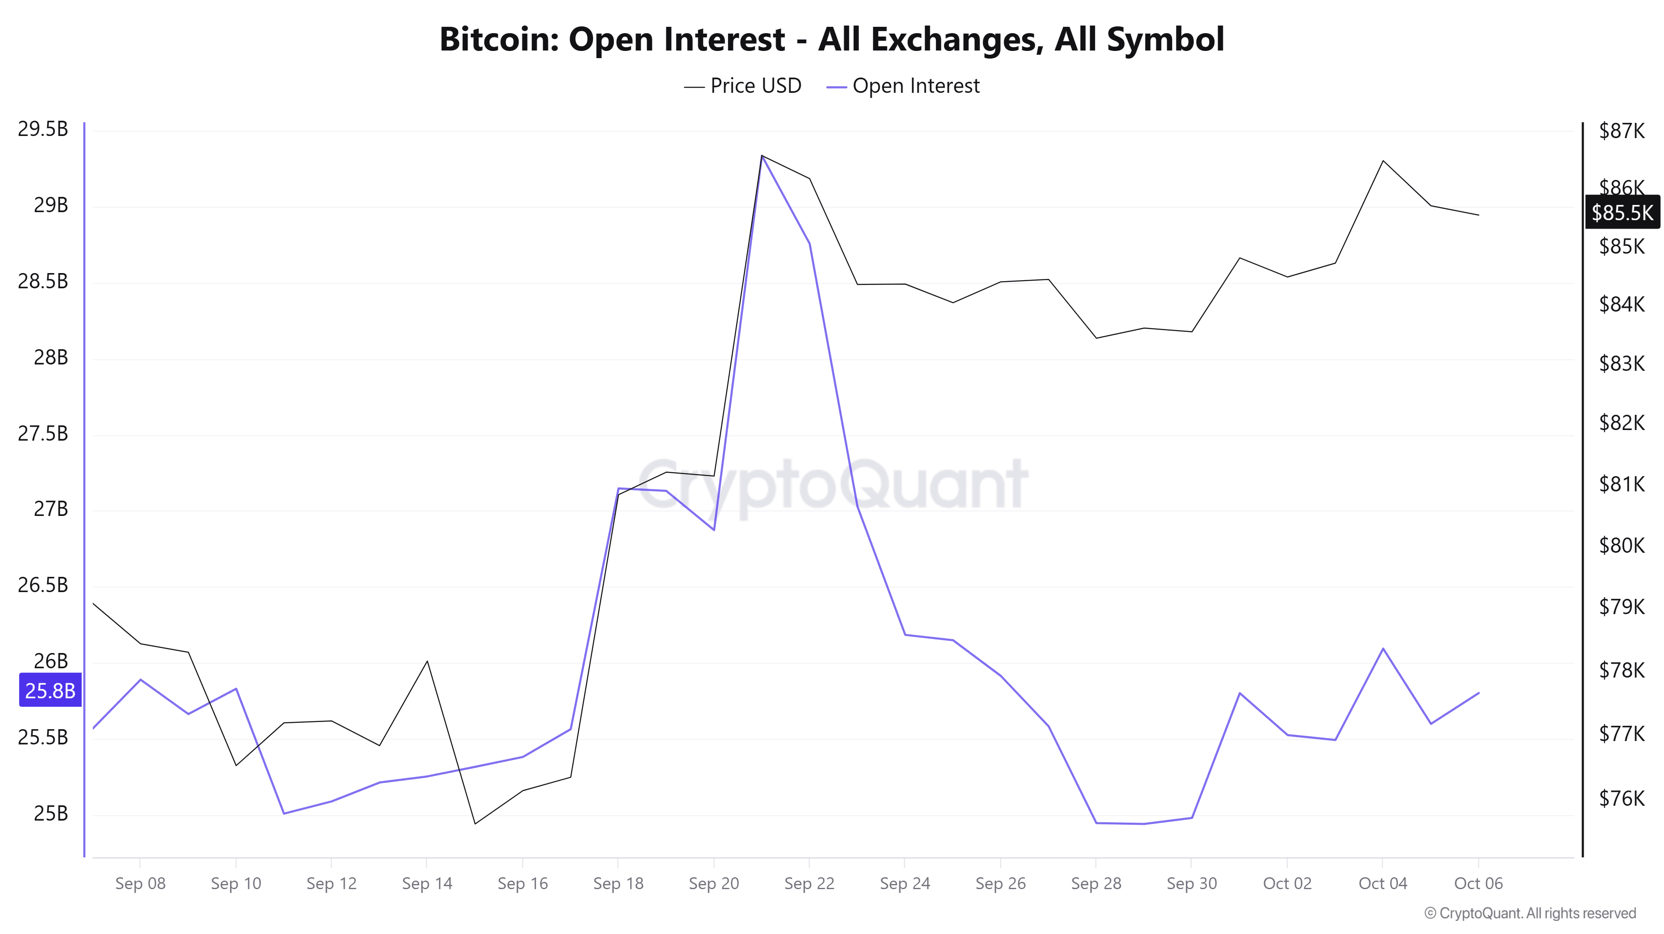
A similar picture can be observed in Open Interest, which measures the total number of open long and short positions across the market. Currently, the indicator remains relatively flat around $25.8 billion, a dynamic that closely aligns with Bitcoin's recent lack of direction.
The combination of stable Open Interest and limited price progress is often associated with the absence of significant new capital entering the market and reinforces the cautious tone that has become increasingly evident in recent weeks.
Source: Cryptoquant
Taking all of this into account, Bitcoin market activity continues to develop within a broader slowdown. The absence of new demand flows, combined with the attractiveness of alternative markets, continues to limit the cryptocurrency's ability to regain momentum in the short term. Unless this situation changes meaningfully, the current lack of momentum and neutral price behavior could remain dominant themes in BTC price action.
Bitcoin Technical Forecast
Source: StoneX, Tradingview
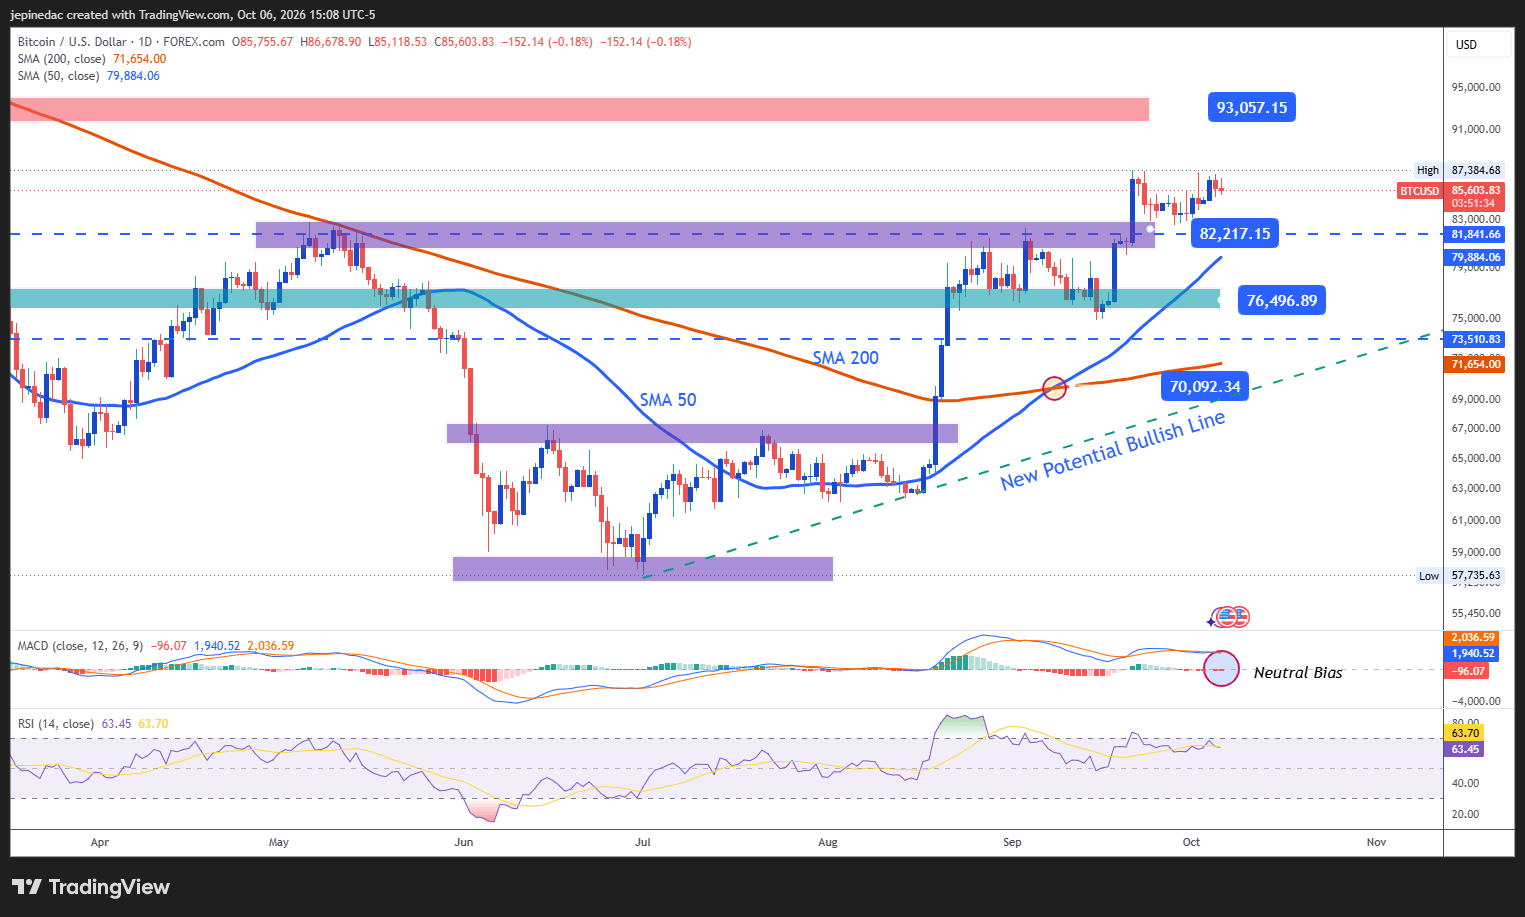
- The bullish trendline is losing momentum in the short term: Over recent months, Bitcoin has maintained a consistent sequence of higher highs and higher lows, allowing the development of a relevant bullish trendline on the daily chart. However, the recent lack of direction is beginning to reflect a more evident loss of buying momentum. If a clearer directional move fails to return in the sessions ahead, the current uptrend could enter a broader consolidation phase and potentially give way to a more established trading range.
- MACD: The MACD histogram continues to develop around the 0 neutral line, reflecting an increasingly balanced dynamic in short-term moving-average momentum. This reading continues to support the idea that a phase of indecision is gradually becoming more relevant within the market.
- RSI: A similar picture can be observed in the RSI, whose line has begun to flatten noticeably over recent sessions. This behavior reflects the loss of strength in the buying momentum observed weeks ago and, unless the indicator manages to regain a clearer direction, it could continue supporting a growing phase of indecision in the short term.
Key Levels:
- 93,000 USD – Major Resistance: A high observed in December 2025 that remains the chart's most important upside barrier. It is also located above the key psychological level of $90,000. Price action that approaches this area consistently could restore relevance to the bullish bias and favor a renewed acceleration of the uptrend in the weeks ahead.
- 82,000 USD – Near-Term Barrier: An important equilibrium and retracement zone observed over recent weeks. This area could remain the main reference to monitor in the event of further short-term corrective declines around Bitcoin.
- 76,500 USD – Key Support: An important support area that coincides with relevant lows observed weeks ago and continues to act as a key reference within the current structure. Moves toward this zone could begin to reflect a more evident loss of direction, place the current bullish trendline at risk and open the door to a broader consolidation phase over the coming weeks.
Written by Julian Pineda, CFA, CMT – Market Analyst
Follow him on: @julianpineda25