



AMD (NASDAQ: AMD) — Feb 3rd Earnings Brief
AMD delivered a sharp rebound in FY2024 driven by accelerating Data Center strength, expanding margins, and rising AI accelerator demand. With consensus expecting a major EPS ramp into 2026, execution in EPYC, Instinct and hyperscaler adoption remains key. While profitability still lags NVIDIA, AMD’s mix shift, net‑cash balance sheet and strong technical setup keep the long‑term trend bullish.
Share this:

AMD (NASDAQ: AMD) — Feb 3rd Earnings Brief (GAAP + Non‑GAAP)
Period covered: FY2022–FY2024 actuals + FY2025–FY2026 expectations (consensus)
Closest peers selected: NVIDIA (NVDA), Intel (INTC), Qualcomm (QCOM) (adjacent compute silicon + overlapping end-markets) 1
Investment view (rating-style)
Rating: Base-to-Bull (positive bias) — AMD’s 3-year fundamental setup is increasingly defined by (1) accelerating Data Center mix (EPYC + Instinct), (2) improving consolidated margin profile vs. FY2023 trough, and (3) a forward EPS ramp that is consensus-driven and therefore sensitive to execution and AI accelerator trajectory. The principal counterweights are (a) still-lower profitability vs. NVDA, (b) competitive intensity vs. NVDA in AI accelerators and vs. INTC in x86 CPUs, and (c) valuation that embeds material earnings acceleration. 2
1) Earnings and revenue growth: what the last 3 years say
Revenue trend (FY2022–FY2024)
AMD’s revenue declined in FY2023 and re-accelerated in FY2024: $23.6B (FY2022) → $22.7B (FY2023) → $25.8B (FY2024). 3
- FY2023 reflected a mixed demand backdrop where growth in Data Center and Embedded was offset by weaker Client and Gaming. 4
- FY2024 rebounded to a record $25.8B, driven by a sharp Data Center ramp (including Instinct AI accelerators) and improved Client momentum, while Gaming remained a notable drag. 5
3-year context: From FY2022 to FY2024, revenue increased modestly in aggregate (despite the FY2023 dip), implying AMD’s growth quality increasingly depends on mix shift toward Data Center rather than broad-based cyclical uplift. 6
EPS trend: GAAP vs. Non‑GAAP divergence
AMD’s reported profitability shows the classic “semis + acquisition accounting” split between GAAP and non‑GAAP:
FY2022 → FY2023 → FY2024
- GAAP diluted EPS: $0.84 → $0.53 → $1.00 7
- Non‑GAAP diluted EPS: $3.50 → $2.65 → $3.31 8
The FY2023 step-down in both GAAP and non‑GAAP EPS underscores a margin/volume reset in Client + Gaming and ongoing amortization and stock-based compensation effects that pressure GAAP more than non‑GAAP. 9
2) Profitability, margins, and operating leverage
Gross margin and operating margin
AMD’s consolidated margins improved markedly in FY2024:
- FY2024 GAAP gross margin: 49%; Non‑GAAP gross margin: 53% 10
- FY2023 GAAP gross margin: 46%; Non‑GAAP gross margin: 50% 10
Operating profitability also expanded:
- FY2024 GAAP operating income: $1.9B (vs. $0.4B in FY2023) and Non‑GAAP operating income: $6.1B (vs. $4.9B). 11
Interpretation: The FY2024 margin lift is consistent with a higher Data Center mix and a better Client environment, partially offset by weaker Gaming and continued investment intensity (R&D + go-to-market) required to compete in AI and server. 12
Returns and efficiency (snapshot)
As a market snapshot, AMD’s published efficiency ratios show mid-single-digit returns (reflecting both the accounting base and still-developing margin structure vs. the industry’s top quartile): ROE ~5% and ROIC ~5% (as of late Jan 2026 data providers).
That’s well below NVDA’s peak-cycle return profile, highlighting why AMD’s equity story remains primarily growth + mix + scale rather than “already-maximized profitability.” 13
3) Cash flow, balance sheet strength, and capital allocation
AMD’s balance sheet is conservatively positioned for a large-cap fabless semiconductor designer:
- Cash & short-term investments (FY2024): about $5.1B (cash + short-term investments), with total debt ~ $2.2B, indicating net cash positioning. 14
- Liquidity ratios from market data show a current ratio ~2.3 and low leverage (Debt/Equity ~0.06), consistent with financial flexibility to fund R&D and capacity commitments via partners. 15
Capital return: AMD’s equity story is still dominated by reinvestment (AI software ecosystem, GPU roadmap, platform partnerships), so buybacks/dividends are secondary relative to peers like QCOM (more mature cash return profile). 16
4) Forward growth expectations (EPS + Revenue): what the market is pricing
Consensus estimates (provider aggregation) imply a step-up in both revenue scale and EPS power:
- FY2025E: Revenue ~$34.1B, EPS ~$3.98 17
- FY2026E: Revenue ~$45.3B, EPS ~$6.61 17
Management commentary around FY2025 pointed to “strong double-digit percentage revenue and EPS growth”, consistent with a view that Data Center and AI remain the principal growth engine. 18
Key drivers embedded in expectations
- Data Center ramp (EPYC + Instinct): FY2024 Data Center revenue was reported as $12.6B (+94% YoY) and included >$5B Instinct accelerator revenue, setting a higher base for FY2025–FY2026. 19
- Client normalization after the PC downturn, supporting incremental operating leverage as volumes normalize. 20
- Embedded stabilizing (post digestion), although this segment can be lumpier due to industrial cycles.
Sensitivity: The FY2026 EPS ramp (mid‑60% YoY in that estimate set) is execution-sensitive—particularly around accelerator attach, software maturity, and competitive pricing.
5) Peer comparison (industry-relative): growth, margins, and earnings quality
NVIDIA (NVDA) — benchmark for AI accelerator economics
NVDA remains the profitability and scale benchmark in AI compute. Its investor materials show continuing record quarterly revenue and dominance in Data Center; the company’s financial reports highlight extreme Data Center scale and rapid growth through FY2025/FY2026 periods.
Implication for AMD: AMD can grow rapidly from a smaller base, but peer comparison underscores that AMD’s margin and ecosystem moat are still in “build mode” vs. NVDA’s entrenched software + platform advantage. 21
Intel (INTC) — turnaround peer with different margin structure
Intel’s FY2024 results show $53.1B revenue (‑2% YoY) and a large GAAP EPS loss (‑$4.38), reflecting restructuring/impairments and competitive/product transitions.
Implication for AMD: AMD’s cleaner fabless model and strengthening Data Center mix contrast with Intel’s heavy manufacturing/turnaround burden, but Intel’s platform reach and pricing tactics remain a competitive risk in CPUs. 22
Qualcomm (QCOM) — mature cash generator with high EPS quality
Qualcomm’s FY2024 reported $39.0B revenue and GAAP EPS $8.97 (Non‑GAAP $10.22), highlighting higher profitability and cash generation in a more licensing-augmented model.
Implication for AMD: QCOM offers a “quality + shareholder return” profile; AMD offers a “platform share gains + AI-driven growth” profile, typically warranting different valuation frameworks (growth multiple vs. cash yield). 23
6) Valuation & expectations (context, not a target price)
Market data snapshots indicate AMD trades at elevated earnings multiples (high trailing P/E; lower but still rich forward P/E), consistent with the consensus EPS acceleration narrative.
This matters because, relative to peers, AMD’s multiple is less supported by “current margins” (NVDA/QCOM) and more by future operating leverage—i.e., the market is paying for the ramp. 24
Technically
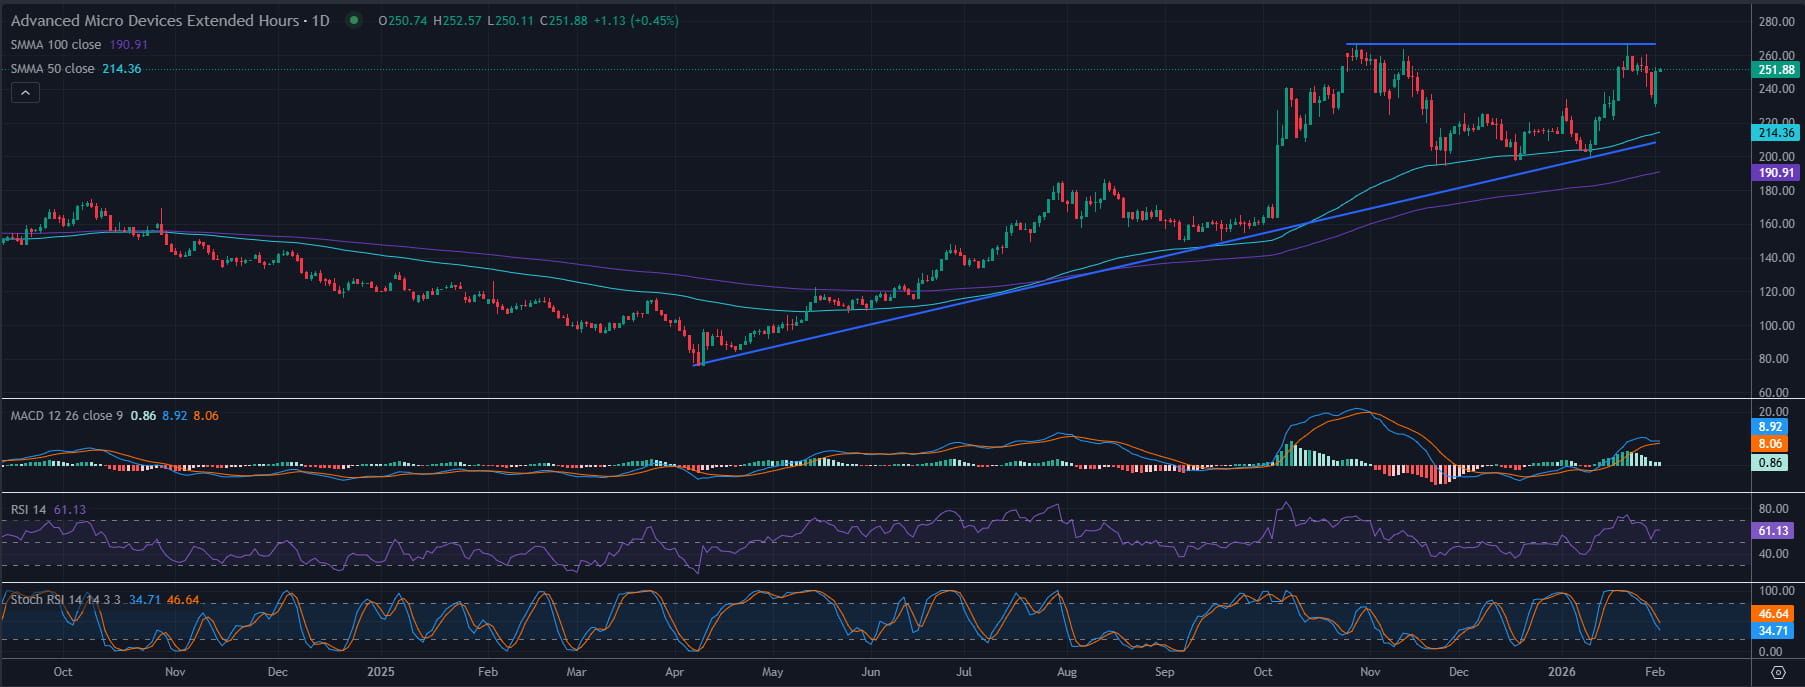
AMD is holding strongly above the key support at 195.50, which marked a major breakout level. The price has bounced from this zone and is now trading near 245, moving back toward the upper boundary of the long-term rising channel. The next major resistance sits around 267, where the channel top and horizontal resistance converge.
Momentum indicators are supportive but not yet overextended. MACD remains positive, Stochastic RSI is turning upward from mid‑levels, and RSI at ~60 leaves room for continuation. As long as AMD stays above 195.50, the broader trend remains bullish, with potential continuation toward 260–267. A weekly close below 195.50 would instead open room toward the lower channel trendline.
Bottom line: 3–5 takeaways to watch
- Data Center is the swing factor: FY2024 Data Center strength (and Instinct contribution) is the foundation for FY2025–FY2026 expectations. 25
- Margins are improving, but the peer gap remains: FY2024 gross margin expansion was encouraging, yet NVDA’s margin structure remains the upper bound. 26
- Consensus implies a steep EPS ramp into FY2026—execution on GPUs, software, and hyperscaler adoption is critical. 27
- Balance sheet looks supportive (net cash / solid liquidity), enabling sustained R&D investment through the cycle. 28
- Competitive risks are real (NVDA in AI, INTC in x86 CPUs), so share gains must come with disciplined pricing to preserve operating leverage. 29
Regards,
Philip Janni Papageorgiou
Sources:
- [ir.amd.com], [intc.com], [qualcomm.com]
- [ir.amd.com], [seekingalpha.com], [stockanalysis.com]
- [ir.amd.com], [ir.amd.com]
- [ir.amd.com]
- [ir.amd.com], [techpowerup.com]
- [ir.amd.com], [ir.amd.com]
- [ir.amd.com], [ir.amd.com]
- [ir.amd.com], [ir.amd.com]
- [ir.amd.com]
- [ir.amd.com]
- [ir.amd.com], [ir.amd.com]
- [ir.amd.com], [techpowerup.com]
- [stockanalysis.com] [investor.nvidia.com], [financecharts.com]
- [csimarket.com], [finance.yahoo.com]
- [stockanalysis.com]
- [qualcomm.com], [ir.amd.com]
- [seekingalpha.com]
- [cnbc.com], [ir.amd.com]
- [techpowerup.com], [ir.amd.com]
- [techpowerup.com], [ir.amd.com]
- [seekingalpha.com], [sec.gov]
- [intc.com], [download.intel.com] [intc.com], [ir.amd.com]
- [qualcomm.com], [sec.gov] [qualcomm.com], [stockanalysis.com]
- [stockanalysis.com], [seekingalpha.com] [stockanalysis.com], [ir.amd.com]
- [ir.amd.com], [techpowerup.com]
- [ir.amd.com], [financecharts.com]
- [seekingalpha.com], [cnbc.com]
- [finance.yahoo.com], [stockanalysis.com]
- [ir.amd.com], [sec.gov]
Related tags:
Latest market news




The complete CFD trading experience
Award-winning platforms, competitive spreads, low commissions and dedicated support.
We live and breathe the markets and are dedicated to helping traders realise their ambitions as we continue to set the industry bar.
Economic calendar
Web Trader platform
Our sophisticated web-based platform is packed with features.
Related articles
Swiss Franc Forecast: USD/CHF Seven-Week Rally Reverses From Yearly Highs 10 16 2026
A sharp rejection from fresh highs has shifted momentum in favor of USD/CHF bears, raising the stakes for a critical support test.
Magnificent Seven Earnings Preview: Is the AI Boom Facing Its Biggest Test Yet?
After a wobble in the broader AI trade, the Magnificent Seven" stocks are reporting earnings in the coming week - see the key themes and Nasdaq 100 levels to watch!

EUR/USD, GBP/USD Price Outlook: Can the Dollar Pullback Fuel a Bullish Rebound?
Could EUR/USD and GBP/USD be confirming a bullish rebound? The DXY’s pullback from the 103 resistance level may support a recovery in both pairs, although confirmation is still needed.

StoneX Europe Ltd may make third party material available on this website which may contain information included but not limited to the conditions of financial markets. The material is for information purposes only and does not contain, and should not be construed as containing, investment advice and/or investment recommendation and/or an investment research and/or an offer of or solicitation for any transactions in financial instruments; any decision to enter into a specific transaction shall be made by the client following an assessment by him/her of their situation.
StoneX Europe Ltd makes no representation or warranty and assumes no liability as to the accuracy or completeness of the information provided, nor any loss arising from any investment based on a recommendation, forecast or other information supplied. You should always seek independent advice as to your suitability to speculate in any related markets and your ability to assume the associated risks, if you are at all unsure. We are not under any obligation to update any such material. Any opinion made may be personal to the author and may not reflect the opinion of StoneX Europe Ltd.