



EUR/USD, GBP/USD Price Outlook: Can the Dollar Pullback Fuel a Bullish Rebound?
Could EUR/USD and GBP/USD be confirming a bullish rebound? The DXY’s pullback from the 103 resistance level may support a recovery in both pairs, although confirmation is still needed.
Share this:

The intermarket setup I’m watching includes:
-
EUR/USD holding above the psychological 1.11 support level, alongside a daily RSI rebound from oversold conditions last seen in 2015. The recovery remains restrained below 1.1260.
-
GBP/USD holding above the 1.3130 support and within the boundaries of a sideways consolidation that has been in place since November 2025.
-
The DXY pulling back from an 8-month resistance and the psychological 103 level after daily RSI reached overbought conditions last seen in 2023.
Together, these signals highlight key confirmation and invalidation levels for potential rebounds across the FX market. The outlook remains sensitive to inflation and energy prices, with US CPI rising to 3.7% in September and crude oil holding in neutral-to-bullish territory above $90.
DXY Outlook: Weekly Time Frame – Log Scale
Source: TradingView
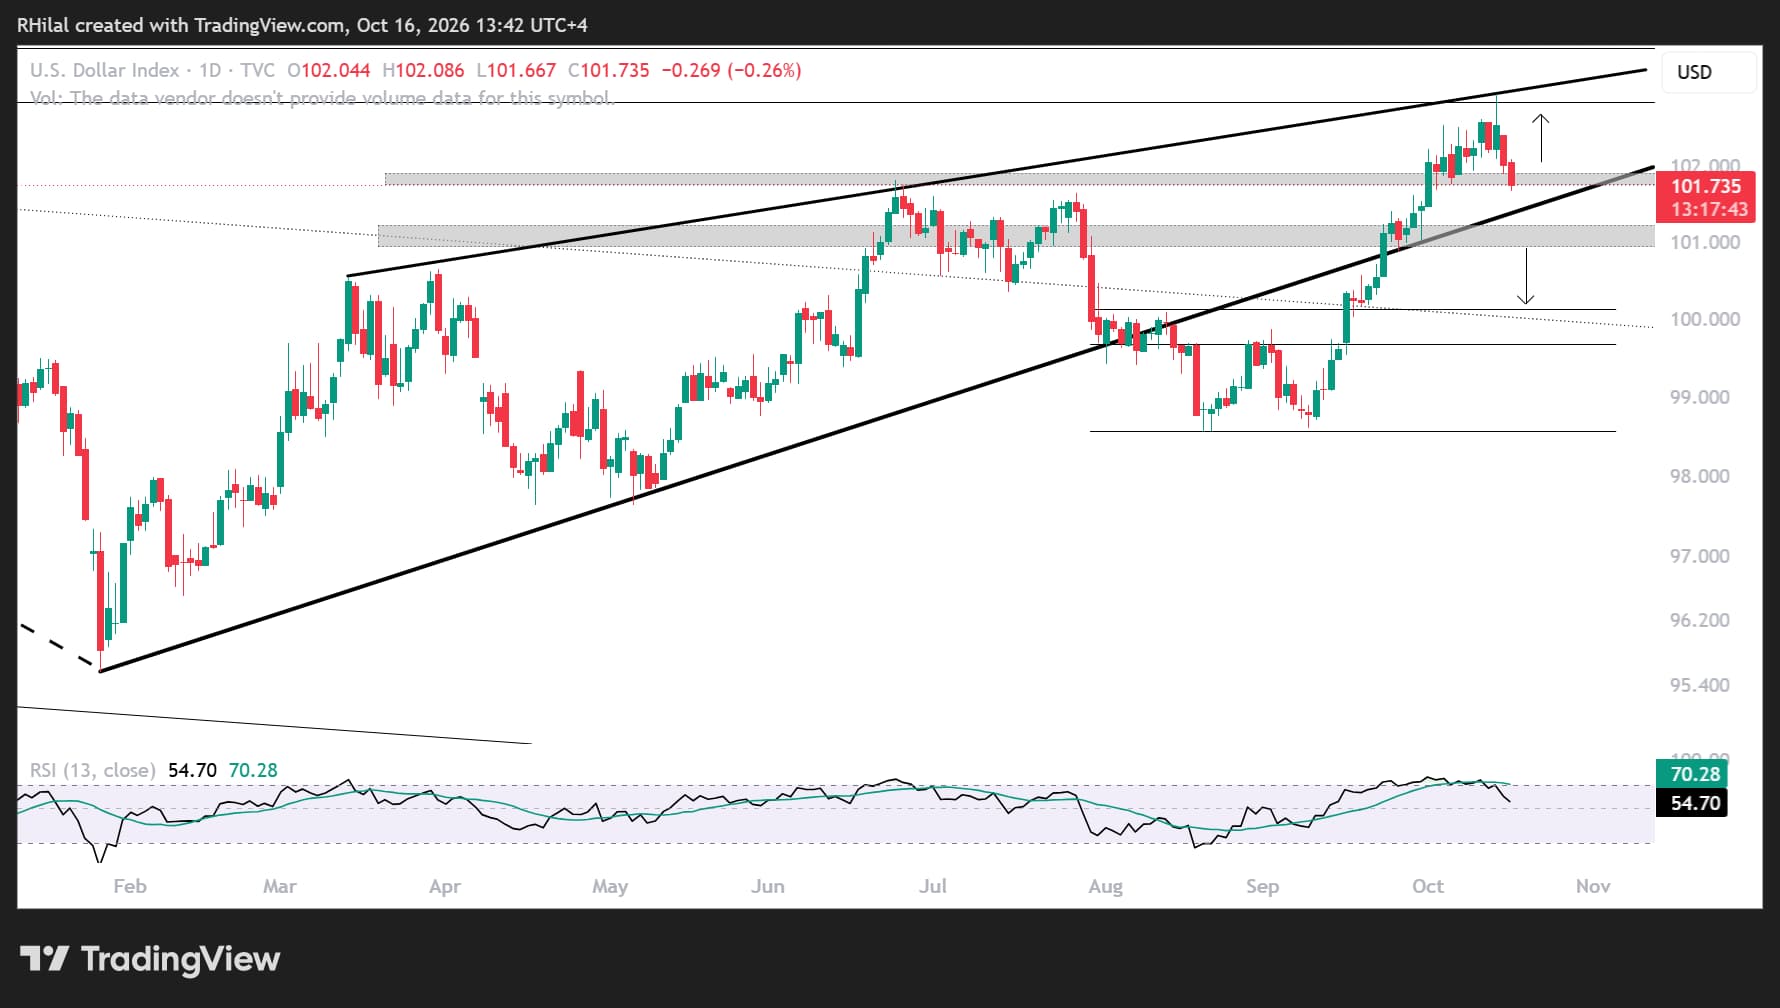
After forming a bearish divergence alongside daily RSI overbought conditions last seen in 2023, the DXY pulled back from the 103 resistance level and resistance connecting higher highs since March 2026. This may confirm potential bullish rebound setups in EUR/USD and GBP/USD.
For the DXY, the key confirmation zone for a sustainable bearish reversal is around 101–100.80. This area aligns with the rising support connecting higher lows from January to August 2026. A break below this support zone would strengthen the case for a neutral-to-bullish outlook across the currency pairs.
For now, the outlook remains neutral, given the risks from crude oil, geopolitics and inflation.
On the upside, a move back above 102.60 and 103 would reassert the bullish bias, with 103.50 and 105 as the next potential levels.
Dollar Pairs in Perspective: USD/CHF, USD/CAD, USD/JPY and DXY
Source: TradingView
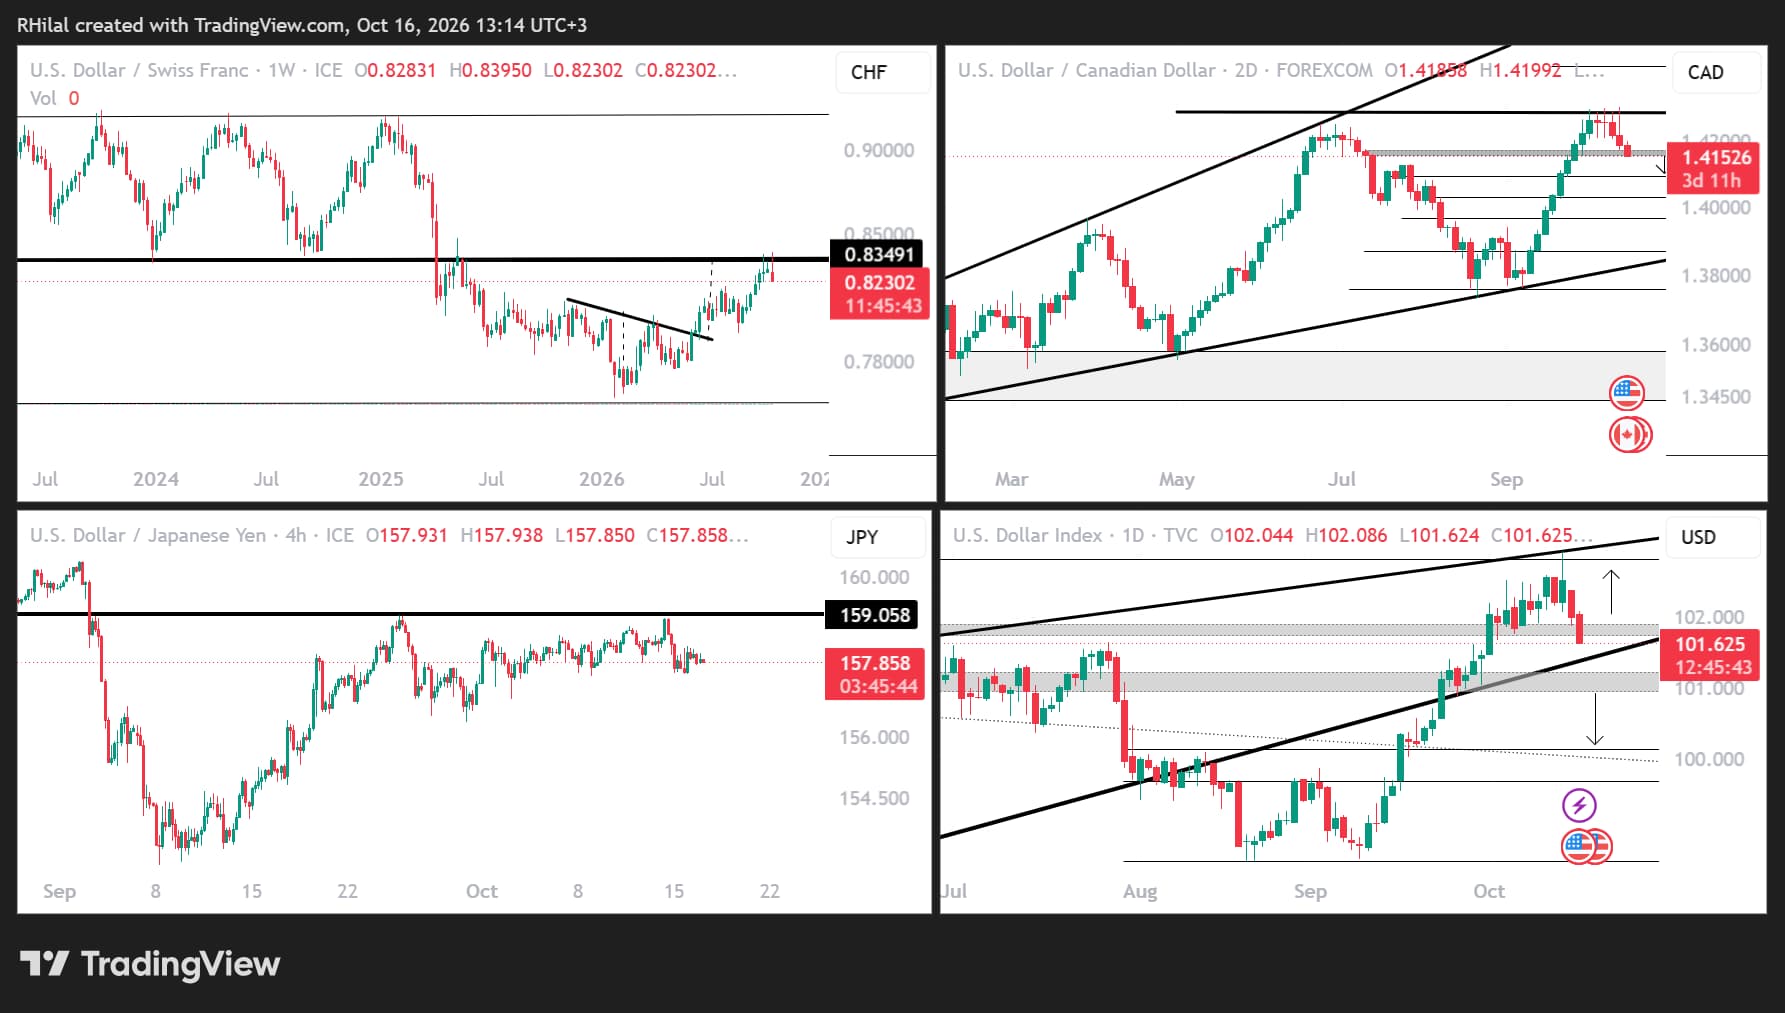
Several short-term reversal setups across the major dollar pairs may help put the DXY’s pullback into perspective:
-
USD/CHF: Price is pulling back from the 2023–2026 support-turned-resistance zone, which also aligns with the target of an inverse head-and-shoulders pattern on the weekly chart, near 0.84.
-
USD/CAD: The pair has consolidated after briefly stretching above its yearly highs below 1.43. A break above the psychological 1.43 level would discard the bearish reversal setup.
-
USD/JPY: The pair is consolidating below 159, raising the risk of a double-top reversal on the four-hour chart.
The respective invalidation levels for these bearish reversal setups are 0.84 for USD/CHF, 1.43 for USD/CAD and 159 for USD/JPY. For the DXY, the key invalidation level is 103.
EUR/USD Outlook: Weekly Time Frame – Log Scale
Source: TradingView
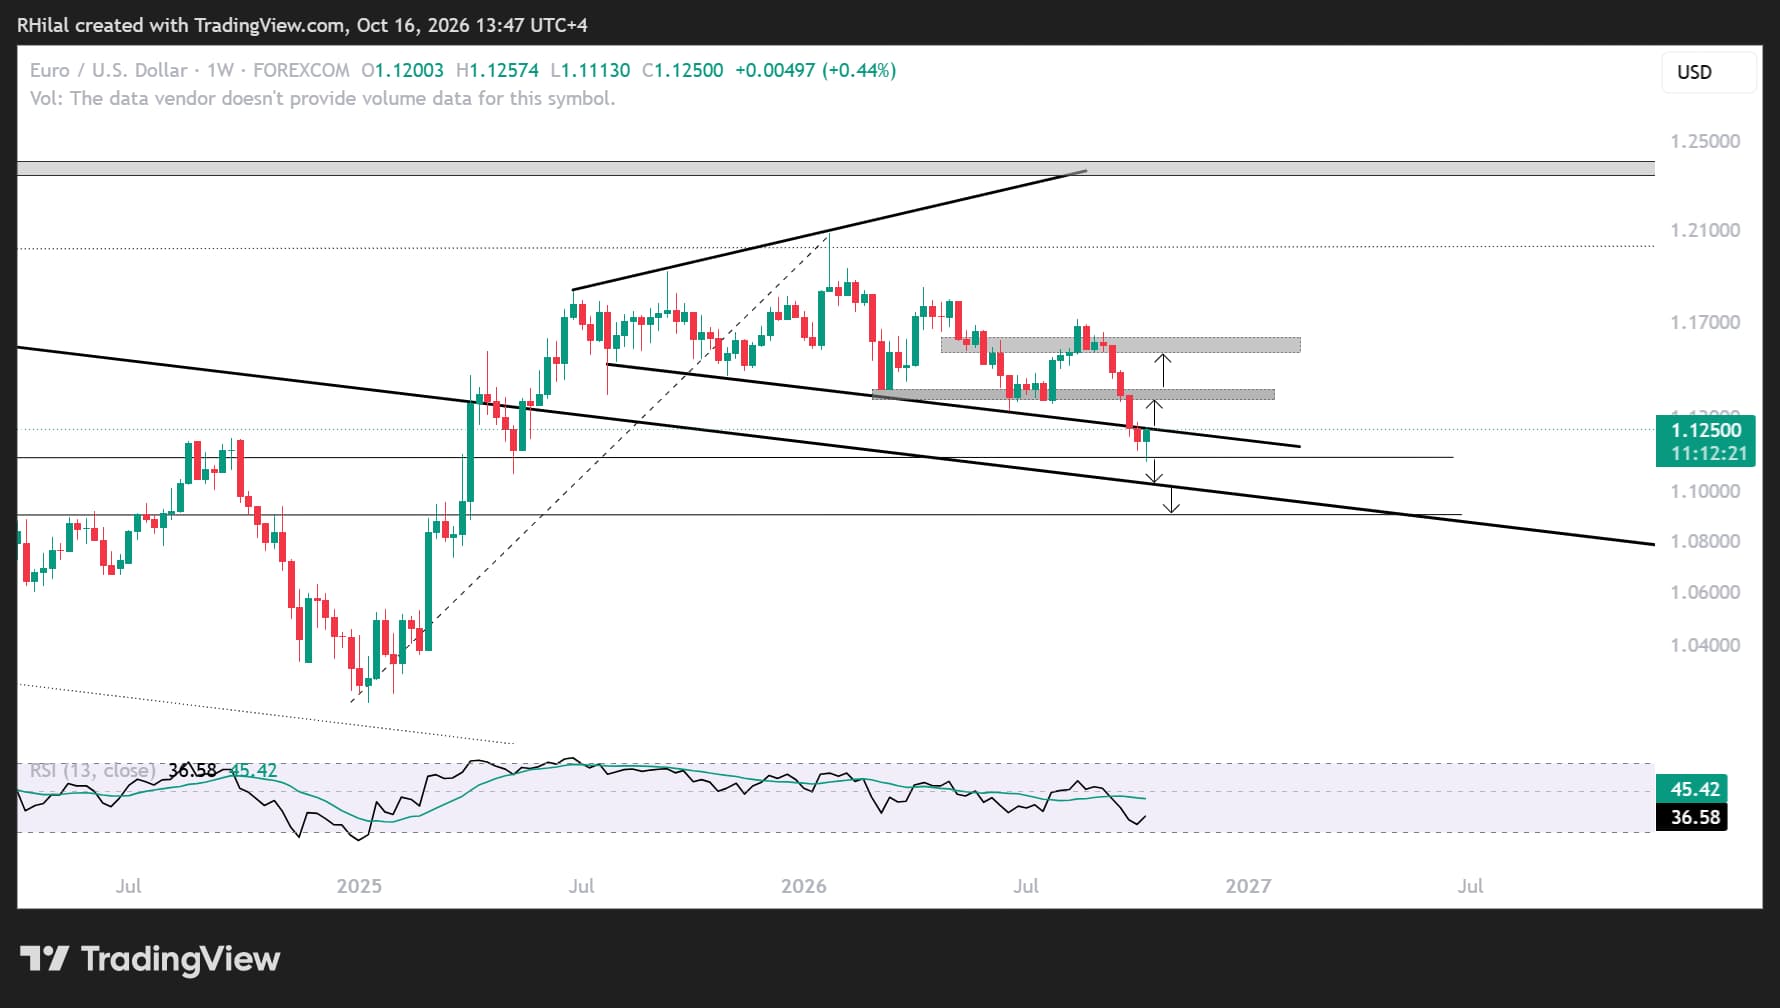
EUR/USD is struggling to recover above the descending trendline near 1.1260, drawn across the lower lows from July 2025 to September 2026. Weekly RSI is rebounding from oversold conditions last seen in 2025, while daily RSI is recovering from oversold conditions last seen in 2015. These signals are lifting the potential for a sustainable bullish reversal, but price confirmation is still needed.
A break back above 1.1260 would bring the 1.1380–1.1400 zone into focus as the next key resistance. Clearing that area would strengthen the case for a move toward the August highs and help sustain the broadening formation that has been developing since July 2025.
On the downside, a break below 1.11—the 50% retracement of the 2022–2026 advance—would expose 1.09. This level represents the 61.8% retracement and aligns with multi-decade resistance-turned-support, making it a potential area to watch for a rebound.
GBP/USD Outlook: Weekly Time Frame – Log Scale
Source: TradingView
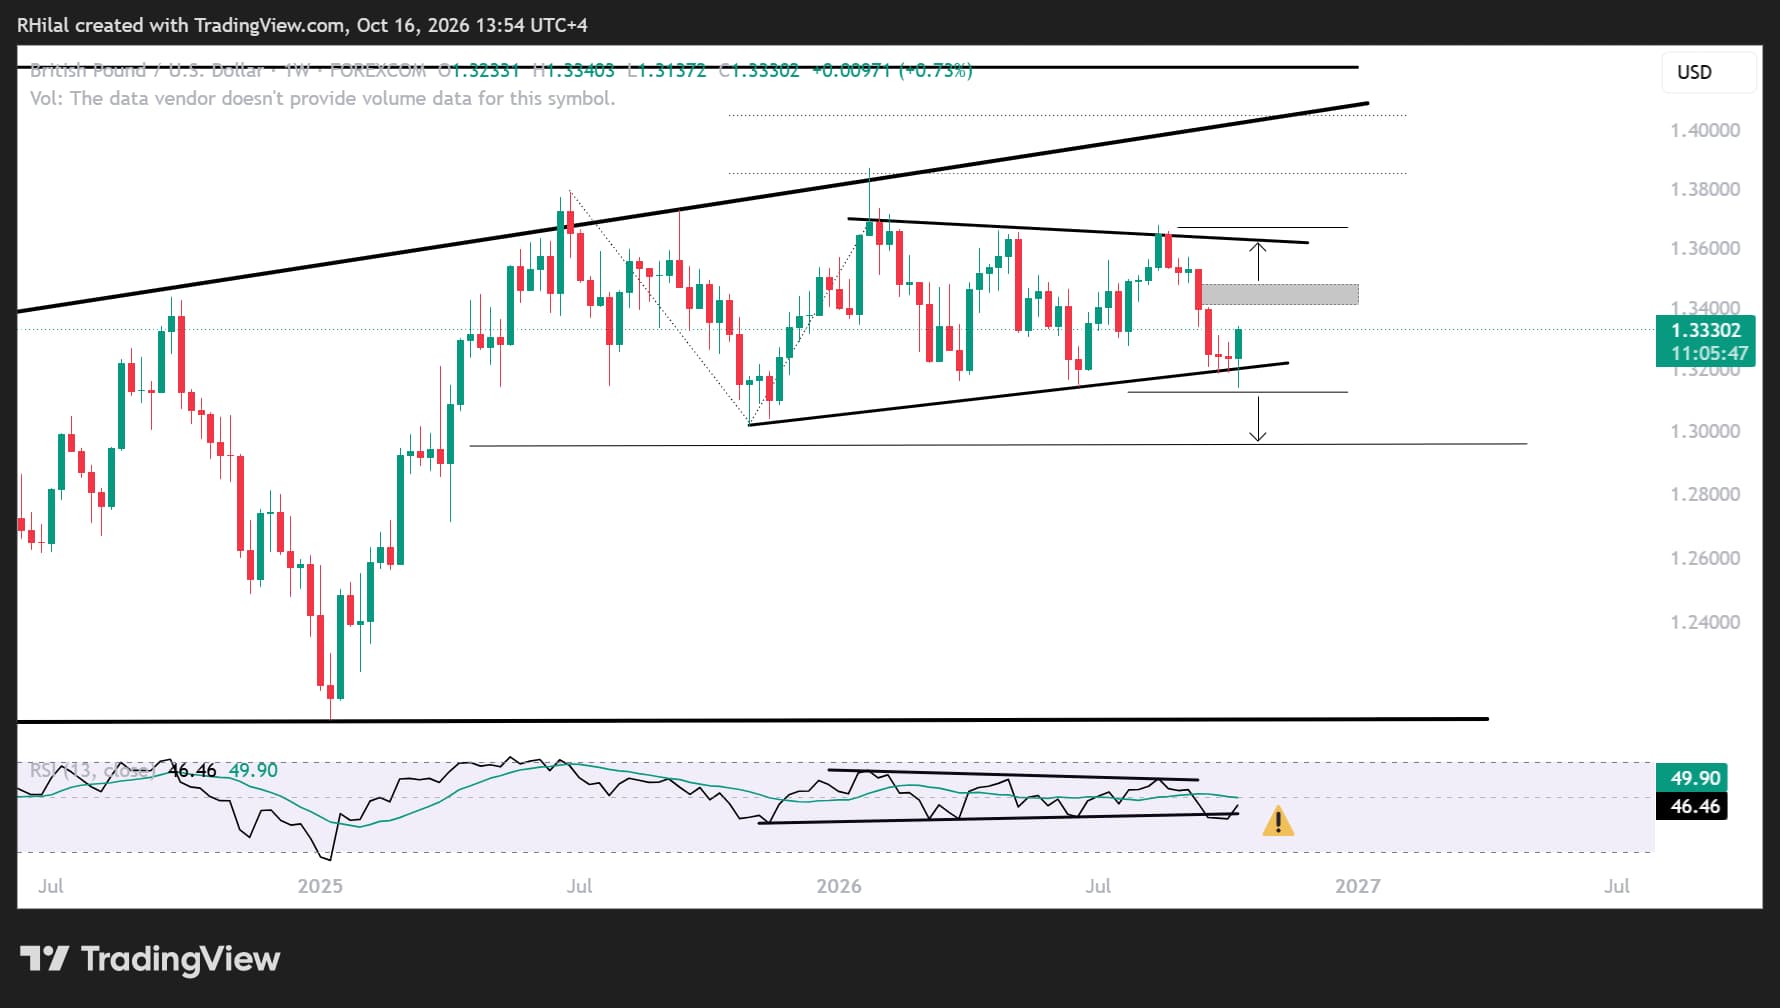
GBP/USD is also showing a neutral-to-bullish setup, with both price action and RSI holding within the boundaries of a sideways consolidation that has been in place since November 2025.
Key support is near 1.3130, aligning with the 78.6% extension of the June 2025–November 2025–January 2026 cycle. A break below this level would expose 1.29 as the next potential support. It would also mark a bearish break below the nearly year-long consolidation, strengthening the pair’s longer-term bearish bias.
As long as GBP/USD holds above 1.3130 and within the consolidation, the neutral-to-bullish outlook remains intact across the charts. The midpoint of the range, around 1.3400–1.3480, is the next potential resistance zone, followed by the upper boundary near 1.36.
Written by Razan Hilal, CMT
Follow on X: @Rh_waves
Related tags:

The complete CFD trading experience
Award-winning platforms, competitive spreads, low commissions and dedicated support.
We live and breathe the markets and are dedicated to helping traders realise their ambitions as we continue to set the industry bar.
Economic calendar
Web Trader platform
Our sophisticated web-based platform is packed with features.
Related articles

EUR/USD, GBP/USD Price Outlook: Can the Dollar Pullback Fuel a Bullish Rebound?
Could EUR/USD and GBP/USD be confirming a bullish rebound? The DXY’s pullback from the 103 resistance level may support a recovery in both pairs, although confirmation is still needed.

DAX Rebounds, but 25,600 Remains the Level to Hold
The DAX continues to recover from last week's sell-off, supported by easing energy concerns and improving short-term momentum. While buyers have regained control of the four-hour trend, the index is now approaching a critical resistance zone between 25,450 and 25,600. A decisive break higher would strengthen the bullish case and open the door toward 25,800, while failure at resistance could quickly revive downside pressure.


ASX 200 Outlook: A Rates Trade Disguised as a Stock Market?
Australian bond futures have exhibited a far stronger relationship with the ASX 200 than Wall Street over recent months. Now both markets are displaying remarkably similar price structures.

StoneX Europe Ltd may make third party material available on this website which may contain information included but not limited to the conditions of financial markets. The material is for information purposes only and does not contain, and should not be construed as containing, investment advice and/or investment recommendation and/or an investment research and/or an offer of or solicitation for any transactions in financial instruments; any decision to enter into a specific transaction shall be made by the client following an assessment by him/her of their situation.
StoneX Europe Ltd makes no representation or warranty and assumes no liability as to the accuracy or completeness of the information provided, nor any loss arising from any investment based on a recommendation, forecast or other information supplied. You should always seek independent advice as to your suitability to speculate in any related markets and your ability to assume the associated risks, if you are at all unsure. We are not under any obligation to update any such material. Any opinion made may be personal to the author and may not reflect the opinion of StoneX Europe Ltd.