


ASX 200 Outlook: A Rates Trade Disguised as a Stock Market?
Australian bond futures have exhibited a far stronger relationship with the ASX 200 than Wall Street over recent months. Now both markets are displaying remarkably similar price structures.
Share this:

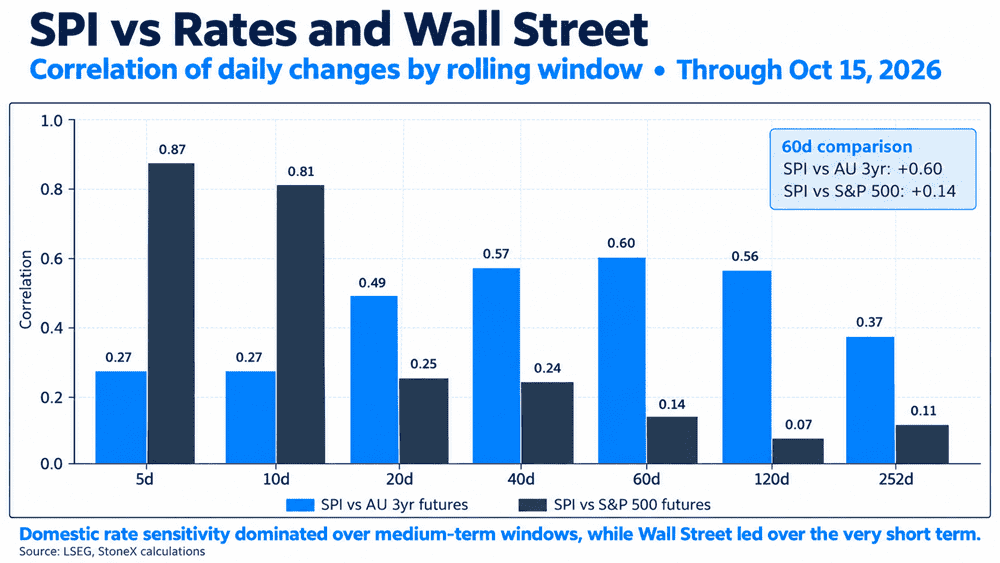
- SPI correlation with Australian three-year futures reaches +0.60 over 60 sessions
- Similar ascending triangle structures emerge across equities and bonds
- ASX 200 nears resistance zone overhead
I don't like speaking ill of my local stock index, but the ASX 200 really doesn't have much going for it. The Australian economy is hardly firing, earnings growth prospects across much of the index are limited, and many of the companies offering stronger growth potential are highly speculative in nature.
That leaves the index looking more like a valuation expansion and contraction mechanism than anything else, heavily influenced by changes in RBA interest rate expectations.
We saw that again yesterday, with the sharp reduction in RBA rate hike probabilities following Australia's weaker-than-expected September employment report helping to propel the index back towards the top of its recent trading range.
And the relationship between SPI 200 futures, Australian three-year government bond futures and S&P 500 futures suggests there's more to this argument than simply having a dig at the local market.
Domestic rates driving the ASX 200?
Source: LSEG
Comparing daily movements across the three contracts reveals a significant difference in their relationships over various timeframes.
Over the past five and 10 sessions, SPI futures have exhibited a much stronger correlation with S&P 500 futures, at +0.87 and +0.81 respectively, compared with just +0.27 against Australian three-year bond futures over both periods.
However, the relationship flips over longer windows.
Over 20 sessions, the correlation between SPI and Australian three-year futures strengthens to +0.49, compared with +0.25 against S&P 500 futures. Over 60 sessions, the difference is even more pronounced, at +0.60 versus just +0.14. The domestic rates relationship remains considerably stronger over 120 sessions, at +0.56 compared with +0.07.
Given bond futures rise when yields fall, the positive relationship suggests lower Australian interest rate expectations have generally coincided with stronger local equities.
At the very least, it suggests the domestic interest rate outlook has been a more important influence than Wall Street over the medium term, consistent with the argument that valuation shifts have been playing a significant role in ASX 200 performance.
Similar price structures in equities and bonds
And it's not just the correlation data where the similarities are evident.
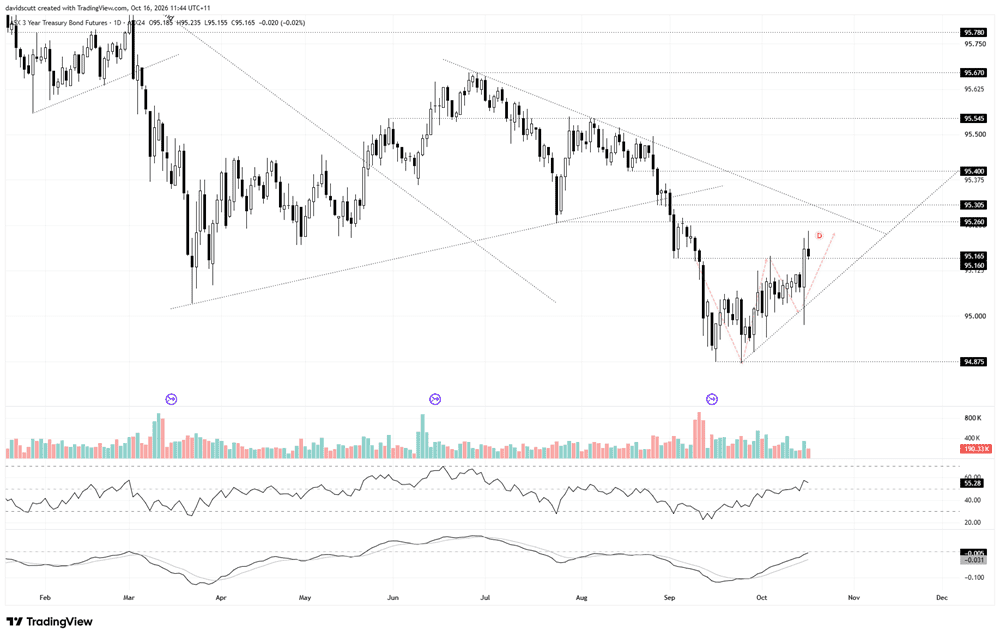
Both SPI 200 and Australian three-year government bond futures have been carving out higher lows against relatively horizontal resistance, creating structures resembling ascending triangles.
Source: TradingView
Three-year government bond futures have already broken above their near-term resistance following Australia's weak September employment report, although follow-through buying has been limited so far.
The ASX 200, meanwhile, remains beneath its own resistance zone, meaning traders should be on alert for a potential breakout if the recent move in bond futures can be sustained.
Breakout approaching?
Source: TradingView
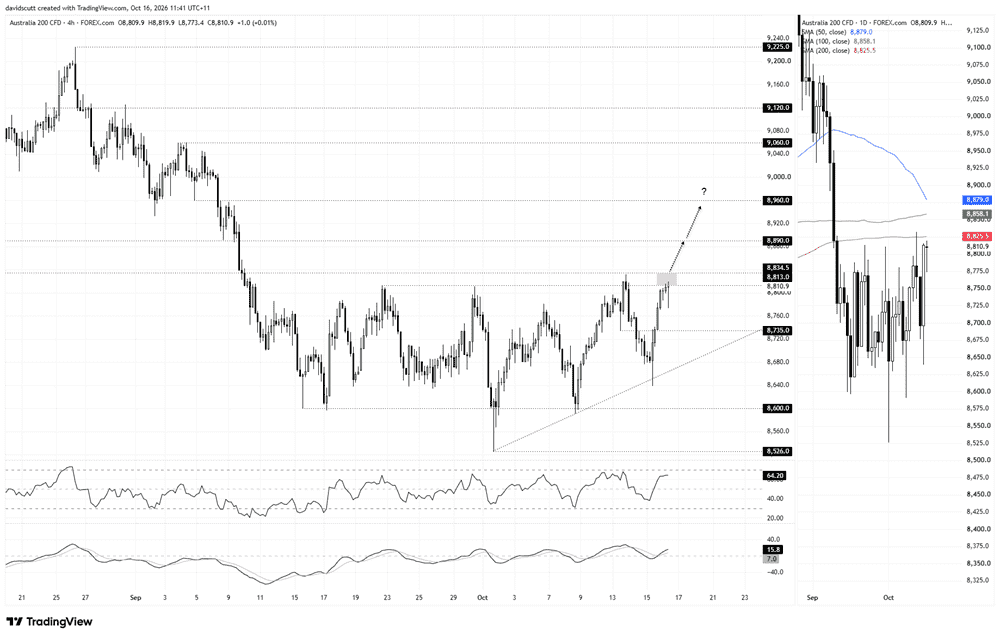
Looking at the four-hourly chart on the left, the price has been coiling into a structure resembling an ascending triangle, with a series of higher lows since October 2 gradually pushing the index towards resistance overhead.
That zone extends from 8,813 through the 200-day moving average at 8,825.5 to 8,834.5, an area buyers have repeatedly struggled to overcome.
A sustained break above 8,834.5, ideally followed by a backtest and bounce from the resistance zone, would provide a potential signal to initiate longs, with a tight stop beneath the zone for protection.
Upside levels to watch include 8,890, 8,960, 9,060 and 9,120. The 100-day moving average at 8,858 and 50-day moving average at 8,878.9 are also worth monitoring, particularly the latter given the price's more pronounced reactions to it historically.
Alternatively, if the price fails to clear resistance, 8,735 is the first level to watch on the downside, followed by the rising uptrend forming the lower boundary of the triangle, located around 8,660 today.
While RSI (14) has yet to set a higher high, it's still early doors with the indicator holding above the neutral 50 level, suggesting upside momentum is rebuilding. That message is reinforced by MACD, which has staged a bullish crossover in positive territory.
On the four-hourly timeframe, the oscillators favour long strategies over shorts in the near term, although price action around the resistance zone remains the more important consideration.


The complete CFD trading experience
Award-winning platforms, competitive spreads, low commissions and dedicated support.
We live and breathe the markets and are dedicated to helping traders realise their ambitions as we continue to set the industry bar.
Economic calendar
Web Trader platform
Our sophisticated web-based platform is packed with features.
Related articles
ASX 200 Outlook: A Rates Trade Disguised as a Stock Market?
Australian bond futures have exhibited a far stronger relationship with the ASX 200 than Wall Street over recent months. Now both markets are displaying remarkably similar price structures.

AUD/USD Bulls Fight Back After Australian Jobs Shock
AUD/USD has been hit by another ugly Australian employment report, sending RBA rate hike expectations sharply lower. Yet the relationships driving the currency have shifted since quarter-end, and improving risk appetite could provide the fuel for a recovery.

Bitcoin Forecast: BTC/USD Bounces off $80K, 9-Month Highs In Play?
Despite apparent fundamental headwinds, Bitcoin’s price has held up relatively well, bouncing sharply off $80K support - where could it head next?

StoneX Europe Ltd may make third party material available on this website which may contain information included but not limited to the conditions of financial markets. The material is for information purposes only and does not contain, and should not be construed as containing, investment advice and/or investment recommendation and/or an investment research and/or an offer of or solicitation for any transactions in financial instruments; any decision to enter into a specific transaction shall be made by the client following an assessment by him/her of their situation.
StoneX Europe Ltd makes no representation or warranty and assumes no liability as to the accuracy or completeness of the information provided, nor any loss arising from any investment based on a recommendation, forecast or other information supplied. You should always seek independent advice as to your suitability to speculate in any related markets and your ability to assume the associated risks, if you are at all unsure. We are not under any obligation to update any such material. Any opinion made may be personal to the author and may not reflect the opinion of StoneX Europe Ltd.