



Another peek (at peak?) inflation
We take another look at some inflationary inputs ahead of tomorrow’s highly anticipated inflation report for the US.
Share this:

We took an indepth look at inflationary pressures back in June, after US CPI showed early signs of a peak by falling to 8.2% from 8.5%. We noted in the report that it will take more than one-month worth of data to confirm a peak. And we’re glad we did as it now sits at 9.1%. Besides, some inflationary pressures were softening whilst commodity prices continue to rise. So today we’ll take another look at some of these metrics to see if we are any closer to this elusive inflationary peak.
Inflationary pressures continue to recede
Supply chain bottlenecks are continuing to fall, and that has arguably been a major factor behind higher consumer prices. The GSCPI (global supply chain pressure index) has now fallen to a 29-month low as covid restrictions have continued to ease and deliveries are made. The Baltic Dry index, which measures sea freight, is also at a 6-month low.
Encouraging signs for the deflation enthusiasts are also apparent in US PMI reports, with the ISM manufacturing ‘prices paid’ falling to a 23-month low and the services to a 29-month low. The Philly Fed prices paid is at a 30-month low. If purchase managers are paying lower prices for good, it eases pressure further along the supply chain.
- Supply chain pressure index (29-month low)
- Baltic dry index (6-month low)
- ISM manufacturing prices paid (23-month low)
- ISM services prices paid (29 month low)
- Philly Fed prices paid (30-month low)
Commodity prices have fallen over the past 3-months
A fly in the ointment in June’s report was that commodities were mostly higher. Yet the chart below shows oil prices (a key inflationary input for global prices) and the CRB index are trading lower for a third month. With geopolitics between Russia and Europe still in play, and the resurgence of China and Taiwan, we should be on guard for higher commodity prices. But we can at least see deflationary pressures over the near-term which are yet to make their way to headline inflation.
Consumer inflation expectations are also on the decline
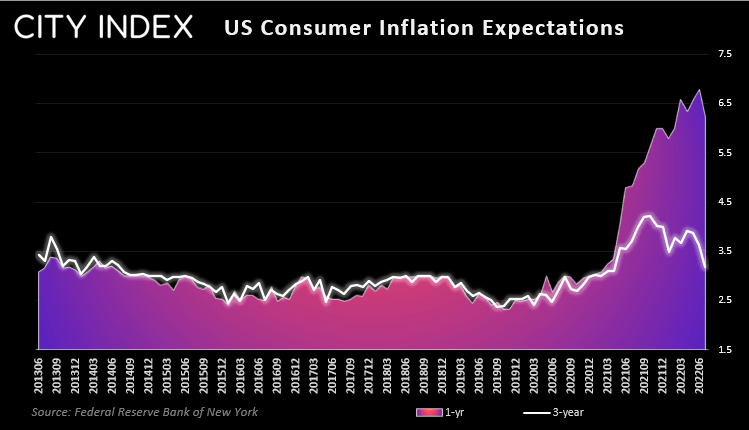
The Fed pay close attention to consumer inflation expectations, because if they remain elevated so can actual inflation levels. And the last thing the Fed want to see is higher prices become ‘entrenched’. So it could be music to Federal Reserve Bank ears that there are signs of inflation expectations moving lower.
According to a New York Fed survey, 1-year inflation expectations have fallen to a 5-month low, and the 3-year to a 15-month low. They remain higher than we’d like at 6.2% and 3.2% respectively, but it marks a break a potential turning point. Furthermore, food and gas prices are expected to plummet over the next 12-months according to the survey. Let’s hope they’re right.
And according to the University of Michigan Consumer Survey, 1-year inflation expectations fell to a 7-month low of 2.9%.

What to expect at this week’s inflation report
- CPI is expected to fall to 8.7% from 9.1% y/y
- Core CPI (less food and energy) is expected to rise to 6.1% from 5.9%
We’ve outlined a case for weaker inflation, whether it shows up in tomorrow’s figures may be another story. The data sets we have compared are not necessarily aligned in respects to lookback or look forward periods, and it can be hard to estimate how long each input takes to make its way through to consumer prices. But we can see that, overall, inflationary pressures are receding.
If we see another hot print it will likely support the US dollar, as it increases the odds of another 75-bp hike from the Fed. It could also weigh on Wall Street, which has been rallying due to short-covering on hopes that the Fed may not hike as aggressively as originally feared. Of course, if we do see strong evidence of peak inflation tomorrow with a weak print, then it would send stocks higher as it means the Fed are less likely to hike so aggressively, especially on the back of a strong nonfarm payrolls report.
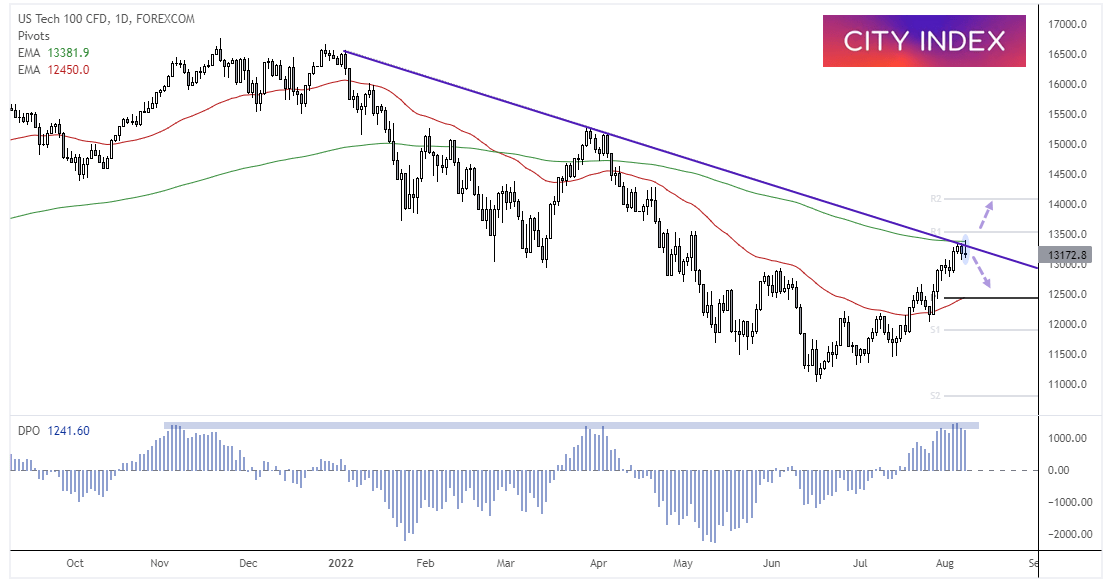
Nasdaq 100 Daily Chart:
Purely from a technical perspective, it appears the Nasdaq 100 could mean revert from its current highs. The Nasdaq 100 has rallied over 20% from the June low but has met resistance at its 200-day eMA and bearish trendline. The monthly R1 pivot point is also hovering just above 13,500 as an extra layer of resistance. The DPO (Detrended Price Oscillator) – which measures the distance of price from its 21-bar MA – has also risen to a historical resistance level, which suggests mean reversion is due. A bearish Pinbar formed yesterday, so we are now looking for prices to top out and move lower. A break below 13,000 assumes bearish continuation.

How to trade with City Index
You can easily trade with City Index by using these four easy steps:
- Open an account, or log in if you’re already a customer
• Open an account in the UK
• Open an account in Australia
• Open an account in Singapore
- Search for the company you want to trade in our award-winning platform
- Choose your position and size, and your stop and limit levels
- Place the trade
How to trade with FOREX.com
Follow these easy steps to start trading with FOREX.com today:
- Open a Forex.com account, or log in if you’re already a customer.
- Search for the pair you want to trade in our award-winning platform.
- Choose your position and size, and your stop and limit levels.
- Place the trade.
Related tags:
Latest market news




The complete CFD trading experience
Award-winning platforms, competitive spreads, low commissions and dedicated support.
We live and breathe the markets and are dedicated to helping traders realise their ambitions as we continue to set the industry bar.
Economic calendar
Web Trader platform
Our sophisticated web-based platform is packed with features.
Related articles
EUR/USD weekly outlook: FOMC and ECB to set the tone
The current backdrop is modestly bearish. On Friday, the EUR/USD closed modestly lower, down for the third consecutive day. The pair also posted a weekly decline after staging a modest recovery attempt in the previous week. Out of the past 8 weeks, the EUR/USD has fallen on 6 occasions. There is not much supporting factors for the single currency right now. So, the upside remains capped.
S&P 500, Nasdaq, Dow Forecast: Nasdaq Selloff Deepens as Dow Rally Stalls 10 24 2026
A failed S&P breakout and looming Nasdaq support test raise the stakes for next week’s Fed decision and October’s monthly close.


USD/JPY Weekly Outlook: AI earnings could overshadow the Fed and BoJ
AI sentiment has become a major driver of US Treasury yields and USD/JPY. With Microsoft, Alphabet and Amazon reporting this week, central bank decisions may have competition for traders' attention.

StoneX Europe Ltd may make third party material available on this website which may contain information included but not limited to the conditions of financial markets. The material is for information purposes only and does not contain, and should not be construed as containing, investment advice and/or investment recommendation and/or an investment research and/or an offer of or solicitation for any transactions in financial instruments; any decision to enter into a specific transaction shall be made by the client following an assessment by him/her of their situation.
StoneX Europe Ltd makes no representation or warranty and assumes no liability as to the accuracy or completeness of the information provided, nor any loss arising from any investment based on a recommendation, forecast or other information supplied. You should always seek independent advice as to your suitability to speculate in any related markets and your ability to assume the associated risks, if you are at all unsure. We are not under any obligation to update any such material. Any opinion made may be personal to the author and may not reflect the opinion of StoneX Europe Ltd.