




AUD/USD is on track for best week this year: Asian Open – 14th July 2023
Appetite for risk has been on the rise which has seen commodity currencies such as AUD and NZD outperform. Today we look at a potential bullish setup on AUD/JPY.
Share this:

Market Summary:
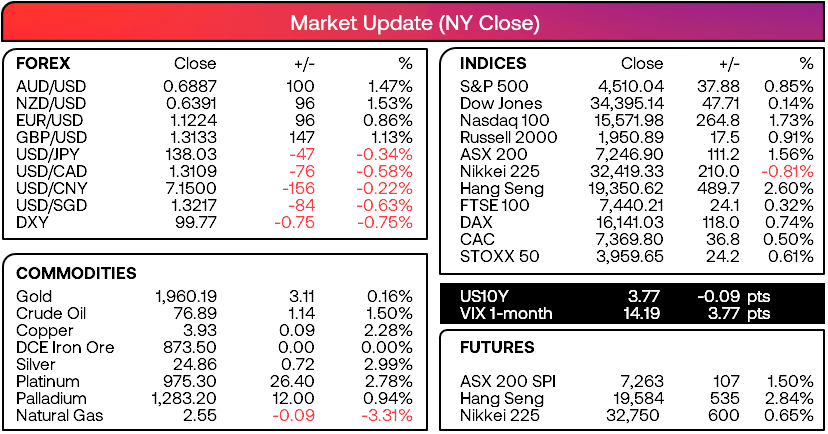
- US producer prices (a key inflationary input) slowed to a rate of 2.4% y/y – its lowest annual rate in 29 months, which weighed further on the US dollar as traders scaled back bets of further Fed hikes beyond July
- The US dollar index closed below 100 for the first time in 15 months as it tracked US yields lower, EUR/USD closed above 1.23, USD/CHF sank to an 8-year low and USD/CAD reached our initial target around the June low (1.30 up next?)
- Wall Street continued higher which saw the S&P 500 close above 4500 for the first time since April 2022 and the Nasdaq reach and 18-month high
- UK data was not as soft as expected overall, and whilst that looks good for the UK to avoid a recession it does little to dispel concerns of another 50bp BOE hike or peak rate above 6%.
- Yet more trouble for China’s economy was revealed in weak trade balance data, with exports falling -12.4% y/y, faster than -7.5% previously and -9.5% expected. Imports were also weak at -6.8% to show dwindling demand domestically and overseas.
- Further signs of economic weakness for New Zealand (who are already within a technical recession) revealed themselves in the business PMI, which contracted faster than expected at 47.5 (49.8 forecast) and retail sales only rise 4.2% y/y compared with 9.9% expected. This reinforces the view that the RBNZ will maintain rates at 5.5% for the year.
- It has been reported that RBA governor Lower will not be reappointed when his term expires in September, and his successor could be announced later today (front runners include Deputy Governor Bullock, Treasury Secretary Steven Kennedy and Department Secretary Jenny Wilkinson)
Events in focus (AEDT):
- 12:00 – The PBOC (People’s Bank of China) hold a news conference on lending data for June and the first half of 2023
- 14:30 – Japan’s industrial output
- 00:00 – Michigan consumer sentiment

Technically Speaking:
- AUD/USD is on track for its most bullish week this year, having risen over 3% over the past two days alone. The 1-hour trend structure is very bullish and forming a potential bullish continuation pattern (pennant / small triangle) but the June highs and January volume cluster make reward to risk ratio undesirable over the near-term. We would prefer to see a pullback, or break above 62c and for it to run into support before considering longs.
- USD/JPY fell for a sixth day (a bearish sequence not seen since November 2020), although its daily high – low range was the smallest of the six days to show bears are losing steam around the 138 handle / December high
- AUD/NZD produced a second inverted hammer on the daily chart (although this time it was an outside day). Whilst volatility has increased, our bias remains bullish above 1.0730 and for a run towards 1.0900 on bets that the RBNZ-RBA cash rate differential will diminish
- NZD/USD rallied to its highest level since February which leaves 64c as the next major level for bulls to conquer
- The Nikkei 225 snapped a 5-day losing streak and closed back above 32k, after it found support at the 61.8% Fibonacci ratio on Wednesday. Yet it clearly lacks the bullish interest seen across US and European indices, but it may have the potential to retest 32,700 today
- The Hang Seng rallied for a fifth day in line with
- China A50
- WTI crude oil is on track for its third bullish week and third day higher. It closed to its highest level since April and its intraday day trend remains bullish, but bulls should take note that the 200-da EMA and 200-day MA capped yesterday’s gains, which increases the risks of a technical pullback from current levels
ASX 200 at a glance:
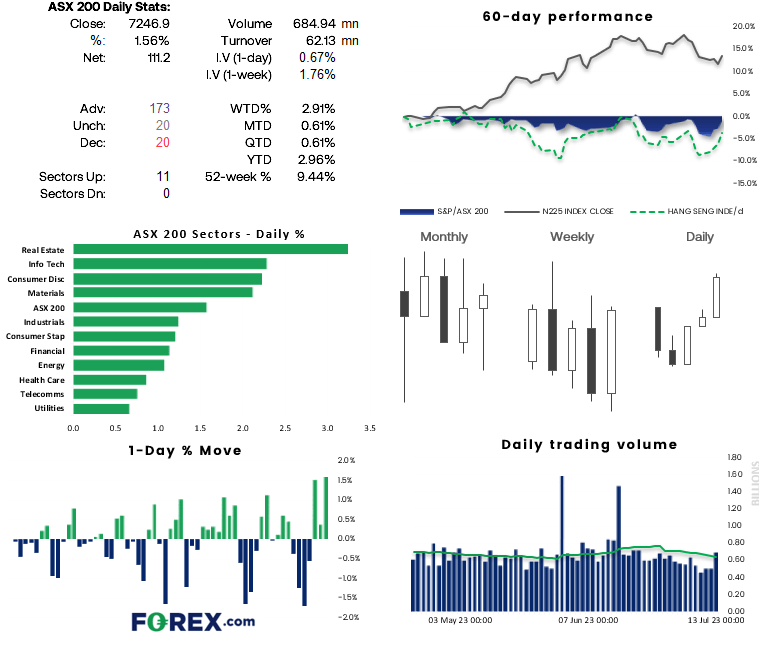
- The ASX 200 has reversed all of last week’s gains and is on track for a bullish engulfing week
- 81% of ASX 200 stocks rallied yesterday and trading volumes were above their 20-day average for the first time in four weeks
- This suggests bulls were returning to the table following the soft US inflation print, on hopes it alleviates pressure form the RBA to hike much further
- 7300 is the next target for bulls, a break above which brings the 7370 high into focus, but we may also find that upside volatility diminishes as we head into cycle highs ahead of the weekend

AUD/JPY 1-hour chart:
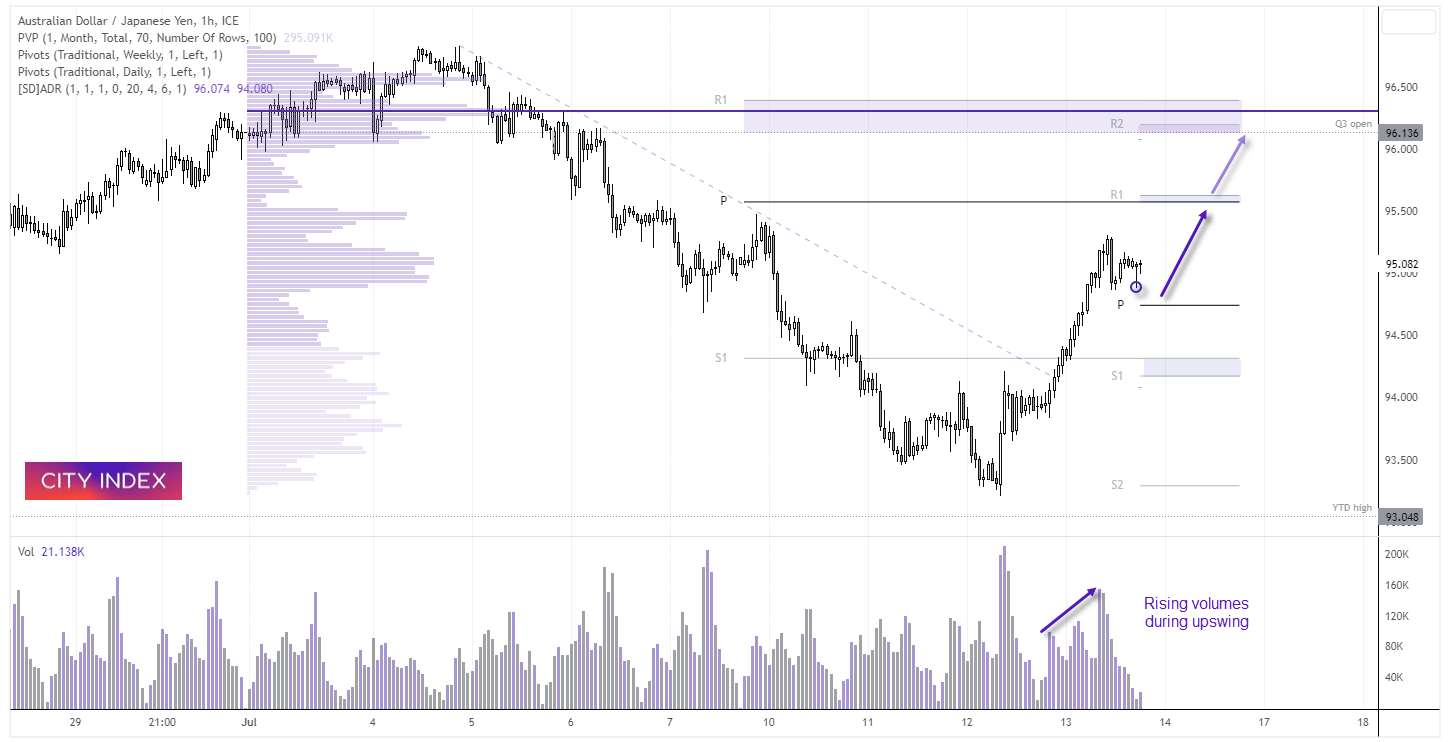
AUD/JPY is a key barometer of risk for FX markets, and it is tracking global indices higher thanks to weaker inflation prints from the US. The 1-hour chart shows that strong volume formed at the lows just above 93, and volumes also trended higher during the relatively straight-lined rally from 94 to the 95.3 high. A bearish engulfing candle formed at the highs and prices are now consolidating, so we’re now trying to identify a potential swing low in anticipation of its next leg higher. A bullish pinbar formed at the end of the US session, so there seems to be some demand around 94.88, but bulls could also seek dips around or above the daily pivot point. The initial target is 95.50, just beneath the weekly pivot point and daily S1 levels, a break above which brings 96 into view near the Q3 open, daily R2 and weekly R1.

-- Written by Matt Simpson
Follow Matt on Twitter @cLeverEdge
How to trade with City Index
You can trade with City Index by following these four easy steps:
- Open an account, or log in if you’re already a customer
• Open an account in the UK
• Open an account in Australia
• Open an account in Singapore
- Search for the market you want to trade in our award-winning platform
- Choose your position and size, and your stop and limit levels
- Place the trade
Latest market news




The complete CFD trading experience
Award-winning platforms, competitive spreads, low commissions and dedicated support.
We live and breathe the markets and are dedicated to helping traders realise their ambitions as we continue to set the industry bar.
Economic calendar
Web Trader platform
Our sophisticated web-based platform is packed with features.
Related articles
EUR/USD Q4 2026 Outlook: Euro at a Crossroads as Fed, ECB Tighten 9 25 2026
EUR/USD enters Q4 at a pivotal inflection point as competing Fed-ECB policy paths and persistent inflation risks collide with major technical support.
USD/JPY Q4 2026 Outlook: Hawkish Fed Pricing Clashes With Intervention Risk
The year-end tug-of-war is clear: hawkish Fed pricing supports USD/JPY, while intervention risk limits the upside.


Japanese Yen Forecast: USD/JPY 4% Rally Challenges Post-Intervention Downtrend 9 24 2026
USD/JPY momentum has shifted sharply higher, putting a major resistance confluence in focus as U.S. and Japanese event risk builds.
StoneX Europe Ltd may make third party material available on this website which may contain information included but not limited to the conditions of financial markets. The material is for information purposes only and does not contain, and should not be construed as containing, investment advice and/or investment recommendation and/or an investment research and/or an offer of or solicitation for any transactions in financial instruments; any decision to enter into a specific transaction shall be made by the client following an assessment by him/her of their situation.
StoneX Europe Ltd makes no representation or warranty and assumes no liability as to the accuracy or completeness of the information provided, nor any loss arising from any investment based on a recommendation, forecast or other information supplied. You should always seek independent advice as to your suitability to speculate in any related markets and your ability to assume the associated risks, if you are at all unsure. We are not under any obligation to update any such material. Any opinion made may be personal to the author and may not reflect the opinion of StoneX Europe Ltd.