

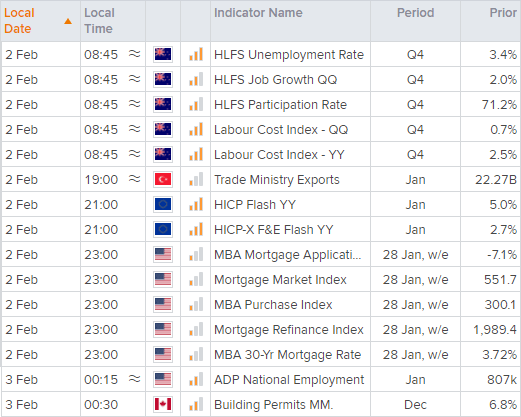


Asian Open: NZ unemployment falls to a new record low
New Zealand's jobs report saw unemployment fall for a fifth consecutive quarter to a fresh record low of 3.2%.
Share this:

Tuesday US cash market close:
- The Dow Jones Industrial rose 273.38 points (0.78%) to close at 35,405.24
- The S&P 500 index rose 30.99 points (0.69%) to close at 4,546.54
- The Nasdaq 100 index rose 89.624 points (0.6%) to close at 15,019.68
Asian futures:
- Australia's ASX 200 futures are up 55 points (0.8%), the cash market is currently estimated to open at 7,061.00
- Japan's Nikkei 225 futures are up 130 points (0.48%), the cash market is currently estimated to open at 27,208.48
- Hong Kong's Hang Seng futures are down 0 points (0%), the cash market is currently estimated to open at 23,802.26
- China's A50 Index futures are up 3 points (0.02%), the cash market is currently estimated to open at 14,772.78
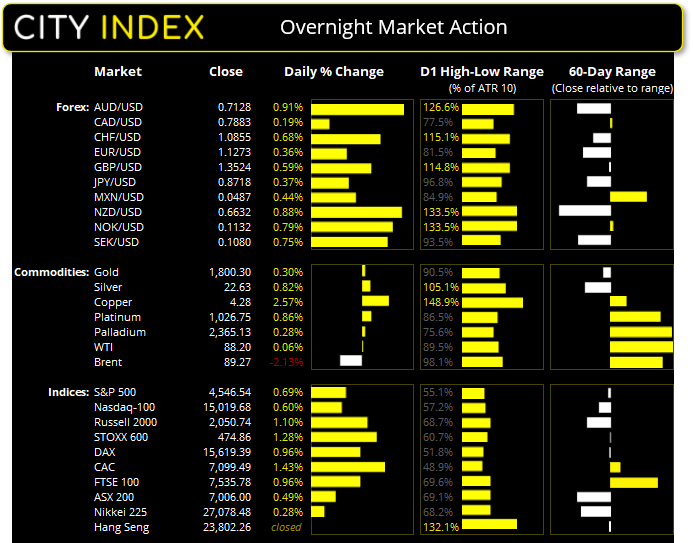
Wall Street extends it rally (on declining volumes…)
US indices rose for a third day although upside volatility was the lowest of the 3-days. Whilst it’s nice to see equities rise after a drubbing we also remain mindful of the fact they rise on lower volumes. The jury remains out as to whether this is the early stages of a bull rally or simply a bear0market bounce. The S&P 500 rose 0.7% to the Nasdaq’s 0.6%, and the Dow led the way with a 0.8% gain.
Antipodeans take advantage of a weak greenback
The New Zealand dollar retained its place at the top spot yesterday after another strong unemployment print, although the Kiwi and Aussie dollars were already strong due to a weaker dollar. Unemployment hit a new low of 3.2%, although employment change underwhelmed by only growing 0.1%, below 0.3% expected and the 2% prior. Labour costs also rose 0.7% q/q and 2.8% y/y. The Kiwi dollar has experienced its fair share of selling these past few weeks and it has allowed some breathing room to rebound from cycle lows against all majors except AUD.
The dollar continues to correct
US dollar index was lower for a third day with some Fed members helping to keep it under pressure. Bullard thinks the next job report “will not be good” whilst also stating that a 50 bps hike would help the Fed. Coming form a hawk, that should be taken note off if you’re hanging your hat on such a hike in March.
US manufacturing slows to a 14-month low
ISM manufacturing expanded at its slowest rate in 14-months, down to 57.6 from 57.9. Whilst it continues to signal that growth has topped it does remain above its long-term average of 53. New orders slipped to a 19-month low of 57.9 whilst prices paid (inflation component) rose to a 2-month high of 76.1, which remains relatively high to its long-term average of 60.
Gold toys with its 200-day eMA
Gold rose to a 3-day high of 1808, meaning it reached both of our near-term upside targets. Yet the 200-day and 50-day eMA’s continues to cap as resistance, and the market is on track for a bearish hammer on the daily chart. The four-hour chart shows the monthly pivot point and 38.2% Fibonacci retracement is also acting as resistance, whilst the market also trades in a tight bullish channel into resistance.
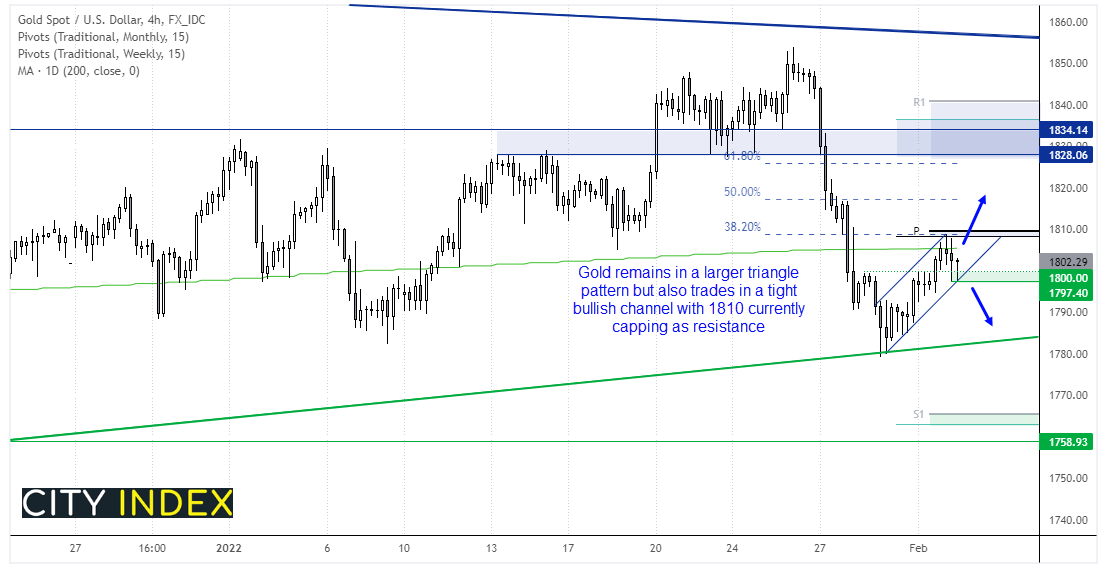

This leaves two potential outcomes; prices could hold the channel and break above 1810 to hint at trend continuation on the four-hour chart. Or bears return and break below 1797 out of the channel, which makes the 1797 - 1810 range of importance over the near-term. Given gold is only up against the US dollar (and lower against all other majors), and real yields rose overnight we’re leaning towards a downside break. But that is not reason to not be on guard for either scenario.
ASX 200 closed above 7,000 (just)
The ASX 200 managed to scrape a close above 7,000, yet the 7042.80 high capped as resistance which reaffirms the level’s importance. Whilst prices are rising it could simply be part of a dead-cat bounce whilst upside volatility remains underwhelming.
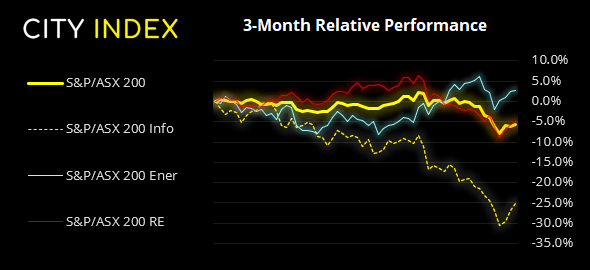
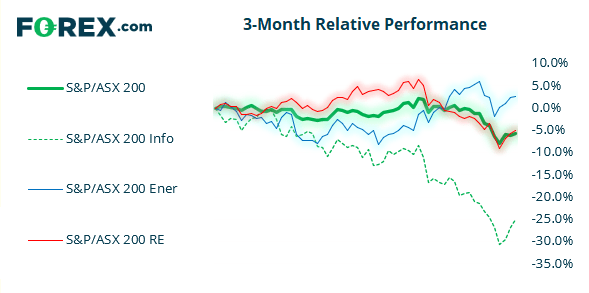
ASX 200: 7006 (0.49%), 1ST February 2022
- Utilities (2.57%) was the strongest sector and Materials (-1.21%) was the weakest
- 10 out of the 11 sectors closed higher
- 1 out of the 11 sectors closed lower
- 9 out of the 11 sectors outperformed the index
- 35 (17.50%) stocks advanced, 155 (77.50%) stocks declined
Outperformers:
- +7.28% - Pendal Group Ltd (PDL.AX)
- +6.56% - Judo Capital Holdings Ltd (JDO.AX)
- +6.45% - Imugene Ltd (IMU.AX)
Underperformers:
- ·-5.42% - Genesis Energy Ltd (GNE.AX)
- ·-3.06% - BHP Group Ltd (BHP.AX)
- ·-2.48% - Brambles Ltd (BXB.AX)
Up Next (Times in AEDT)
How to trade with City Index
You can easily trade with City Index by using these four easy steps:
- Open an account, or log in if you’re already a customer
• Open an account in the UK
• Open an account in Australia
• Open an account in Singapore
- Search for the company you want to trade in our award-winning platform
- Choose your position and size, and your stop and limit levels
- Place the trade
How to trade with FOREX.com
Follow these easy steps to start trading with FOREX.com today:
- Open a Forex.com account, or log in if you’re already a customer.
- Search for the pair you want to trade in our award-winning platform.
- Choose your position and size, and your stop and limit levels.
- Place the trade.
Latest market news




The complete CFD trading experience
Award-winning platforms, competitive spreads, low commissions and dedicated support.
We live and breathe the markets and are dedicated to helping traders realise their ambitions as we continue to set the industry bar.
Economic calendar
Web Trader platform
Our sophisticated web-based platform is packed with features.
Related articles
RBA delivers 25bp hike, Bullock now the main event
The RBA delivered the expected 25bp hike, but Bullock’s press conference now looms as the bigger volatility risk for AUD/USD and the ASX 200.
Gold outlook: XAU/USD hammered, stretched and vulnerable to a sharp rebound
Gold is getting hammered for solid fundamental reasons, but history suggests extreme four-hourly oversold conditions can produce violent countertrend rallies.
EUR/USD, USD/JPY Outlook: Oil, yields and an FX identity crisis
Crude oil is setting the tone across rates and FX, leaving EUR/USD vulnerable and USD/JPY caught between higher Treasury yields and the growing threat of intervention
StoneX Europe Ltd may make third party material available on this website which may contain information included but not limited to the conditions of financial markets. The material is for information purposes only and does not contain, and should not be construed as containing, investment advice and/or investment recommendation and/or an investment research and/or an offer of or solicitation for any transactions in financial instruments; any decision to enter into a specific transaction shall be made by the client following an assessment by him/her of their situation.
StoneX Europe Ltd makes no representation or warranty and assumes no liability as to the accuracy or completeness of the information provided, nor any loss arising from any investment based on a recommendation, forecast or other information supplied. You should always seek independent advice as to your suitability to speculate in any related markets and your ability to assume the associated risks, if you are at all unsure. We are not under any obligation to update any such material. Any opinion made may be personal to the author and may not reflect the opinion of StoneX Europe Ltd.