



ASX 200 and Nikkei 225 Technical Outlook: Reversals and Key Levels in Focus
ASX 200 reverses sharply as bearish momentum builds, while Nikkei 225 consolidates in a bullish trend. Key levels suggest breakouts or pullbacks ahead.
Share this:

The ASX 200 and Nikkei 225 are showing contrasting signals as we head into September. While the ASX 200 experienced its sharpest decline in four months—threatening to confirm a broader top—the Nikkei 225 continues to consolidate within its uptrend, holding key support levels and showing signs of renewed upside momentum. Here’s a breakdown of where both indices stand technically, and what traders should watch in the days ahead.
View related analysis:
View related analysis:
ASX 200 Faces Reversal Risk, While Nikkei 225 Eyes a Fresh Breakout
ASX 200 Futures (SPI 200) Technical Analysis
The ASX 200 experienced its worst single-day drop in four months on Wednesday, driven by risk-off sentiment as global bond yields surged. The information technology sector led the decline with a -3.8% loss, followed by financials at -2.8%. All 11 sectors closed in the red, and SPI futures traded in the lower quadrant of Wednesday’s range overnight.
While my original expectation was for a standard ABC correction, Wednesday’s sharp move lower suggests the decline may be impulsive—which implies further downside before a potential cycle low is found.
At current levels, the ASX 200 is on track to complete a 3-week bearish reversal pattern known as an evening star. If this top proves significant, the record high near 9,000 may not be retested for some time.
Should the index extend its losses, the 8600 area becomes the next major support zone, aligning with the 20-week EMA, the February high, and the August low.
On the daily chart, the RSI (2) reached a 2-month low within its oversold zone, so a minor bounce is possible. However, I suspect ASX bears may look to fade into any strength toward 8800 or the monthly pivot at 8833—although that upside could prove limited given the acceleration of bearish momentum.

Chart analysis by Matt Simpson - data source: TradingView, ASX SPI 200 Index Futures (AP1!)
Nikkei 225 Futures (NK) Technical Analysis
Nikkei 225 bulls have enjoyed a 43% rally from the April low to the record high set in August—driven largely by the easing of Trump-era tariffs and the ongoing Wall Street rally. While further upside may depend on whether US indices continue to push higher, with prices still holding above the 2024 trendline, at least a minor upswing in the Nikkei appears likely.
The daily chart shows a well-structured bullish trend, with prices consolidating just below the 20-day EMA—a setup we’ve seen ahead of previous swing moves during this rally. The 50-day EMA remains upward sloping and is yet to be retested.
A small doji candle formed on Wednesday near the monthly pivot, accompanied by a bullish divergence on the RSI (2) and the RSI (14) holding above 50—suggesting buying momentum may be building.
The near-term bias remains bullish, with a potential move toward 43,000 in focus. A break above the 43,200 swing high would bring the all-time high at 43,930 back into play.
Should a deeper pullback develop, key support levels include the 50-day EMA (41,193), the high-volume node (40,700), and the 40,000 handle—all of which may attract dip buyers looking for signs of a swing low.
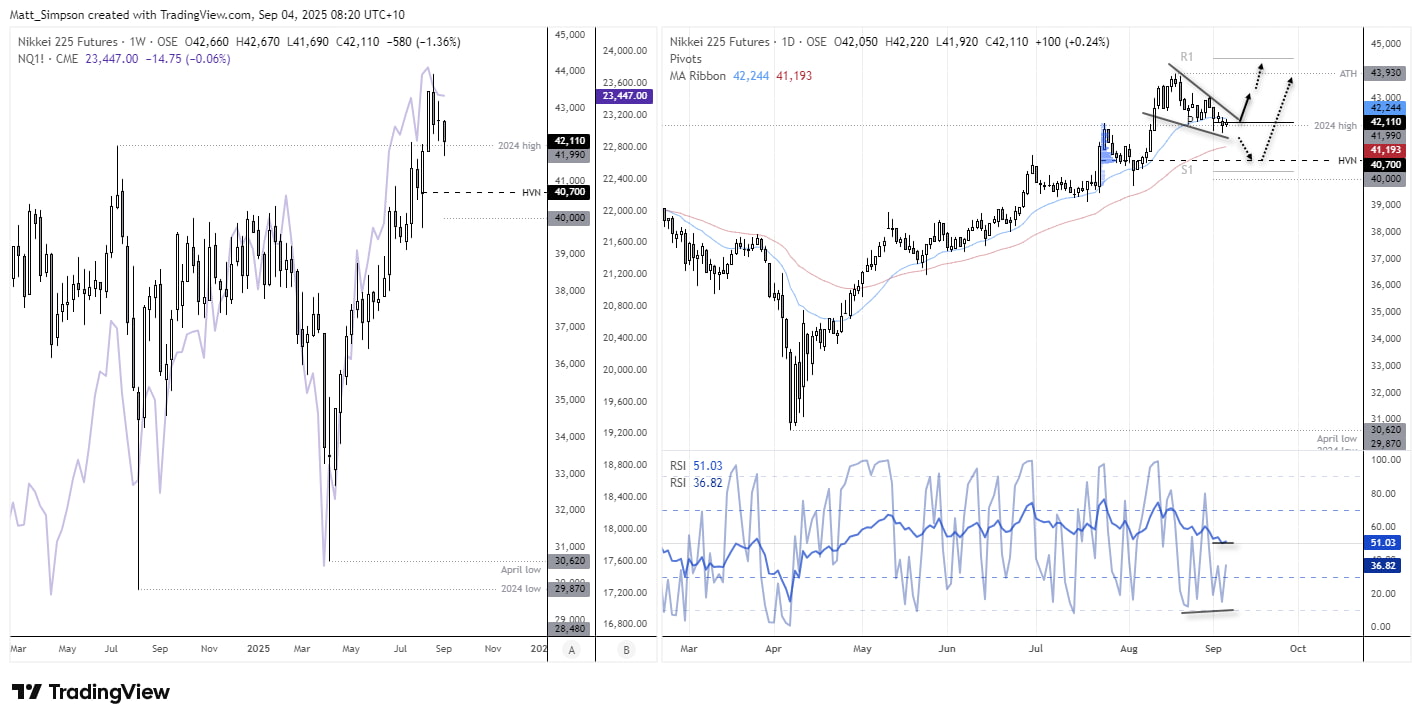
Chart analysis by Matt Simpson - data source: TradingView, Nikkei 225 (NK221!)
View the full economic calendar
View the full economic calendar
-- Written by Matt Simpson
Follow Matt on Twitter @cLeverEdge
How to trade with City Index
You can trade with City Index by following these four easy steps:
- Open an account, or log in if you’re already a customer
• Open an account in the UK
• Open an account in Australia
• Open an account in Singapore
- Search for the market you want to trade in our award-winning platform
- Choose your position and size, and your stop and limit levels
- Place the trade
Related tags:
Latest market news




The complete CFD trading experience
Award-winning platforms, competitive spreads, low commissions and dedicated support.
We live and breathe the markets and are dedicated to helping traders realise their ambitions as we continue to set the industry bar.
Economic calendar
Web Trader platform
Our sophisticated web-based platform is packed with features.
Related articles
EUR/USD weekly outlook: FOMC and ECB to set the tone
The current backdrop is modestly bearish. On Friday, the EUR/USD closed modestly lower, down for the third consecutive day. The pair also posted a weekly decline after staging a modest recovery attempt in the previous week. Out of the past 8 weeks, the EUR/USD has fallen on 6 occasions. There is not much supporting factors for the single currency right now. So, the upside remains capped.


Silver forecast: metals liquidation drags XAG/USD into $50-55 support
Silver has broken its July low and slipped into a long-term support zone as the selling in precious metals deepens. The chart shows where the metal could bottom, and next week's Fed decision may decide whether it does.

S&P 500 forecast: AI linked stocks remain under pressure
And just like that, it is Friday again and the end of a volatile week. Today offers little on the macro calendar to change the prevailing narrative, leaving markets largely at the mercy of risk appetite, oil prices and the growing unease around the AI trade.
StoneX Europe Ltd may make third party material available on this website which may contain information included but not limited to the conditions of financial markets. The material is for information purposes only and does not contain, and should not be construed as containing, investment advice and/or investment recommendation and/or an investment research and/or an offer of or solicitation for any transactions in financial instruments; any decision to enter into a specific transaction shall be made by the client following an assessment by him/her of their situation.
StoneX Europe Ltd makes no representation or warranty and assumes no liability as to the accuracy or completeness of the information provided, nor any loss arising from any investment based on a recommendation, forecast or other information supplied. You should always seek independent advice as to your suitability to speculate in any related markets and your ability to assume the associated risks, if you are at all unsure. We are not under any obligation to update any such material. Any opinion made may be personal to the author and may not reflect the opinion of StoneX Europe Ltd.