



ASX 200 Market Outlook: CBA Surges, CSL Plunges as Earnings Diverge
The ASX 200 rallied after strong Commonwealth Bank earnings, while CSL plunged on a sharp profit slump. Options positioning suggests 9000 remains a key battleground into expiry.
Share this:

The ASX 200 rallied strongly as investors rewarded Commonwealth Bank’s upbeat earnings, while CSL slumped after a sharp profit decline exposed weakness in healthcare. With the index pressing against the key 9000 level ahead of options expiry, traders now face a critical test: breakout continuation or near-term consolidation.
View related analysis:
View related analysis:
ASX 200 Rallies as Commonwealth Bank (CBA) Earnings Drive Breakout
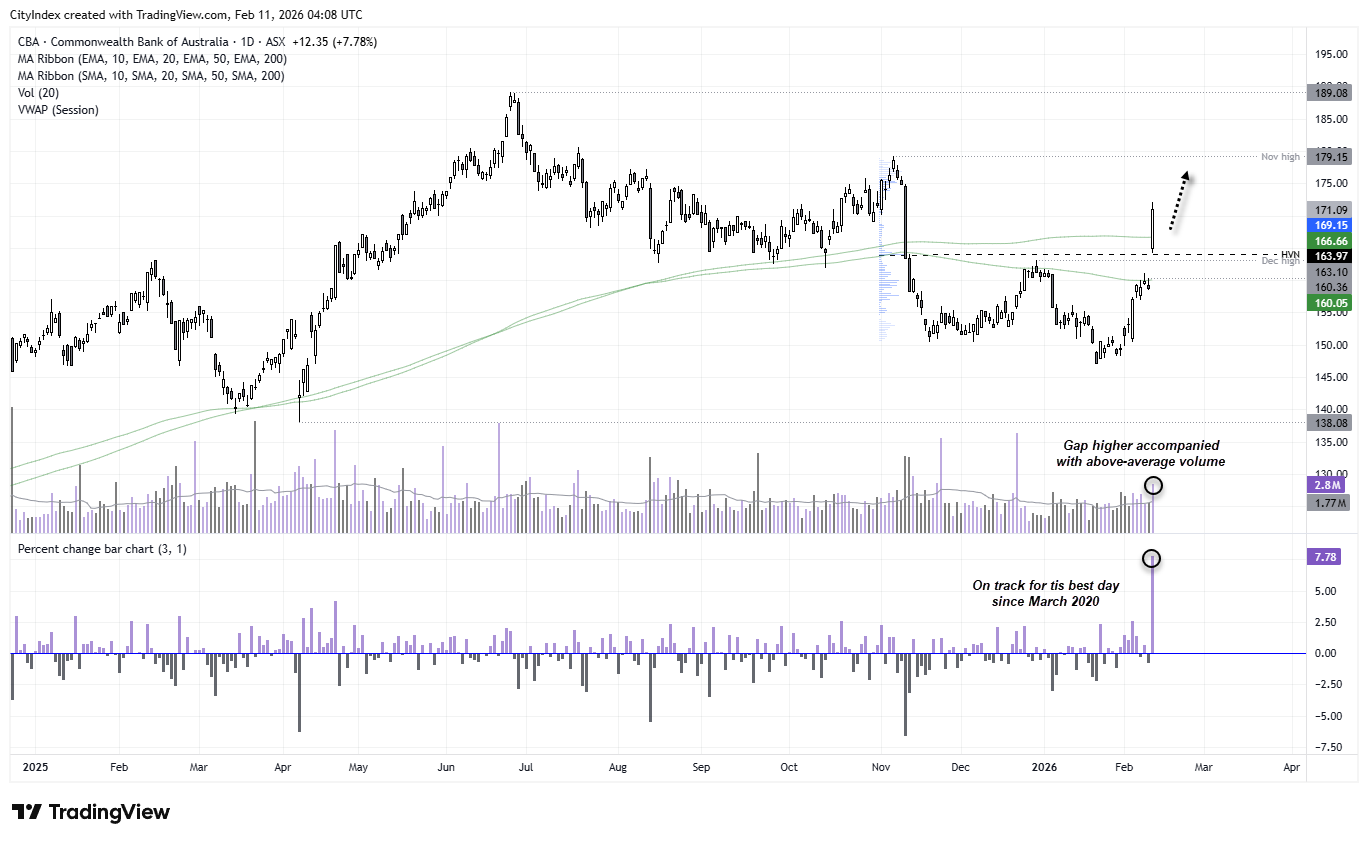
The ASX 200 was firmly higher on Wednesday after a strong earnings report from Commonwealth Bank (CBA) delivered its best daily performance since March 2020. Net profit for the six months came in at $5.37 billion, above the average analyst forecast of $5.17 billion. Solid lending growth helped lift revenue to $15 billion.
CBA shares gapped 3.6% higher at the open on above-average volumes, with prices now comfortably above both the 200-day EMA (160.05) and 200-day SMA (166.66). The stock also cleared the high-volume node (HVN) around 164, which may now offer support near today’s low. Large bullish gaps such as this tend to retain momentum unless a fresh bearish catalyst emerges.
From here, bulls may favour shallow pullbacks in anticipation of a retest of the November high near 180. A decisive break below 160 — which would undercut the 200-day EMA and close the earnings gap — would likely be required before bears regain conviction.
Source: ASX, TradingView


CSL Share Price Crashes on Profit Slump, Bears Eye 140 Support
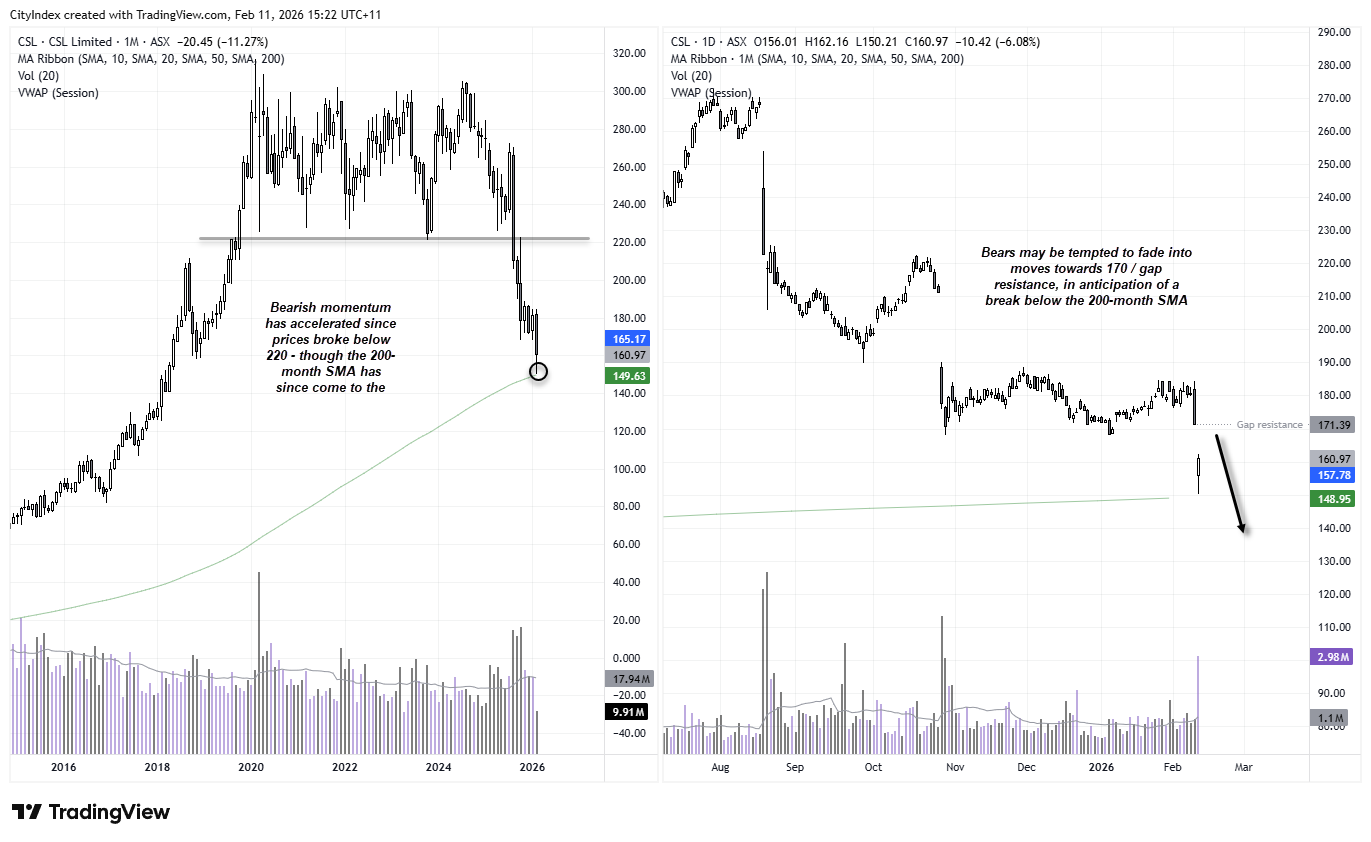
At the other end of the index, CSL plunged as much as 16.7% at the day’s low, marking its sharpest intraday drop on record. Weaker blood plasma product and vaccine sales contributed to an 81% decline in first-half profits, while the sudden departure of CEO Paul McKenzie added further pressure.
Momentum is clearly pointing lower after CSL broke beneath its long-term sideways range around 220. For now, the 200-week SMA appears to be offering support. However, unless a fresh bullish catalyst emerges, bears may look to fade rallies while prices remain below 170 — near gap resistance — in anticipation of a potential move toward 140. At this stage, a sustained recovery toward 170 appears unlikely without a material shift in sentiment.
Source: ASX, TradingView
ASX 200 Market Snapshot
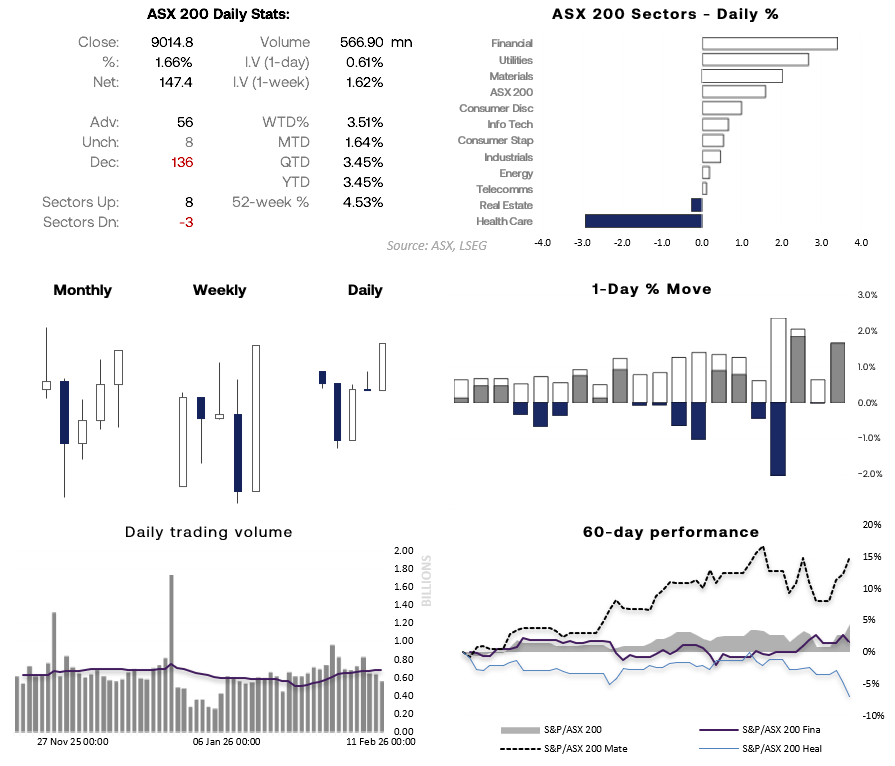
- The Australian share market rose 1.6%, marking its second-strongest session since April
- Up 3.5% WTD, the ASX 200 is on track for its best week since July 2023
- Nine of the 11 sectors advanced, led by Financials (+3.5%) and Utilities (+2.4%), while Healthcare (-2.5%) lagged
- While bulls remain in control, daily volumes have declined for a second consecutive session and remain below the 20-day SMA
- With options expiring tomorrow, trading may become choppy around 9000, with risk of a near-term pullback unless a fresh bullish catalyst emerges
Source: ASX, LSEG
ASX 200 Technical Analysis
ASX 200 Options Expiry Levels to Watch
The 9000 level remains the key battleground into Thursday’s options expiry. A heavy concentration of call open interest suggests the upside may struggle unless the index can hold decisively above that level.
Failure to do so could see the ASX 200 rotate back toward 8950 or even 8900, where positioning appears more balanced and mean reversion is more likely.
Only sustained acceptance above 9000 would shift the short-term structure and expose a move toward 9050–9100.


SPI 200 (ASX 200 Futures) Technical Outlook
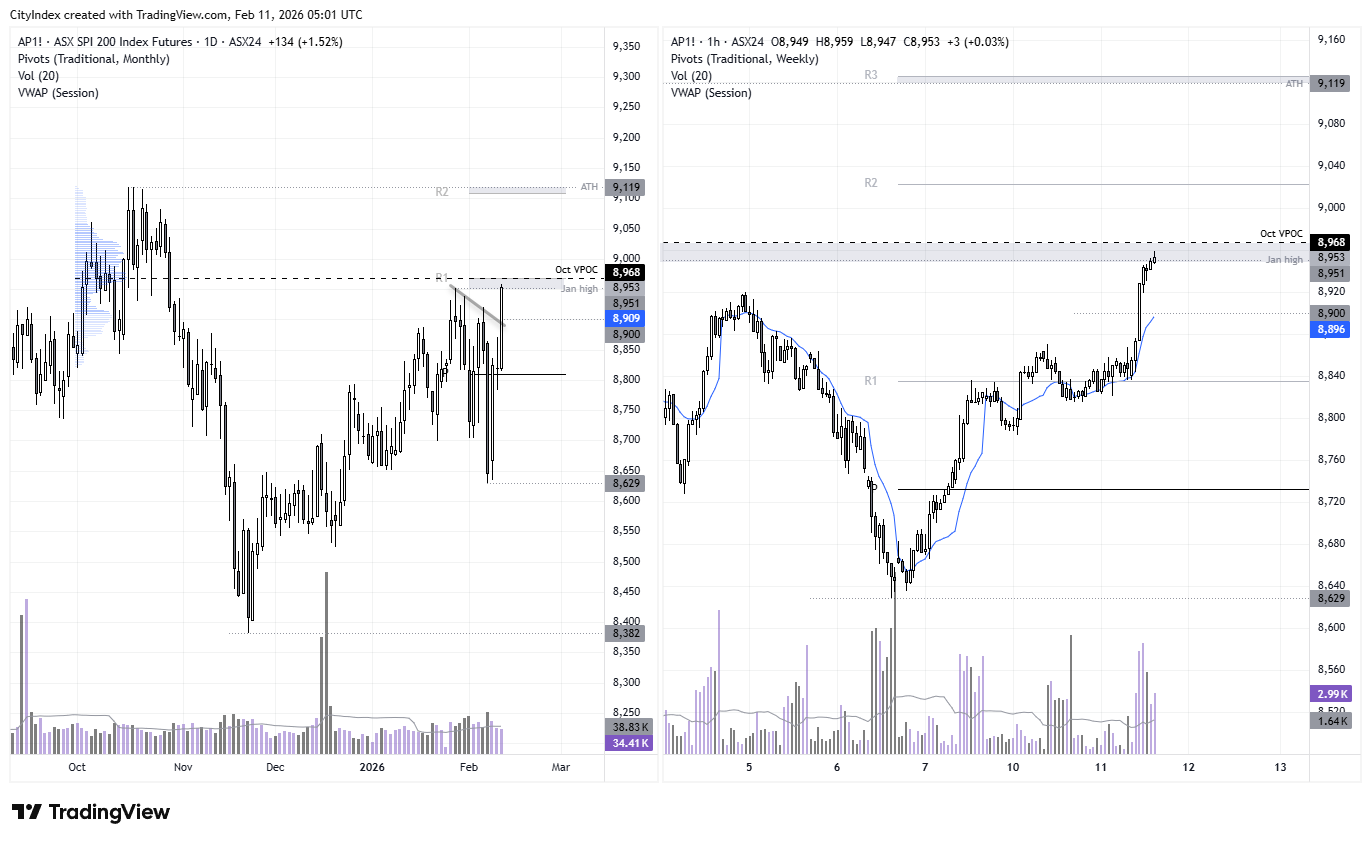
The daily chart shows the rally stalling around the January high and October VPOC, with 9000 just overhead. With significant options positioning clustered around 9000 in the cash market, trading conditions may remain choppy near these highs into Thursday’s close and options expiry.
That said, back-to-back bullish sessions suggest the earlier bearish bias has largely faded. If prices retrace from current levels, dips may attract buyers anticipating an eventual break above 9000, opening the door to 9050 and potentially the record high near 9100.
Source: ASX, TradingView
View the full economic calendar
View the full economic calendar
-- Written by Matt Simpson
Follow Matt on Twitter @cLeverEdge
How to trade with City Index
You can trade with City Index by following these four easy steps:
- Open an account, or log in if you’re already a customer
• Open an account in the UK
• Open an account in Australia
• Open an account in Singapore
- Search for the market you want to trade in our award-winning platform
- Choose your position and size, and your stop and limit levels
- Place the trade
Related tags:
Latest market news




The complete CFD trading experience
Award-winning platforms, competitive spreads, low commissions and dedicated support.
We live and breathe the markets and are dedicated to helping traders realise their ambitions as we continue to set the industry bar.
Economic calendar
Web Trader platform
Our sophisticated web-based platform is packed with features.
Related articles

S&P 500 forecast: AI linked stocks remain under pressure
And just like that, it is Friday again and the end of a volatile week. Today offers little on the macro calendar to change the prevailing narrative, leaving markets largely at the mercy of risk appetite, oil prices and the growing unease around the AI trade.


USD/JPY, Nikkei Break Lower as AI Meltdown Spreads
Thursday’s tech tantrum has become Friday’s fire sale. With Nikkei support giving way and the yen strengthening, could the selling start feeding on itself?

Nasdaq, Treasury yields and dollar face a major AI sentiment test
From crude to AI, the forces driving US markets have changed dramatically. Thursday's Nasdaq rout triggered an extraordinary Treasury rally, but the dollar barely moved. What happens next could depend on Nasdaq support.
StoneX Europe Ltd may make third party material available on this website which may contain information included but not limited to the conditions of financial markets. The material is for information purposes only and does not contain, and should not be construed as containing, investment advice and/or investment recommendation and/or an investment research and/or an offer of or solicitation for any transactions in financial instruments; any decision to enter into a specific transaction shall be made by the client following an assessment by him/her of their situation.
StoneX Europe Ltd makes no representation or warranty and assumes no liability as to the accuracy or completeness of the information provided, nor any loss arising from any investment based on a recommendation, forecast or other information supplied. You should always seek independent advice as to your suitability to speculate in any related markets and your ability to assume the associated risks, if you are at all unsure. We are not under any obligation to update any such material. Any opinion made may be personal to the author and may not reflect the opinion of StoneX Europe Ltd.