



Australian Dollar Outlook: Rates Lead AUD/USD, Options Signal Risk
The Australian dollar leads FX as RBA rates support AUD/USD, but options markets hint at rising downside risk as key US data looms.
Share this:

The Australian dollar outperformed all major currencies last week as the RBA’s hawkish rate hike pushed front-end yields to cycle highs. AUD/USD closed above 70c for the first time in two years, supported by yield differentials and broad-based AUD strength across the crosses. However, while the technical structure remains constructive, options markets are beginning to flag rising event risk, leaving the rally increasingly sensitive to incoming US data.
View related analysis:
- Gold and Silver Outlook: Whipsaws Persist, Bulls Look for a Bounce
- Silver Outlook: Volatility Tests Bulls in Early 2026
- US Dollar Rebound Faces Crucial Test Ahead of ADP, ISM and NFP
- FX Futures Positioning: USD Index, AUD/USD, USD/CAD | COT report
- Australian Dollar Outlook: AUD/USD Mulls Pullback Despite RBA Hike Bets
View related analysis:
- Gold and Silver Outlook: Whipsaws Persist, Bulls Look for a Bounce
- Silver Outlook: Volatility Tests Bulls in Early 2026
- US Dollar Rebound Faces Crucial Test Ahead of ADP, ISM and NFP
- FX Futures Positioning: USD Index, AUD/USD, USD/CAD | COT report
- Australian Dollar Outlook: AUD/USD Mulls Pullback Despite RBA Hike Bets
Australian Dollar Outlook: Rates Drive the Rally, Options Flag Risk
Australian Dollar Performance
- The Australian dollar was the strongest FX major last week following the RBA’s hawkish 25bp rate hike
- AUD/USD rose for a third consecutive week despite a stronger US dollar index, posting its first weekly close above 70c in two years
- AUD/CAD ignored the prior week’s bearish shooting-star reversal and closed above its 2023 high, though just shy of 0.96
- AUD/JPY surged to a 35-year high, with little evidence of traders hedging yen exposure ahead of Japan’s weekend election
- AUD/NZD snapped a three-week losing streak and now trades just 0.3% below its 16-year high
- GBP/AUD fell 1.3% to a 15-month low as Aussie strength coincided with a weaker pound following the BoE’s dovish hold
- EUR/AUD declined for a seventh straight week to an 11-month low, marking its most bearish weekly run in 13 years
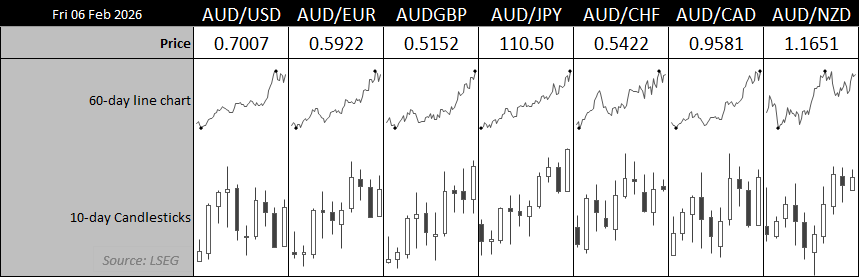
Chart prepared by Matt Simpson - Source: LSEG
RBA Signals More Tightening Ahead
The RBA delivered a hawkish 25bp hike to take the cash rate to 3.85%, with many now on guard for a follow-up hike in May. The RBA’s updated forecasts from the quarterly Statement of Monetary Polic (SOMP) has pencilled in a rate of 4.2% - with RBA cash rate futures now fully pricing this in for December. That allows a 25bp and a 15bp hike – though there is plenty of time for this to be revised higher if employment remains stable and inflation continues to misbehave.
Australia This Week: Economic Data and Events for AUD/USD Traders
AU Confidence Indicators in Focus
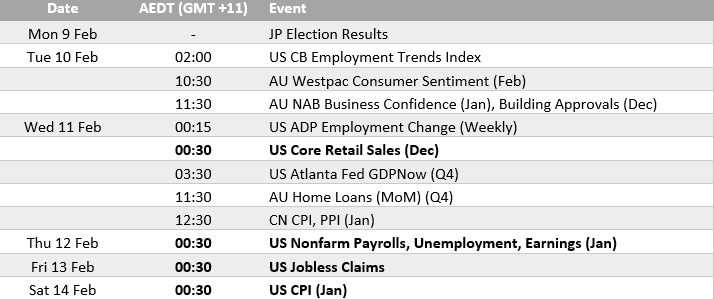
There is no top-tier domestic data from Australia this week, though consumer and business confidence will still warrant attention. Westpac’s December survey flagged weaker consumer sentiment and growing concern over further rate hikes — risks that may be amplified following the RBA’s recent hawkish move. NAB’s quarterly business confidence report is also due on Tuesday, and while the monthly survey showed a late-December uptick in optimism, that improvement may be tested in the wake of the RBA’s hike.
US Data Takes Centre Stage for AUD/USD
Most of the key data for AUD/USD traders will come from the US. The January nonfarm payrolls (NFP) report is released on Wednesday as the backfilling of data following the shutdown continues — apologies for previously noting it would be released last week. As flagged in prior reports, the key metric to watch within jobs growth remains healthcare employment, which continues to prop up an otherwise soft headline labour market.
Retail sales and CPI data are also key focal points for traders. Unless these soften meaningfully, the US dollar could remain supported, particularly after President Trump nominated Kevin Warsh as Jerome Powell’s successor — a surprisingly hawkish pick.
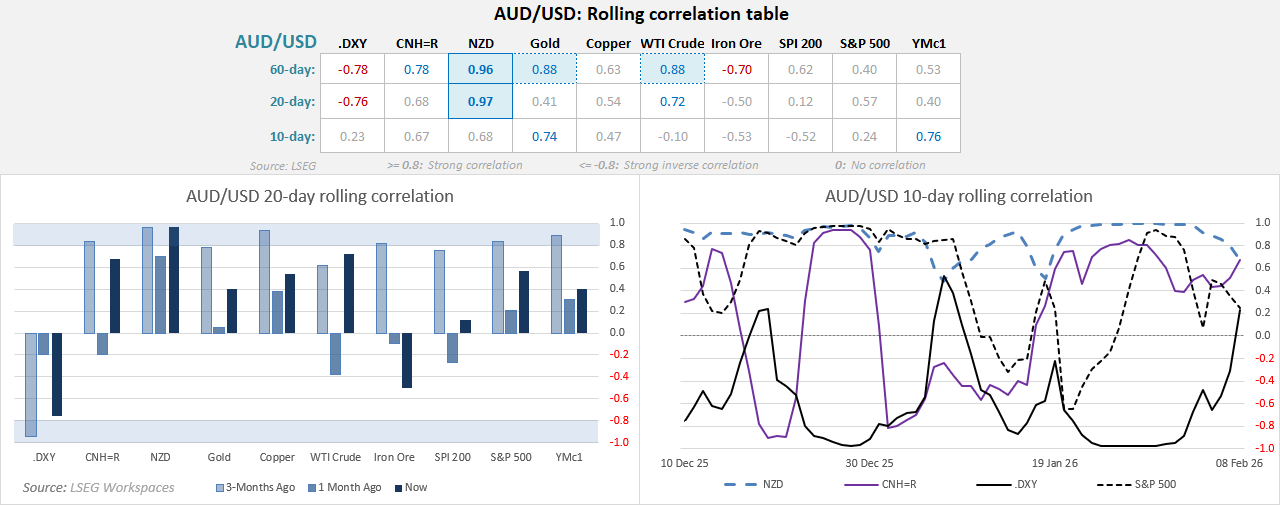
Whether US data materially impacts AUD/USD will hinge on whether the inverse US–Australian dollar correlation returns.


AUD/USD Correlations
AUD/USD has been dancing to its own beat over the past week, sustaining its rally despite a sharp sell-off in precious metals and a recovery in the dollar. As a result, short-term correlations with the US dollar, kiwi, gold, copper and WTI have weakened noticeably.
While the 20-day correlation with the US dollar index remains firmly negative at -0.76, the 10-day reading has swung into mildly positive territory, effectively signalling no meaningful correlation. One relationship worth watching is the Chinese yuan: the 10-day correlation has curled higher to 0.67, broadly matching the 20-day measure and hinting at a potential re-alignment.
Source: LSEG
AUD/USD Futures Positioning | COT Report
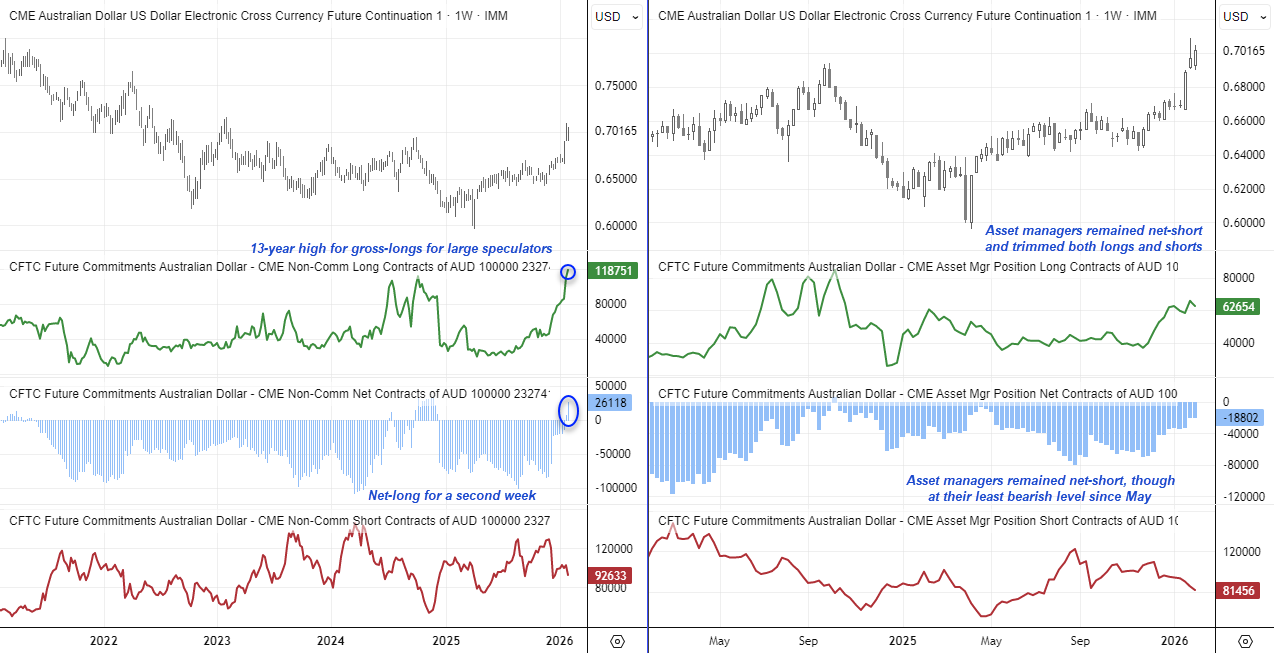
- Large speculators increased their net-long exposure to 26.1k contracts, a 13-month high and second week since flipping from net-short
- While this does not signify a sentiment extreme from net exposure, take note that gross-longs have now risen to a 13-year high
- Large speculators reduced gross-shorts by -10k contracts, asset managers trimmed by -3.7k contracts (-13.7k combined)
- 8.9k gross-longs were added by asset managers, -3.1k trimmed by asset managers (+5.8k total)
Source: LSEG, CFTC, CME


AUD/USD Technical Analysis: Australian Dollar vs US Dollar
Higher Timeframe Signals Turn Mixed
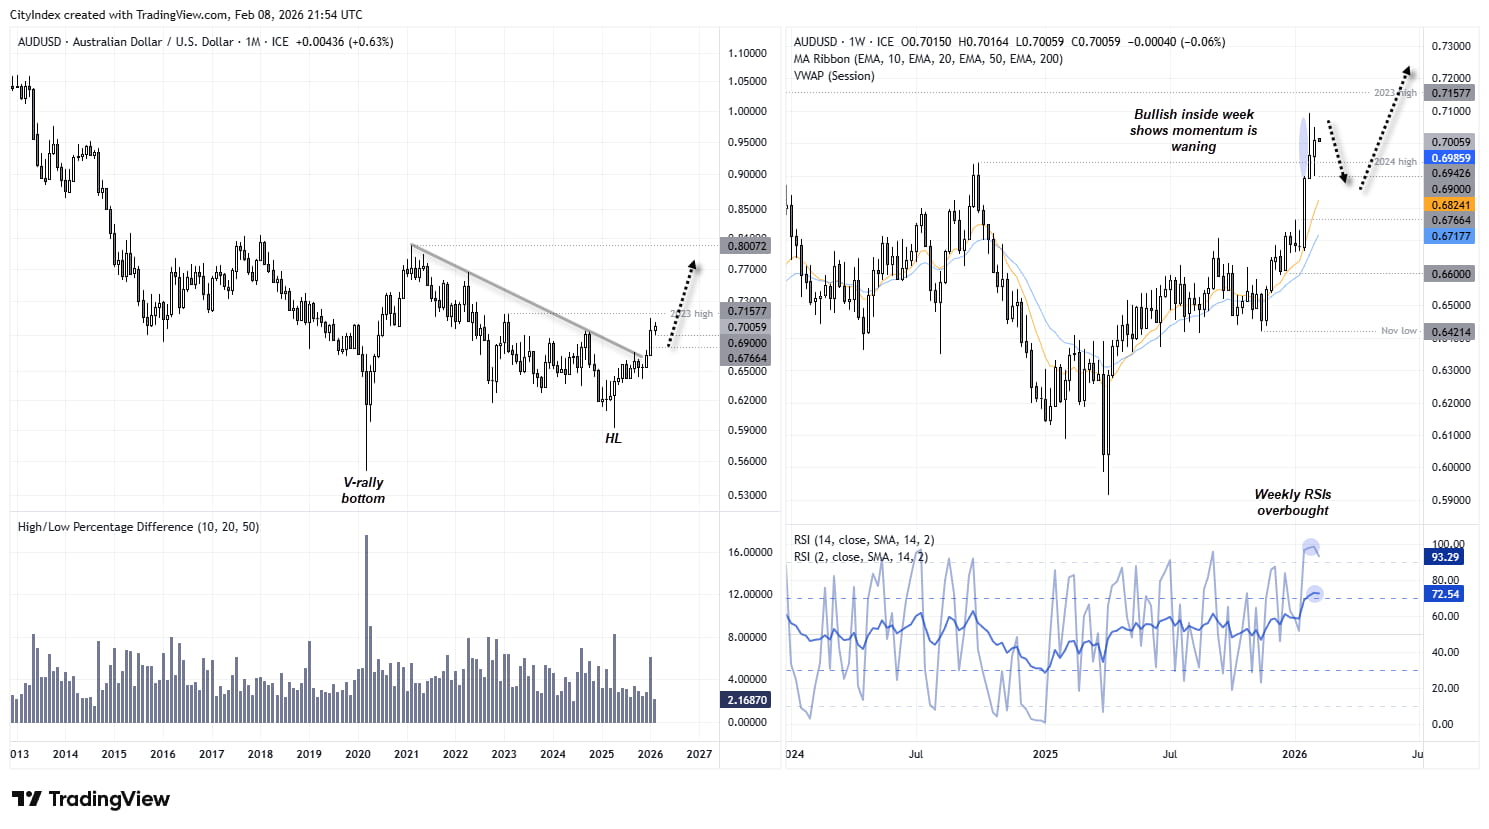
Taking a step back, the monthly chart shows a strong start to the year and a market that could eventually break above its 2023 high, opening the door to the 77c–80c region in the months ahead. The 2025 low can be viewed as a higher low relative to the 2022 V-bottom rally, while January marked the most bullish month since April, signalling a return of bullish range expansion.
However, the weekly chart (right) is flashing early warning signs. Last week printed a bullish inside week, suggesting momentum is beginning to wane. Weekly RSI (2) and RSI (14) are also overbought, raising the risk that this initial burst higher is closer to the middle than the start. As a result, AUD/USD may need to pause or consolidate, if not correct lower, before the broader uptrend can reassert itself.
Source: TradingView, ICE
AUD/USD Holds Bull Flag as Options Turn Cautious
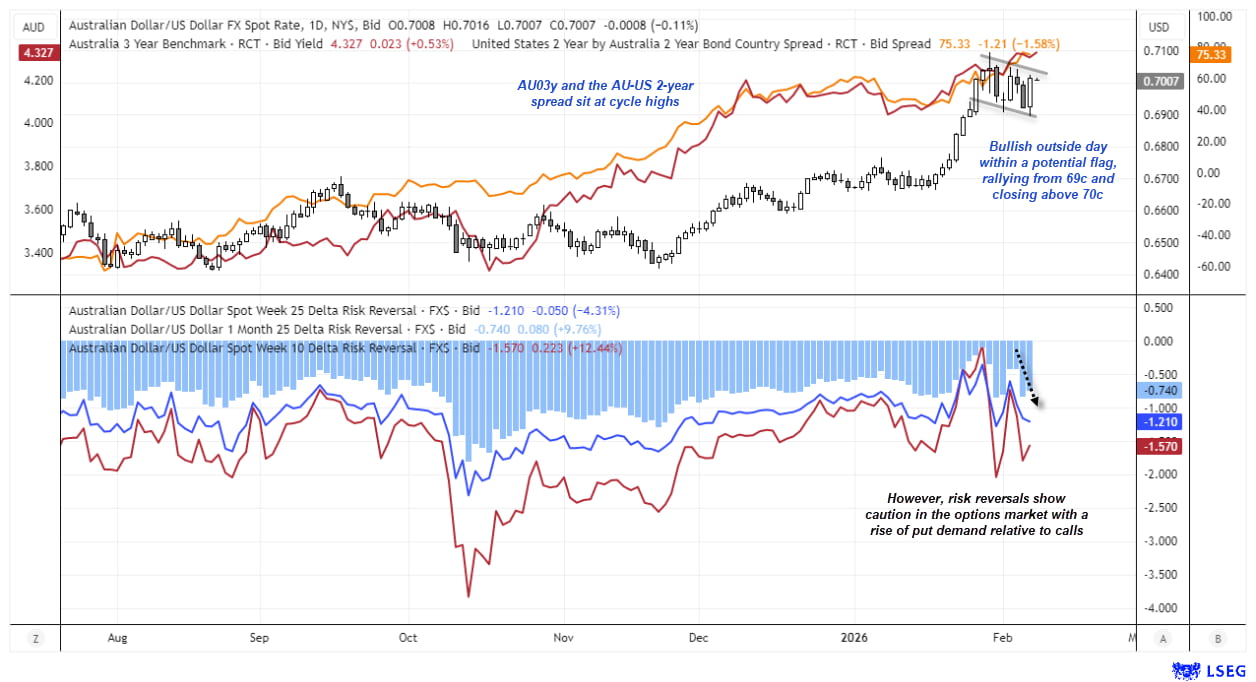
AUD/USD printed a bullish outside day on Friday, rebounding cleanly from the 69c handle and closing back above 70c — a constructive signal that leaves the pair consolidating within a potential bull flag on the daily chart. The move has been underpinned by rates, with Australian 3-year yields pushing to cycle highs and the AU–US front-end yield differential remaining elevated, reinforcing the broader bullish bias despite some recent flattening in spreads.
However, options markets are flashing early signs of caution. Short-dated risk reversals have turned lower in the second half of last week, with the 1-week 10-delta skew moving further toward puts. That shift suggests rising demand for downside protection rather than outright bearish positioning, highlighting growing sensitivity to event risk following the rally. As a result, while the technical structure remains constructive above 69c, upside momentum may become increasingly data-dependent in the near term.
Source: LSEG, CME
AUD/USD Bull / Bear Scenarios
Bullish continuation
- Daily close above 0.7050–0.7100 confirms bull-flag continuation
- Australian front-end yields remain elevated or push higher
- US CPI / NFP fail to re-ignite USD strength
- CNH remains stable, limiting China-related downside risk
Bearish reversal
- Daily close back below 0.6900 invalidates the bullish structure
- Further downward shift in short-dated risk reversals, signalling heavier downside hedging
- US inflation surprises to the upside, reviving Fed repricing
- AU–US yield differentials begin to compress meaningfully
View the full economic calendar
View the full economic calendar
-- Written by Matt Simpson
Follow Matt on Twitter @cLeverEdge
How to trade with City Index
You can trade with City Index by following these four easy steps:
- Open an account, or log in if you’re already a customer
• Open an account in the UK
• Open an account in Australia
• Open an account in Singapore
- Search for the market you want to trade in our award-winning platform
- Choose your position and size, and your stop and limit levels
- Place the trade
Related tags:
Latest market news




The complete CFD trading experience
Award-winning platforms, competitive spreads, low commissions and dedicated support.
We live and breathe the markets and are dedicated to helping traders realise their ambitions as we continue to set the industry bar.
Economic calendar
Web Trader platform
Our sophisticated web-based platform is packed with features.
Related articles
USD/JPY Weekly Outlook: Volatility Has Left the Building
The yen has ignored broad dollar weakness, falling Treasury yields and renewed market turbulence. Yet its relationship with US interest rates remains intact. So why is USD/JPY going absolutely nowhere fast?

Swiss Franc Forecast: USD/CHF Seven-Week Rally Reverses From Yearly Highs 10 16 2026
A sharp rejection from fresh highs has shifted momentum in favor of USD/CHF bears, raising the stakes for a critical support test.


AUD/USD Bulls Fight Back After Australian Jobs Shock
AUD/USD has been hit by another ugly Australian employment report, sending RBA rate hike expectations sharply lower. Yet the relationships driving the currency have shifted since quarter-end, and improving risk appetite could provide the fuel for a recovery.
StoneX Europe Ltd may make third party material available on this website which may contain information included but not limited to the conditions of financial markets. The material is for information purposes only and does not contain, and should not be construed as containing, investment advice and/or investment recommendation and/or an investment research and/or an offer of or solicitation for any transactions in financial instruments; any decision to enter into a specific transaction shall be made by the client following an assessment by him/her of their situation.
StoneX Europe Ltd makes no representation or warranty and assumes no liability as to the accuracy or completeness of the information provided, nor any loss arising from any investment based on a recommendation, forecast or other information supplied. You should always seek independent advice as to your suitability to speculate in any related markets and your ability to assume the associated risks, if you are at all unsure. We are not under any obligation to update any such material. Any opinion made may be personal to the author and may not reflect the opinion of StoneX Europe Ltd.