



Silver Outlook: Volatility Tests Bulls in Early 2026
Silver is up nearly 50% in January, but extreme volatility and exhaustion signals suggest bulls face their first real test of 2026.
Share this:

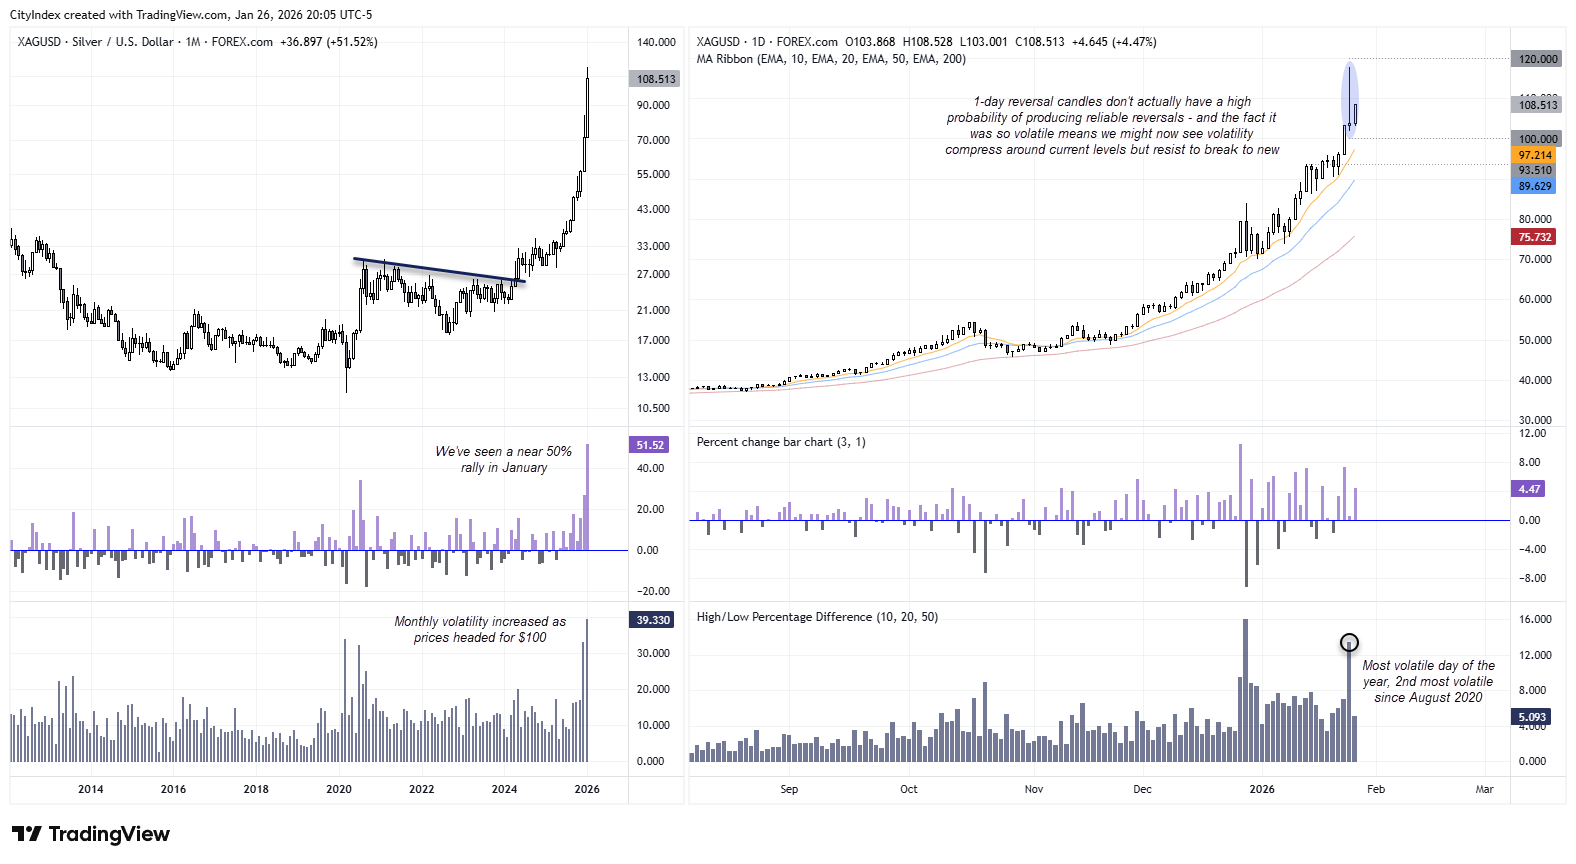
To call silver’s advance parabolic would be generous understatement. With just four trading days left in January, silver is already up nearly 50%, having printed an eye-watering 40% high-to-low range for the month. Falling US real yields, a softer US dollar, surging gold prices and mounting industrial supply concerns have all fuelled the rally.
However, as prices push deeper into uncharted territory, volatility at record highs is now presenting the first meaningful test for silver bulls in 2026.
View related analysis:
- Australian Dollar Outlook: AUD/USD Surges as Risk Appetite Returns Ahead of AU CPI
- Gold Bid at Highs as Trump Forces Tariff Debate Onto Davos’ Sidelines
- Tesla (TSLA) Earnings Preview: Q4 Margins in Focus
- Apple (AAPL) Q4 Earnings Preview: Services in Focus as iPhone Growth Slows
- Microsoft (MSFT) Q4 Earnings Preview: Cloud, AI and Margins in Focus
- Meta (META) Q4 Earnings Preview: Facebook and Instagram Ads in Focus
View related analysis:
- Australian Dollar Outlook: AUD/USD Surges as Risk Appetite Returns Ahead of AU CPI
- Gold Bid at Highs as Trump Forces Tariff Debate Onto Davos’ Sidelines
- Tesla (TSLA) Earnings Preview: Q4 Margins in Focus
- Apple (AAPL) Q4 Earnings Preview: Services in Focus as iPhone Growth Slows
- Microsoft (MSFT) Q4 Earnings Preview: Cloud, AI and Margins in Focus
- Meta (META) Q4 Earnings Preview: Facebook and Instagram Ads in Focus
Shooting Star Candle Raises Exhaustion Risk — But No Confirmation Yet
Source: Forex.com, TradingView
Monday’s elongated shooting star candle raises a warning flag for trend exhaustion, but bears should be cautious about treating it as a reliable reversal signal. Single-bar reversal patterns do not have a strong historical edge. My own testing shows their success rate clusters close to 50% when assessed over sufficiently long samples.
Importantly, Monday’s session was also the second most volatile day since August 2020, with a 13.4% high-to-low range, making it the most volatile session of 2026 so far. Given silver has rallied nearly 70% in just the past 17 days, the appearance of a shooting star at record highs at the very least signals a shift in sentiment, even if it does not confirm a trend reversal.


Consolidation More Likely Than a Sharp Reversal
What typically follows a volatile, single-bar reversal pattern is not an immediate sell-off, but rather a contraction in volatility. While the fundamental backdrop remains supportive, bullish positioning has become aggressive and arguably complacent in the near term. Many participants now struggle to envision downside, while others are likely nursing losses from late entries — a combination that tends to suppress follow-through participation at elevated prices.
Unless silver is hit with a decisively bearish catalyst, a period of choppy consolidation or range-bound trade around current levels looks more probable than a sharp reversal.
Silver Options Don’t Hint at a Major Correction
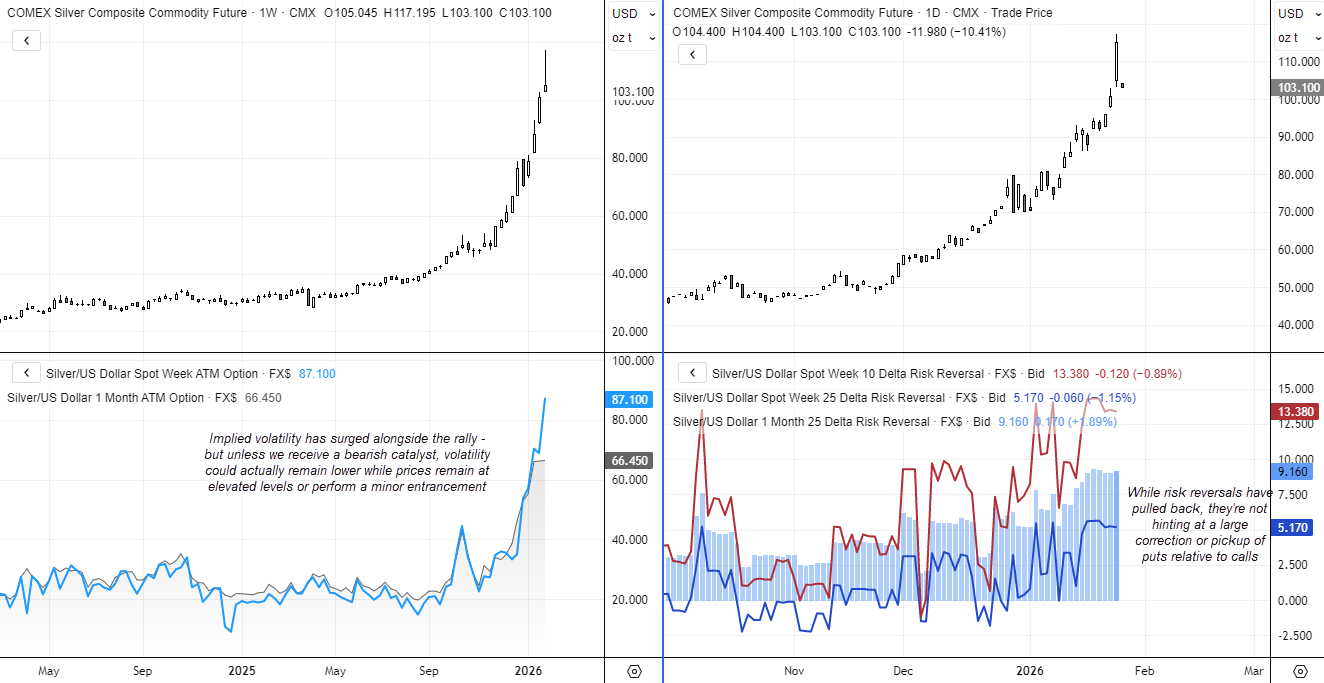
Using risk reversals as a proxy for call and put demand, elevated readings alongside record prices suggest options traders are not positioned for a sharp silver price correction. The 10-delta RR is a proxy for tail risk, which until last week was rising with prices and still remains near its own cycle highs to show call demand far outweighs put demand. While this helps with near-term sentiment, futures positioning shows caution and a hesitancy for traders to have chased prices higher.
Source: LSEG


Silver Futures Positioning | COT Report
Futures traders have remained wary of silver’s runaway rally since it took off in April 2025. Both large speculators and managed funds have significantly reduced net-long exposure, primarily through the closure of long positions. However, it is also notable that both groups have increased gross-short exposure from historically low levels.
Large speculators lifted gross shorts by 16.2% (around 2.5k contracts), while managed funds increased gross-short exposure by 18.4% (roughly 1.7k contracts). These remain modest adjustments in the broader positioning landscape, but retracements have to start somewhere. Early increases in gross short exposure may represent the first tentative pushback against an increasingly crowded long silver trade.

Source: CFTC, COMEX, LSEG
View the full economic calendar
View the full economic calendar
-- Written by Matt Simpson
Follow Matt on Twitter @cLeverEdge
How to trade with City Index
You can trade with City Index by following these four easy steps:
- Open an account, or log in if you’re already a customer
• Open an account in the UK
• Open an account in Australia
• Open an account in Singapore
- Search for the market you want to trade in our award-winning platform
- Choose your position and size, and your stop and limit levels
- Place the trade
Related tags:




The complete CFD trading experience
Award-winning platforms, competitive spreads, low commissions and dedicated support.
We live and breathe the markets and are dedicated to helping traders realise their ambitions as we continue to set the industry bar.
Economic calendar
Web Trader platform
Our sophisticated web-based platform is packed with features.
Related articles

Gold Price Short-term Outlook: XAU/USD Holds Critical Support as Breakout Nears 10 15 2026
Gold is consolidating after a steep selloff, with momentum divergence raising the stakes for the next move ahead of the Fed decision.


Silver Analysis: XAG/USD Falls Back to Annual Lows
Recent sessions have been particularly challenging for silver prices in the short term. Selling pressure has intensified considerably, resulting in three consecutive losing sessions and pushing the metal to a decline of nearly 8.5% over this period.


DXY at Key Resistance as FX Majors Lie in Wait| Weekly Technical Outlook 10 12 2026
Sr. Technical Strategist Michael Boutros highlights the levels that matter on the USD Majors, commodities, and equity indices charts this week.
StoneX Europe Ltd may make third party material available on this website which may contain information included but not limited to the conditions of financial markets. The material is for information purposes only and does not contain, and should not be construed as containing, investment advice and/or investment recommendation and/or an investment research and/or an offer of or solicitation for any transactions in financial instruments; any decision to enter into a specific transaction shall be made by the client following an assessment by him/her of their situation.
StoneX Europe Ltd makes no representation or warranty and assumes no liability as to the accuracy or completeness of the information provided, nor any loss arising from any investment based on a recommendation, forecast or other information supplied. You should always seek independent advice as to your suitability to speculate in any related markets and your ability to assume the associated risks, if you are at all unsure. We are not under any obligation to update any such material. Any opinion made may be personal to the author and may not reflect the opinion of StoneX Europe Ltd.