


EUR/USD, DXY, Silver Price Outlook: Bullish Rebounds on Hold?
EUR/USD, DXY, Silver Price Outlook: Bullish rebounds across currency markets, precious metals, and risk assets are facing renewed pressure as U.S. CPI comes in above expectations and oil-tanker attacks persist in the Strait of Hormuz.
Share this:

Bullish rebounds across currency markets, including EUR/USD, precious metals and risk assets, may be temporarily on hold following the stronger-than-expected U.S. CPI data and continued attacks on oil tankers in the Strait of Hormuz. This backdrop is supporting the U.S. Dollar Index and crude oil charts, potentially delaying those rebounds.
December Rate-Hike Expectations
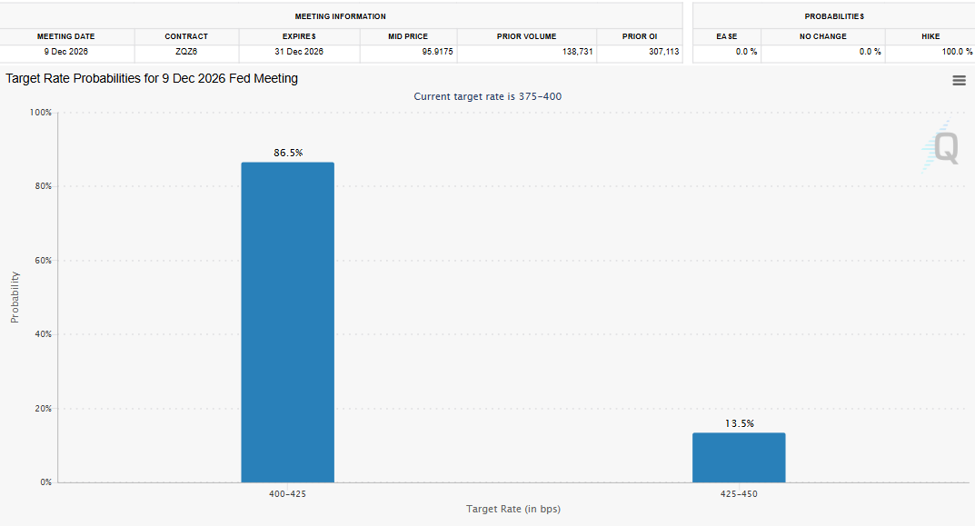
Source: CME FedWatch Tool
The probability of a December Fed rate hike has risen to nearly 100%, with markets pricing in an approximately 86% chance of a 25-basis-point increase and a 13% chance of a 50-basis-point increase. These expectations, alongside persistent geopolitical tensions, have supported the bullish setup in the DXY following the sharp volatility around the U.S. midterm election results and the Democratic victory.
DXY Price Outlook: Weekly Time Frame – Log Scale
Source: TradingView
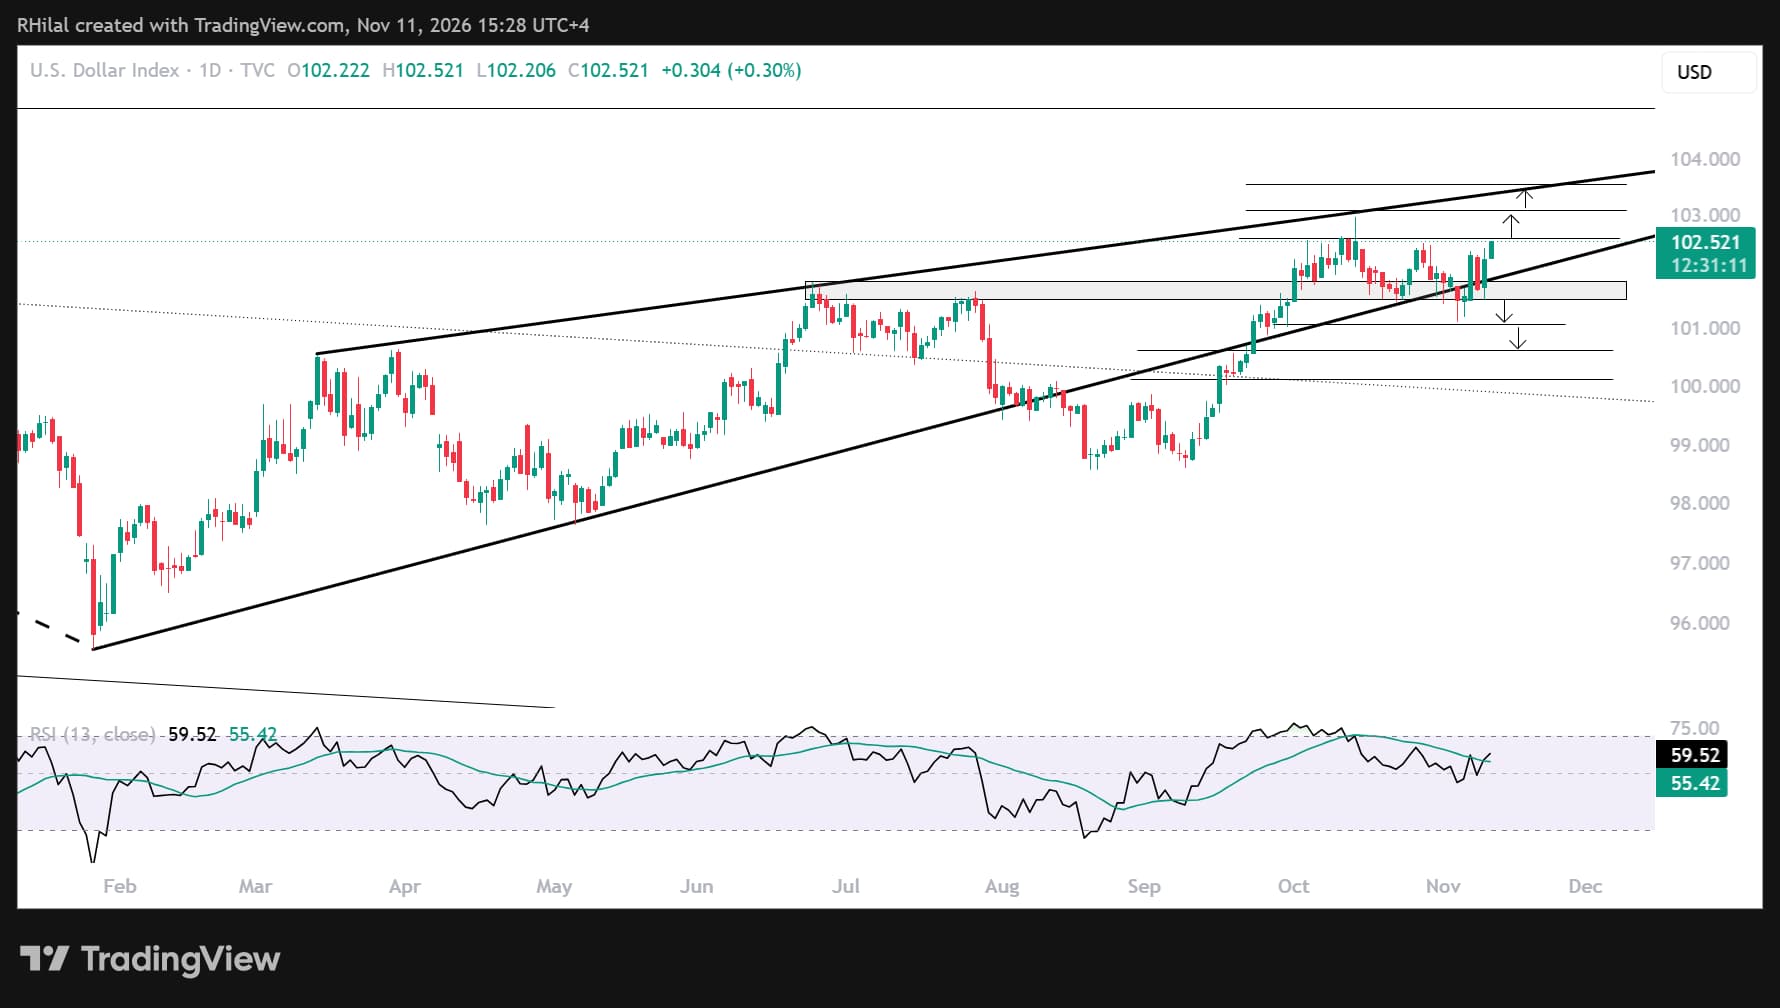
Despite briefly breaking below its 10-month rising support to test the 101 level, the DXY has climbed back above the trendline and the 102 mark, reinforcing its near-term bullish bias.
From an Elliott Wave and momentum perspective, the DXY may be tracing its fifth and final wave of 2026. A close above 102.60 would bring the eight-month rising resistance near 103–103.50 into focus. This could be a final test before either a pullback or a longer-term bullish breakout.
On the downside, a sustained break below 101 would bring 100.60 and the psychological 100 level into focus. These levels align with the 50% and 61.8% Fibonacci retracements of the September–November advance. A confirmed break lower could signal a longer-term bearish shift in the DXY, supporting rebounds across major currencies and precious metals.
EUR/USD Price Outlook: Weekly Time Frame – Log Scale
Source: TradingView
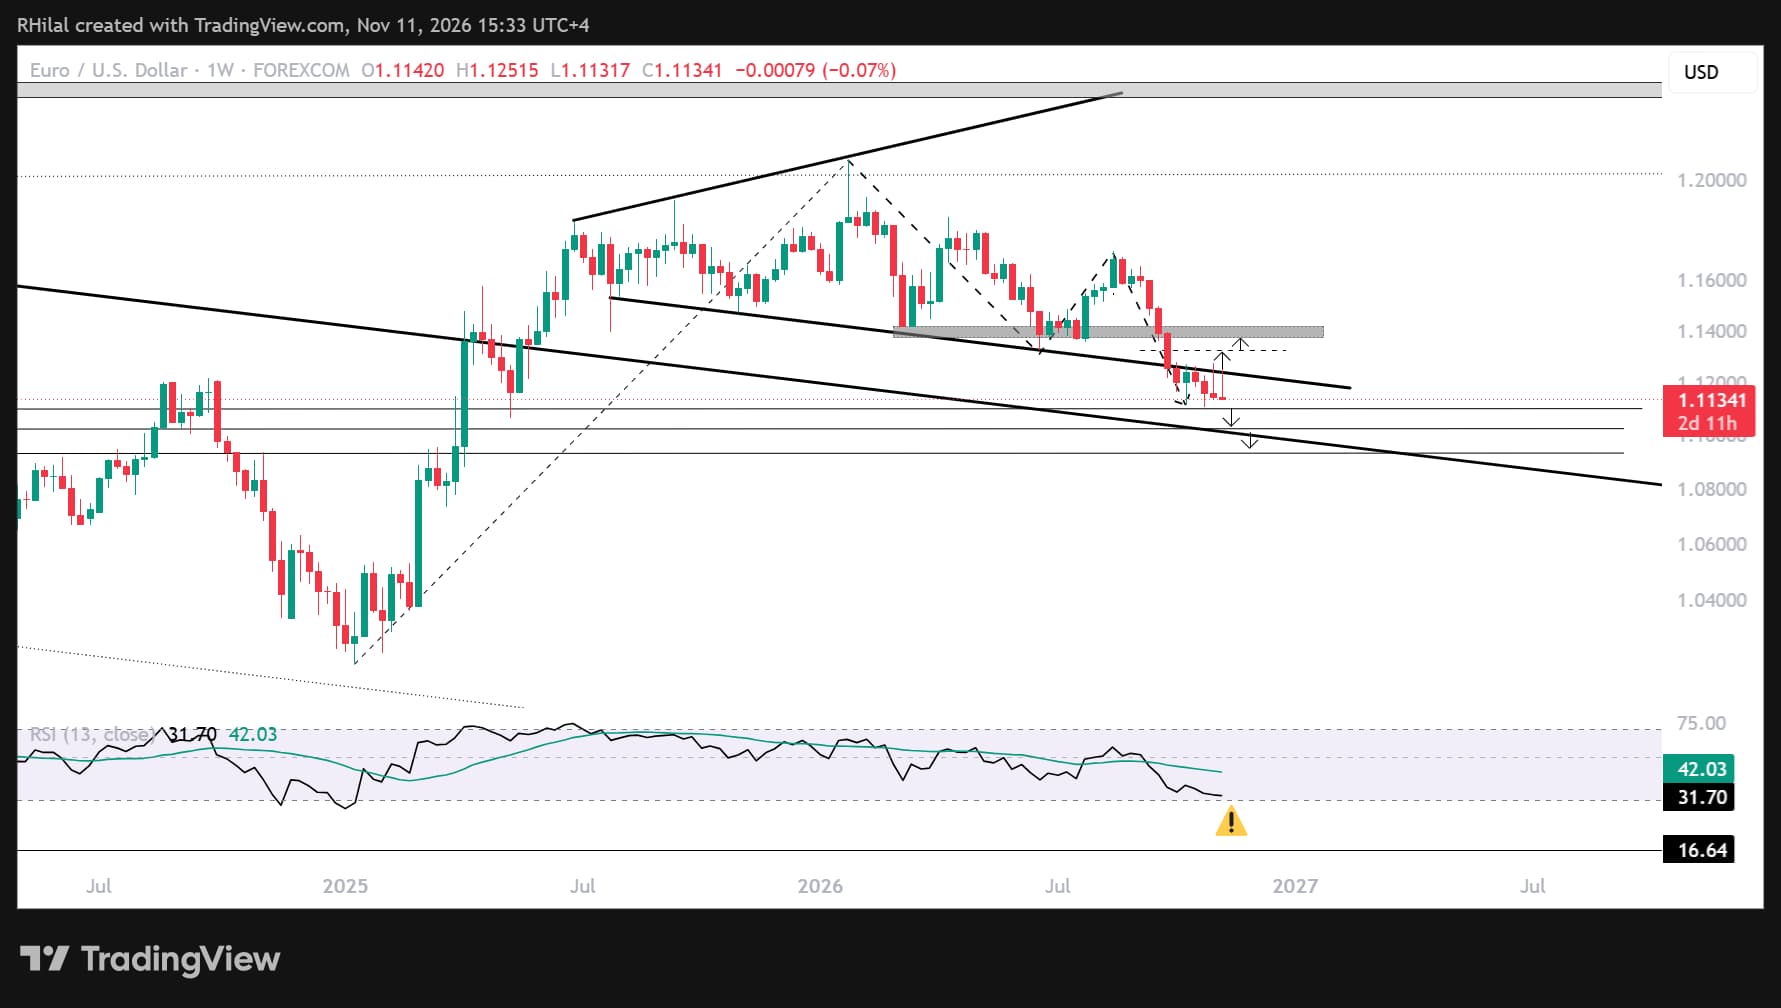
The DXY’s strength is limiting EUR/USD’s rebound potential, keeping the pair below a multi-month descending trendline drawn from August 2025. This trendline has acted as resistance since October, near 1.1260.
A close above 1.1260 would bring bullish reversal risks into focus. This scenario aligns with weekly RSI testing oversold conditions last seen in 2025 and daily RSI rebounding from oversold conditions last seen in 2015. The 1.1320–1.1420 resistance zone would then become the next area to watch for confirmation.
On the downside, the 2026 decline in EUR/USD may represent a three-leg corrective pattern. Using the January, July and August 2026 extremes, the pair is currently testing the 78.6% Fibonacci extension near support at 1.11.
If EUR/USD breaks below 1.11, the 100% extension near 1.10–1.0930 would come into focus. This historical confluence zone could mark either another long-term dip-buying opportunity or a continuation of the euro’s decline within the descending parallel channel in place from 2008 to 2025.
Silver Price Outlook: Weekly Time Frame – Log Scale
Source: TradingView
Bullish rebounds in silver and gold are moving in tandem with U.S. indices, despite a lack of confirmation from headlines. This may indicate that markets are pricing in a potential de-escalation. A possible 25-basis-point rate hike remains a near-term hurdle, while a sustained bearish shift in crude oil would add technical support to the de-escalation scenario.
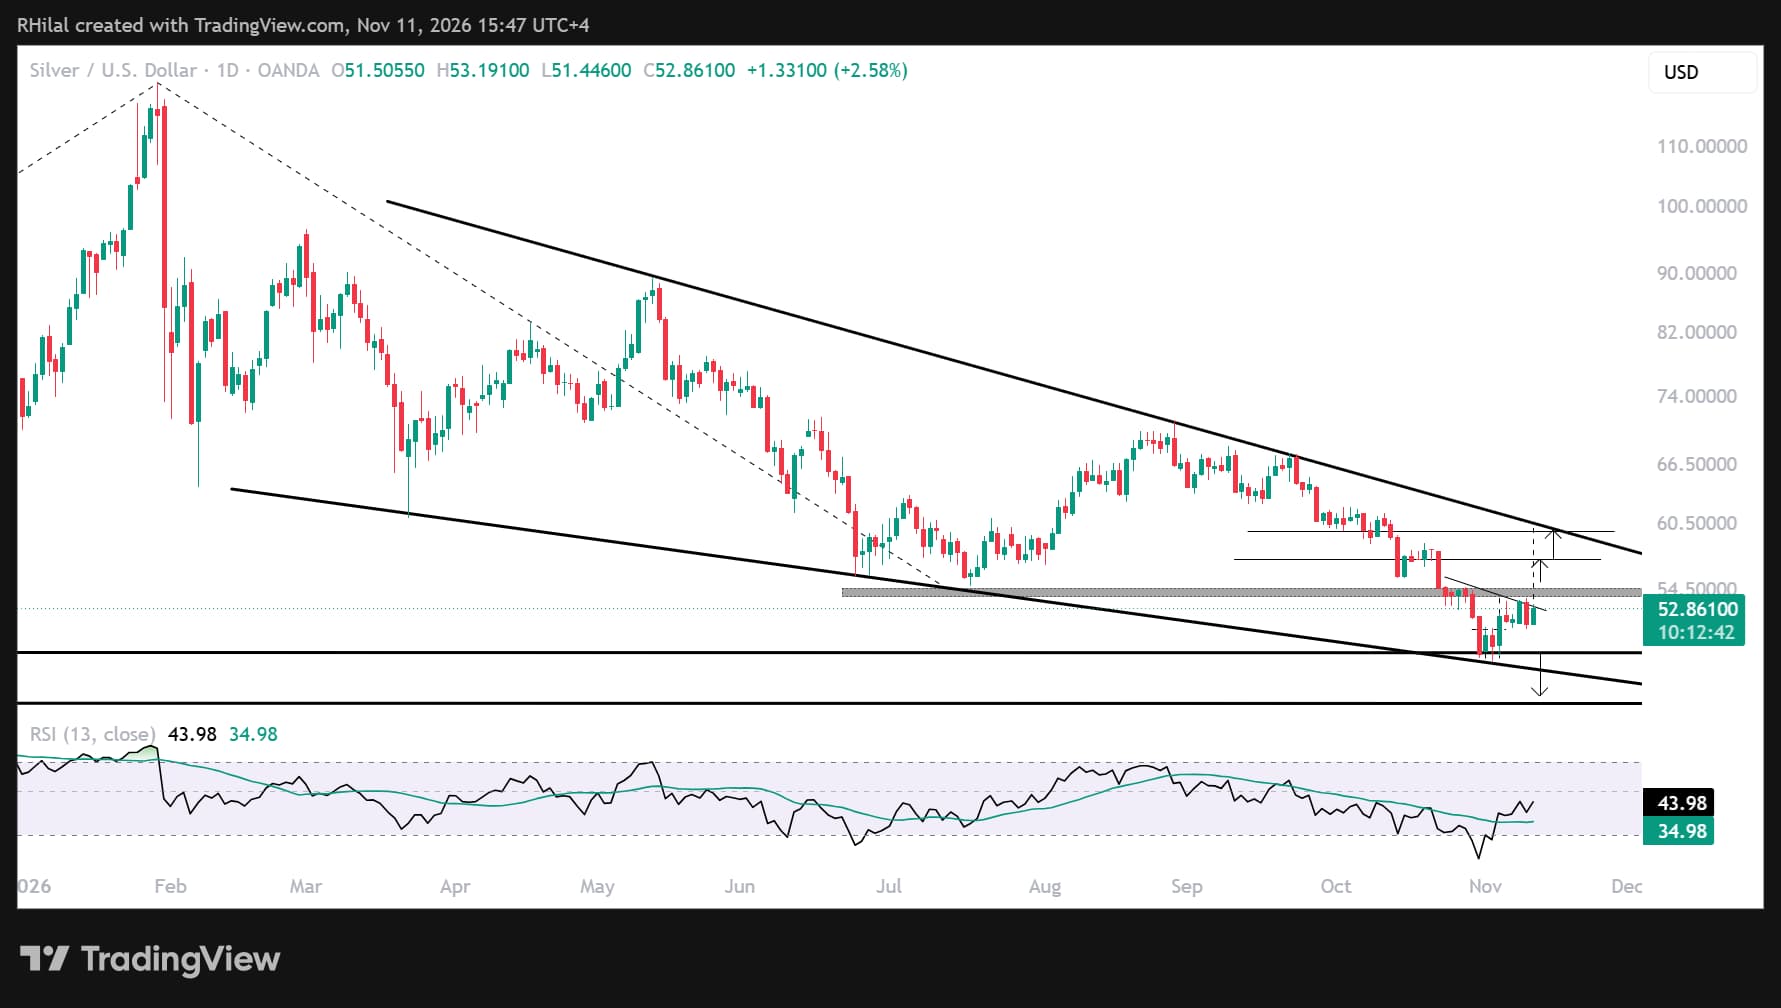
Silver’s rebound from the 48.60–49 support zone may mark a longer-term base. This area aligns with:
- Multi-month descending support in place since February 2026
- Multi-decade resistance turned support, spanning levels from 1980, 2011 and 2025
- Daily oversold momentum last seen in 2022
If this support zone gives way, the next key support is near 45, aligning with the October 2025 support. This level is comparable to gold’s recent rebound from 3,870.
On the upside, a potential inverse head-and-shoulders pattern is forming. A breakout above 54.80 could expose 57 and then the psychological 60 level, where silver would test seven-month descending resistance. A rejection there could renew bearish pressure, while a sustained breakout would strengthen the case for a longer-term bullish shift.
Oversold readings in silver and Nvidia, at levels last seen in 2022, may point to longer-term bullish setups following this year’s steep sell-offs.
Written by Razan Hilal, CMT
Follow on X: @Rh_waves
Related tags:


The complete CFD trading experience
Award-winning platforms, competitive spreads, low commissions and dedicated support.
We live and breathe the markets and are dedicated to helping traders realise their ambitions as we continue to set the industry bar.
Economic calendar
Web Trader platform
Our sophisticated web-based platform is packed with features.
Related articles
EUR/USD, DXY, Silver Price Outlook: Bullish Rebounds on Hold?
EUR/USD, DXY, Silver Price Outlook: Bullish rebounds across currency markets, precious metals, and risk assets are facing renewed pressure as U.S. CPI comes in above expectations and oil-tanker attacks persist in the Strait of Hormuz.

DAX Near Record Levels as Earnings Strength Supports Bulls
The DAX remains firmly positioned near record highs after reclaiming the 26,000 level and extending its recovery toward 26,700. Strong earnings momentum, improving industrial activity and renewed confidence in semiconductor and energy-transition stocks continue to support sentiment. With Siemens Energy and Infineon delivering upbeat signals for 2027, investors are increasingly focused on corporate fundamentals rather than macroeconomic uncertainty.


Nasdaq 100 Outlook: Slingshot rally or false dawn?
Nasdaq 100 futures are threatening to reclaim the 200-day moving average following their largest initial breakdown in more than 26 years. History suggests getting back above it is one thing, staying there another.

StoneX Europe Ltd may make third party material available on this website which may contain information included but not limited to the conditions of financial markets. The material is for information purposes only and does not contain, and should not be construed as containing, investment advice and/or investment recommendation and/or an investment research and/or an offer of or solicitation for any transactions in financial instruments; any decision to enter into a specific transaction shall be made by the client following an assessment by him/her of their situation.
StoneX Europe Ltd makes no representation or warranty and assumes no liability as to the accuracy or completeness of the information provided, nor any loss arising from any investment based on a recommendation, forecast or other information supplied. You should always seek independent advice as to your suitability to speculate in any related markets and your ability to assume the associated risks, if you are at all unsure. We are not under any obligation to update any such material. Any opinion made may be personal to the author and may not reflect the opinion of StoneX Europe Ltd.