



ASX 200 Market Outlook: Santa’s Rally Arrives Early for Materials
Materials hit record highs as December seasonality kicks in early, while the ASX 200 grinds higher on low volatility and banks show tentative signs of stabilising.
Share this:

It has been a quiet start to the month for the Australian share market, with the ASX 200’s weekly range the smallest in six years at just 0.72%. Volatility may return as December progresses — ideally to the upside if the Santa rally continues to build.
Low index volatility hasn’t stopped materials from surging to fresh record highs. Rising copper prices have pushed the mining index (XMM) to new highs alongside Rio Tinto (RIO), while Fortescue (FMG) extended its rally to reach an 18-month peak, in line with my bullish outlook.
View related analysis:
View related analysis:
ASX 200 Strengthens as Materials Hit Record Highs
ASX 200 Market Snapshot
- The Australian share market rose for a third straight session on Thursday, though overall volatility remains subdued.
- The 30-day ASX 200 VIX slipped to a 44-day low at 10.6, signalling muted expectations for near-term market swings.
- The ASX 200 closed back above its 200-day EMA and is now testing resistance at the November high of 8649.3.
- Six of the eleven sectors declined, led by Real Estate (XRE) and Consumer Staples (XSJ), while Materials (XMJ) and Financials (XFJ) drove the five advancing sectors.
- The ASX 200 Banks Index (XBK) posted a bullish outside day, though the rebound is still modest when set against November’s 8% decline.

Chart analysis by Matt Simpson - source: ASX, LSEG


ASX 200 Sector Analysis
It is certainly a mixed picture for the local share market.
- Technology (XIJ) continues to lag despite the Nasdaq recovery, forming a shooting star and a potential lower high beneath 2400.
- Consumer staples (XSJ) — typically a defensive sector — is threatening a downside break from its rising corrective channel, which would imply a continuation of the broader downtrend.
- Materials (XMJ) is grinding higher and may extend gains if its strong December seasonality pattern repeats.
- Banks (XBK) posted a bullish outside day, suggesting they’re not ready to roll over just yet. Still, the structure looks corrective, and further weakness remains a reasonable risk scenario.
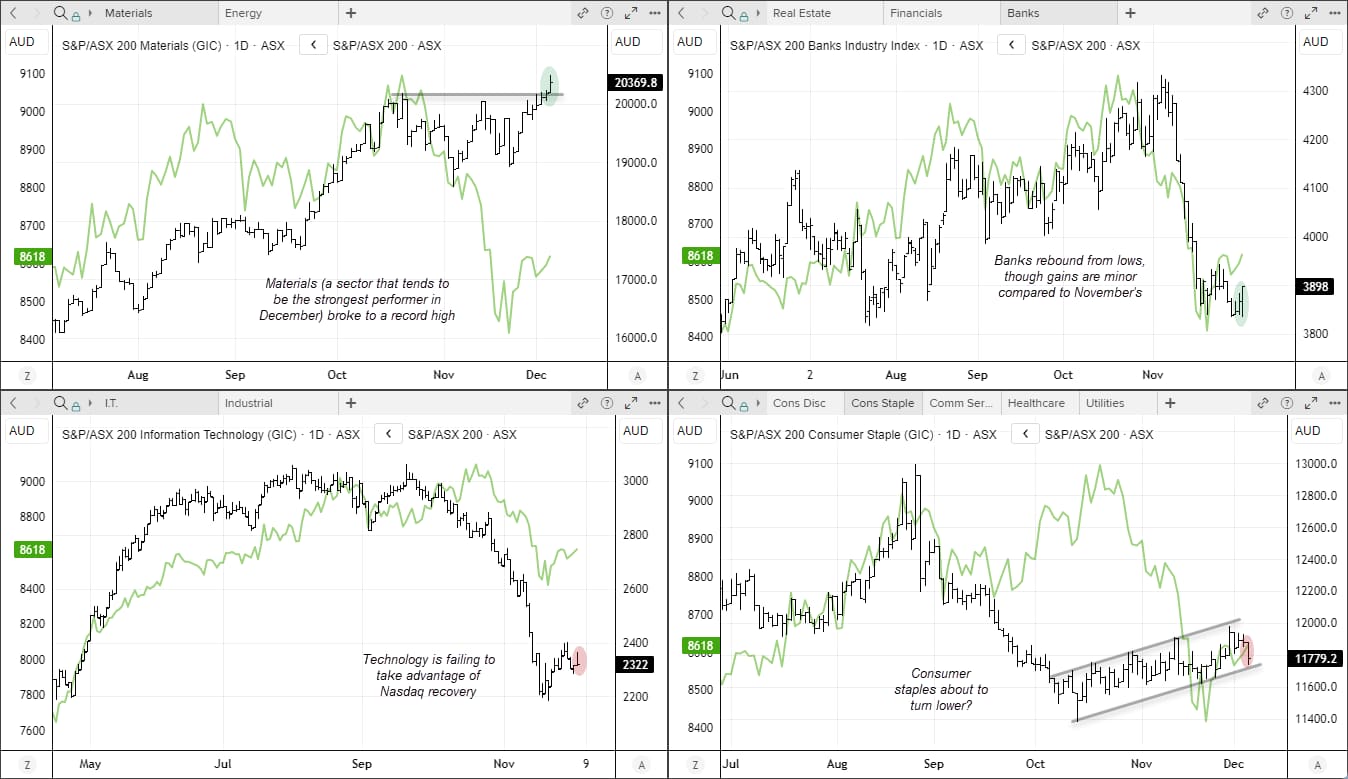
Chart analysis by Matt Simpson - source: ASX, LSEG


ASX 200 Sector Seasonality for December
I analysed ASX seasonality in a previous post, where I highlighted that December tends to deliver positive returns of around 1.8%, with a 66% win rate, and that gains typically begin to appear in the second half of the month. That said, volatility tended to be lower than in November and April.
Today I am comparing ASX 200 sector performance in December.
- Ten of the 11 ASX sectors tend to deliver average positive returns.
- The materials sector (XMJ) is the standout, with an average return of 2.8%, followed by health care (XHJ) at 1.5% and utilities (XUJ) at 1.4%.
- Only the real estate sector (XRE) has produced negative average returns, at -1% in December.
- The 10 rising sectors also delivered above-average returns when compared with their annual averages.
- Materials also recorded the highest win rate at 76%, followed by consumer staples (XSJ) and health care at 68%, and consumer discretionary at 64%.
- Technology (XIJ) has averaged the highest monthly trading range at 9.9%, although this is below its annual average of 12.3%.
- Energy and materials are the next most volatile sectors, at 9.1% and 8.4% respectively.
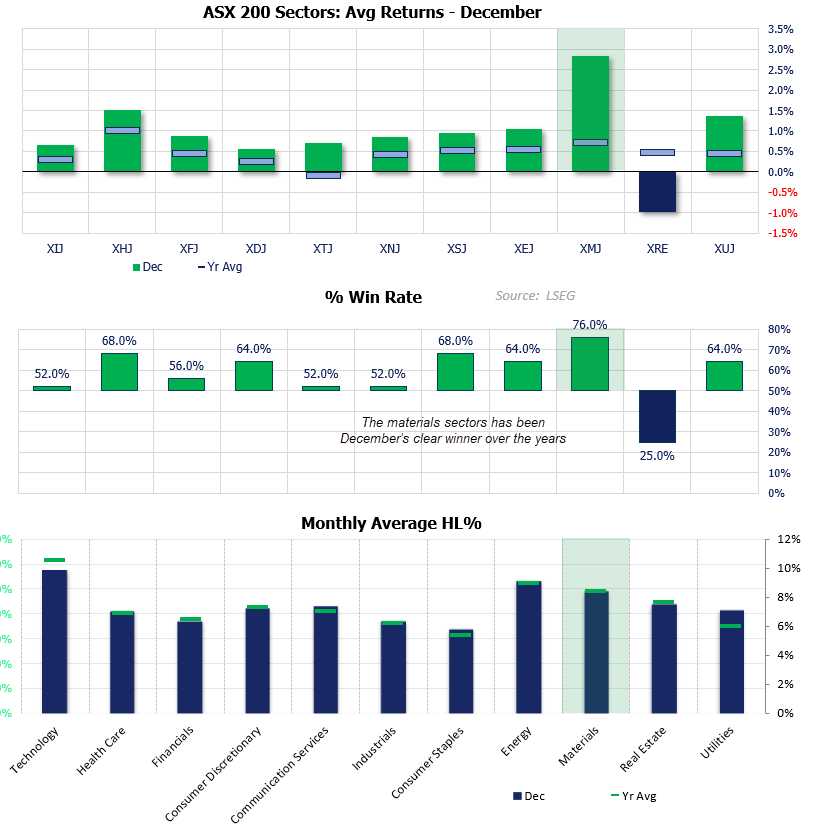
Chart analysis by Matt Simpson - source: ASX, LSEG
ASX 200 Futures (SPI 200) Technical Analysis
The –8.1% decline from the record high found support near the 8400 handle and the 38.2% Fibonacci retracement. The subsequent rebound is now stalling, with price consolidating into a potential bull flag. For the moment, SPI 200 futures remain pinned between the 200-day SMA and 200-day EMA, limiting directional conviction.
ASX bulls may look for dips toward 8500 as a buying opportunity in anticipation of a late-December rally. Alternatively, a clean breakout above the flag would imply upside potential toward the September low near 8750.

Chart analysis by Matt Simpson - Source: TradingView, ASX SPI 200 Index Futures
View the full economic calendar
View the full economic calendar
-- Written by Matt Simpson
Follow Matt on Twitter @cLeverEdge
How to trade with City Index
You can trade with City Index by following these four easy steps:
- Open an account, or log in if you’re already a customer
• Open an account in the UK
• Open an account in Australia
• Open an account in Singapore
- Search for the market you want to trade in our award-winning platform
- Choose your position and size, and your stop and limit levels
- Place the trade
Related tags:
Latest market news




The complete CFD trading experience
Award-winning platforms, competitive spreads, low commissions and dedicated support.
We live and breathe the markets and are dedicated to helping traders realise their ambitions as we continue to set the industry bar.
Economic calendar
Web Trader platform
Our sophisticated web-based platform is packed with features.
Related articles
Magnificent Seven Earnings Preview: Is the AI Boom Facing Its Biggest Test Yet?
After a wobble in the broader AI trade, the Magnificent Seven" stocks are reporting earnings in the coming week - see the key themes and Nasdaq 100 levels to watch!

Nasdaq 100 forecast: Tech stocks not out of woods yet
US index futures pushed higher in the first half of Friday’s session, taking cues from a strong performance from European equities. Both European and US equity futures extending yesterday’s impressive recovery after the sharp sell-off earlier in the week. But the lingering concerns around the AI investment cycle remain, while bond markets were easing lower again, lifting yields.


ASX 200 Outlook: A Rates Trade Disguised as a Stock Market?
Australian bond futures have exhibited a far stronger relationship with the ASX 200 than Wall Street over recent months. Now both markets are displaying remarkably similar price structures.

StoneX Europe Ltd may make third party material available on this website which may contain information included but not limited to the conditions of financial markets. The material is for information purposes only and does not contain, and should not be construed as containing, investment advice and/or investment recommendation and/or an investment research and/or an offer of or solicitation for any transactions in financial instruments; any decision to enter into a specific transaction shall be made by the client following an assessment by him/her of their situation.
StoneX Europe Ltd makes no representation or warranty and assumes no liability as to the accuracy or completeness of the information provided, nor any loss arising from any investment based on a recommendation, forecast or other information supplied. You should always seek independent advice as to your suitability to speculate in any related markets and your ability to assume the associated risks, if you are at all unsure. We are not under any obligation to update any such material. Any opinion made may be personal to the author and may not reflect the opinion of StoneX Europe Ltd.