



ASX 200 Morning Market Outlook: ASX Looking Shaky At The Highs
The ASX 200 stalled at record highs as momentum fades, with technical patterns hinting the market may be forming a near-term top.
Share this:

The ASX 200 traded flat on Thursday, marking its smallest daily range in over a week despite positive breadth across the market. Yet the lack of follow-through at record highs, coupled with reversal signals on the daily and weekly charts, hints that momentum may be fading. Energy’s rebound helped support the index, but heavyweight sectors like Financials and Materials are showing early signs of fatigue — leaving the broader ASX looking vulnerable if the rotation fails to broaden out.
View related analysis:
View related analysis:
Sector Rotation Fails to Lift Broader ASX Momentum
ASX 200 Market Snapshot
- It was effectively a non-event for the ASX 200 on Thursday, with the index closing flat and recording its smallest daily range in nine sessions.
- Despite the quiet session, breadth was positive with 135 stocks advancing (67.5%) compared to 53 decliners (26.5%).
- The index looks on track to form a small shooting star candle for the week within the upper wick of the prior week’s spinning top, which may suggest the market is topping out.
- A two-bar reversal pattern (dark cloud cover) also formed on Tuesday and Wednesday near the record high, hinting at potential exhaustion among bulls.
- Fridays have averaged the lowest daily ranges of the week at 63 points over the past three months, compared to 73.7 points over the past year.
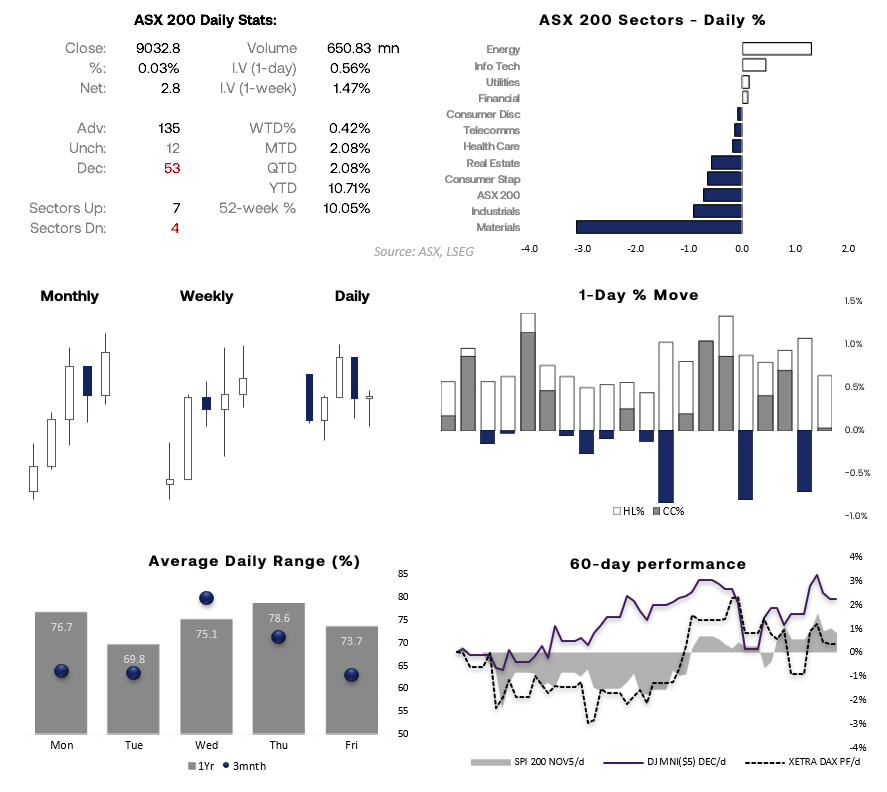
Chart analysis by Matt Simpson - source: ASX, LSEG


ASX 200 Sector Analysis
The Energy sector (XEJ) surged 3.2% on Thursday — its best day in four months — as higher oil prices helped confirm that the double bottom around the 8,000 level likely marked the end of its correction. The sector had underperformed the broader ASX 200 since August, but recent rotation now suggests a turnaround in relative strength.
Meanwhile, Financials (XFJ) and Materials (XMJ) — previously the main powerhouses driving the index — have started to lose momentum. Should these heavyweight sectors continue to falter, it would increase the risk of a deeper pullback for the ASX 200.
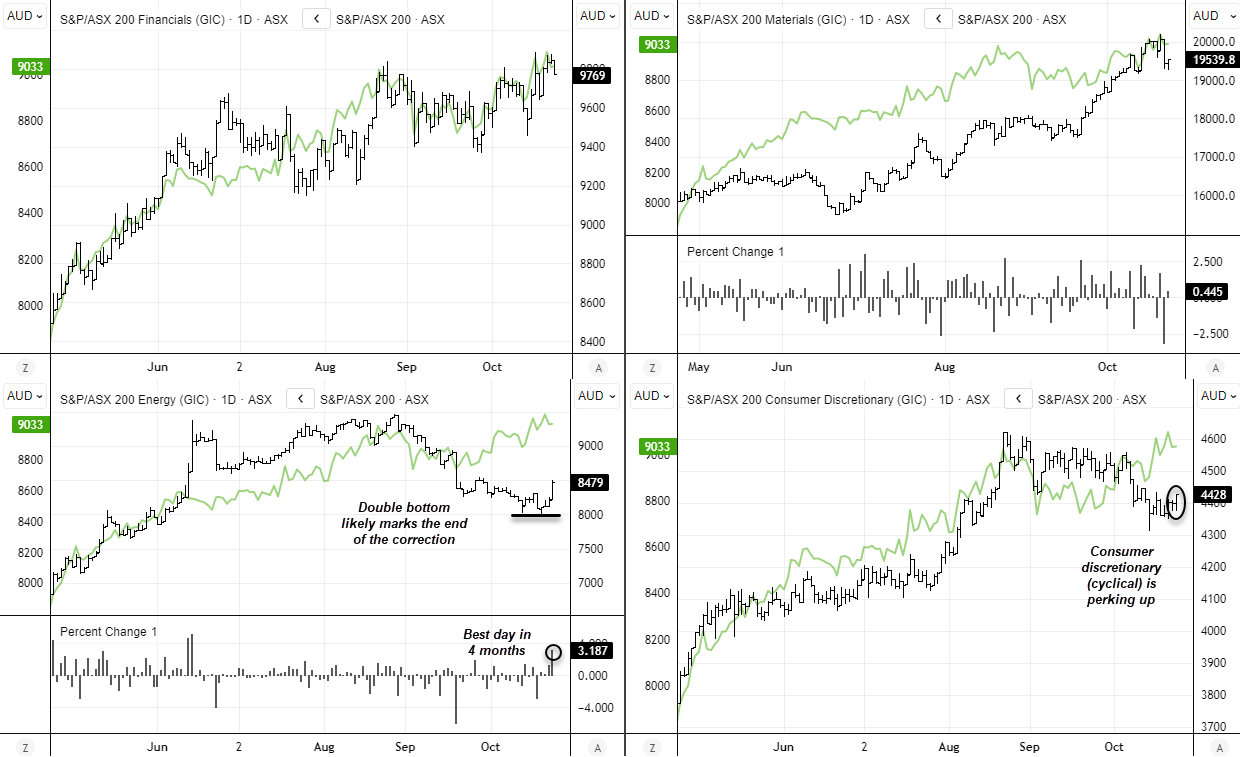
Chart analysis by Matt Simpson - source: ASX, LSEG
ASX 200 technical Analysis
The weekly chart shows a wide-legged doji formed last week and the ASX has mostly traded around its upper wick. The intraday chart displays a plethora of resistance levels overhead with a rising wedge. Bears could seek to fade into moves towards resistance levels on the assumption of a return back to 9000.
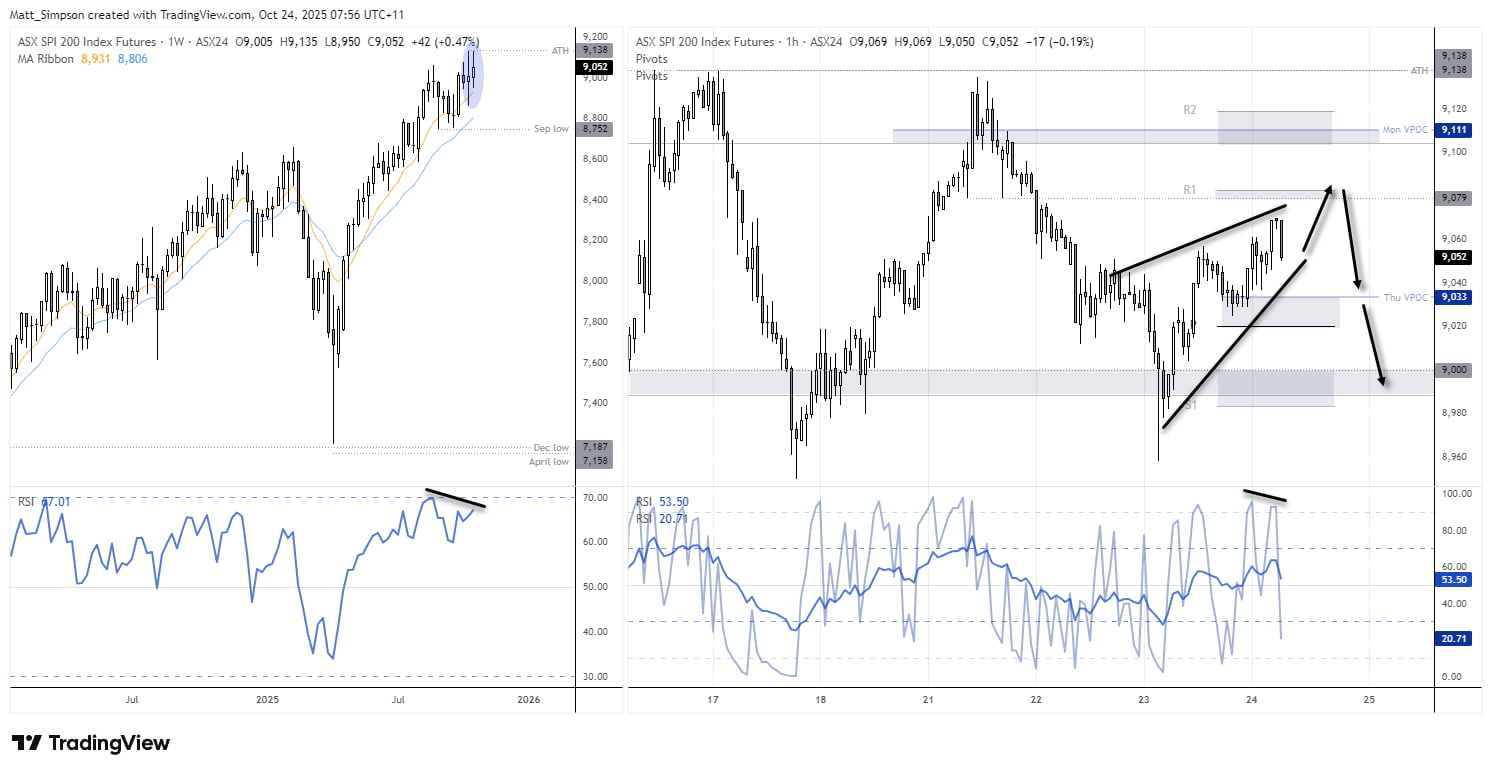
Chart analysis by Matt Simpson - Source: TradingView, ASX SPI 200 Index Futures
View the full economic calendar
View the full economic calendar
-- Written by Matt Simpson
Follow Matt on Twitter @cLeverEdge
How to trade with City Index
You can trade with City Index by following these four easy steps:
- Open an account, or log in if you’re already a customer
• Open an account in the UK
• Open an account in Australia
• Open an account in Singapore
- Search for the market you want to trade in our award-winning platform
- Choose your position and size, and your stop and limit levels
- Place the trade
Related tags:
Latest market news




The complete CFD trading experience
Award-winning platforms, competitive spreads, low commissions and dedicated support.
We live and breathe the markets and are dedicated to helping traders realise their ambitions as we continue to set the industry bar.
Economic calendar
Web Trader platform
Our sophisticated web-based platform is packed with features.
Related articles

S&P 500 forecast: AI linked stocks remain under pressure
And just like that, it is Friday again and the end of a volatile week. Today offers little on the macro calendar to change the prevailing narrative, leaving markets largely at the mercy of risk appetite, oil prices and the growing unease around the AI trade.


USD/JPY, Nikkei Break Lower as AI Meltdown Spreads
Thursday’s tech tantrum has become Friday’s fire sale. With Nikkei support giving way and the yen strengthening, could the selling start feeding on itself?

Nasdaq, Treasury yields and dollar face a major AI sentiment test
From crude to AI, the forces driving US markets have changed dramatically. Thursday's Nasdaq rout triggered an extraordinary Treasury rally, but the dollar barely moved. What happens next could depend on Nasdaq support.
StoneX Europe Ltd may make third party material available on this website which may contain information included but not limited to the conditions of financial markets. The material is for information purposes only and does not contain, and should not be construed as containing, investment advice and/or investment recommendation and/or an investment research and/or an offer of or solicitation for any transactions in financial instruments; any decision to enter into a specific transaction shall be made by the client following an assessment by him/her of their situation.
StoneX Europe Ltd makes no representation or warranty and assumes no liability as to the accuracy or completeness of the information provided, nor any loss arising from any investment based on a recommendation, forecast or other information supplied. You should always seek independent advice as to your suitability to speculate in any related markets and your ability to assume the associated risks, if you are at all unsure. We are not under any obligation to update any such material. Any opinion made may be personal to the author and may not reflect the opinion of StoneX Europe Ltd.